Application of Taguchi Design Approach in the Optimization of Die Design Parameters of a Two Cavity Injection Molding Tool for a Fan Blade Back Cover
Dr. Mohammed Yunus1, Dr. Mohammad S. Alsoufi2, Mohammed Salman Mustafa3
1. Department of Mechanical Engineering, Umm Al-Qura University, Makkah, Kingdom of Saudi Arabia
2. Department of Mechanical Engineering Umm Al-Qura University, Makkah, Kingdom of Saudi Arabia
3. Department of Mechanical Engineering, KNS Institute of Technology, Bangalore, India.
Abstract
Injection molding methods are widely used in plastic industries for the production of intricate and complex shapes of plastic, FRP parts with higher dimensional accuracy and greater reliability. In the present work an attempt has been made to improve the quality characteristic such as shrinkage of a two cavity injection molding tool for a fan blade back cover made from polypropylene (PP) by optimizing the die design parameters of injection molding tool using the Taguchi design approach. The performance of Fan Blade Back Cover is evaluated in terms of its shrinkage behavior by using the above measured data, Taguchi technique has been employed in optimization of various parameters, which controls the shrinkage, like injection and holding pressure, injection speed, melting temperature, cooling and holding time, with their significance in respect of shrinkage using orthogonal array, S/N ratio and ANOVA with their confirmation tests. Optimal combination of parameters is found out. A good agreement has been found between the estimated and experimental results within the preferred significant level. The optimum combination was verified experimentally and it was confirmed that Taguchi method successfully improved the quality of injection molding of polypropylene material as per customer’s specifications.
Keywords: Design of Experiments (DOE), Taguchi Method, Signal to Noise (S/N) Ratio, Optimization, injection molding, Polypropylene (PP), shrinkage test.
1. INTRODUCTION:
between parameters on the quality characteristic of the products to know their significant role.
We have made an attempt to describe the optimization of the injection molding process parameters for optimum shrinkage performance of a fan blade back cover plate into two stages. In the first stage, the effect of injection molding tool die design parameters such as injection speed and pressure, melting temperature, holding pressure and time and cooling time on shrinkage was investigated to obtain most and least significant parameters. In the second stage, effect of control parameters namely melting temperature, injection pressure and speed, holding pressure and time, cooling time and two interactions: between melting temperature and injection pressure, between injection pressure and holding pressure was explored to determine optimal combination of parameters for lowest shrinkage. In the following, the Taguchi method, ANOVA and confirmation test for obtaining optimal combination of parameters are discussed [18]-[19].
1.2.Taguchi method:
Taguchi method is a most powerful and popular statistical method used for the design of experiments (DOE) can be effectively employed in optimizing the process / product by using number of steps such as planning, conducting and evaluating results of orthogonal array (OA) experiments to determine the optimum levels of control parameters under very noisy environment[11]- [12]. The prime objective goal is to maintain the variance in the results very minimal even in the presence of noise inputs to make robust design process against all variations. Generally its focus is to optimize the quality characteristic of a process economically and for determining the optimal parameter settings of a process and thereby achieving improved process performance with reduced process variability. Taguchi’s method involves use of specially constructed tables called “orthogonal array” (OA) *14+ required for very less number of experimental runs in designing which are consistent and easy to apply. It is successfully used in the various fields of Engineering especially in manufacturing industries. The paper deals with
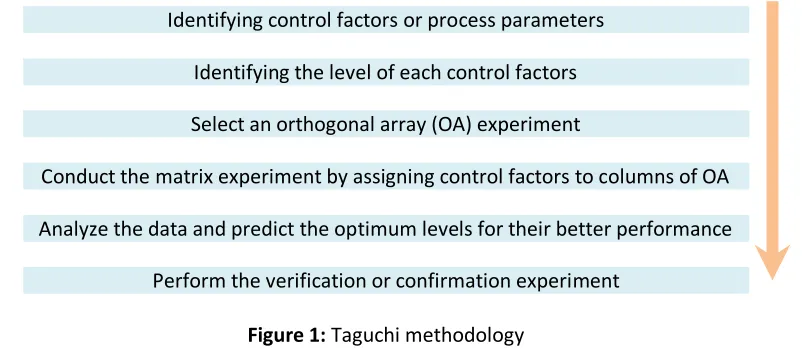
implementation of Taguchi's DOE methodology and technique in respect of shrinkage and optimization of process parameters. To find the optimal levels of usage parameters the following step by step procedure is followed for the DOE [15], [19].
Identifying control factors or process parameters
Identifying the level of each control factors
Select an orthogonal array (OA) experiment
Conduct the matrix experiment by assigning control factors to columns of OA
Analyze the data and predict the optimum levels for their better performance
Perform the verification or confirmation experiment
2. EXPERMENTAL METHODOLOGY:
The use of these OA tables make the design of experiments very easy and consistent and it needs relatively less number of experimental trials to study the entire parameter space [14]. Time, cost, and labor saving can be achieved by using this technique. These results can be transformed into a signal-to-noise (S/N) ratio. Usually, there are three categories of quality characteristic deviating from the desired values by measuring S/N ratio, i.e. the-lower-the-better, the-higher-the-better, and the nominal-the-better. The S/N ratio for each level of process parameters is computed. Regardless of the category of the quality characteristic, a greater S/N ratio corresponds to better quality characteristics. Therefore, the optimal level of the process parameters is the level with the greatest S/N ratio. Also, analysis of variance (ANOVA) is performed to see which process parameters are most and least significant. The optimal combination of the process parameters can be predicted using S/N and ANOVA analyses. Finally, a confirmation test is conducted to verify the optimal process parameters obtained from the total shrinkage. Shrinkage is the difference between the dimensions of mould and molding. When designing the plastic mould it is important to specify the proper material shrinkage in order to achieve a part that meets the dimensional requirement. So shrinkage for the polypropylene material is 0.01-0.015mm/mm. But according to customer specification the shrinkage factor taken for molding is 0.015mm/mm. Selection of the injection molding tool parameters and their levels were defined by varying the injection speed in the range 75 – 90 rpm (%), the melting temperature in the range 185 – 200 °C, the injection pressure in the range 120–150 bar, the holding pressure in the range 80 – 96 bar, the holding time in the range 5 – 10 sec and the cooling time in the range 5 – 10 sec were selected with available literature, machine technical data, plastics injection molding handbooks and consumer’s specification. Two levels of the first parameter and three levels each of the other five parameters were selected as shown in Table 1.
Table 1: Usage parameters and levels of the experimental design
Factor Parameter Unit Level 1 Level 2 Level 3
A Injection Speed rpm (%) 75 95 -
B Melting Temperature °C 185 195 200
C Injection Pressure bar 120 140 150
D Holding Pressure bar 80 88 96
E Holding Time sec. 5 8 10
F Cooling Time sec. 5 8 10
2.1. Selection of Orthogonal Array
An appropriate selection of an orthogonal array (OA) based on the total degrees of freedom of the parameters. In this study, we have each parameter at three levels except injection speed which is at two levels, therefore the total degrees of freedom (DOF) for the parameters are equal to 11. Generally, the degrees of freedom for the OA should be greater than or at least equal to those for the control factors.
Hence, mixed level 2-3 DOE using an L18 (2^1 × 3^5) orthogonal array with six columns and eighteen
rows were used in this study as shown in table 2 using Minitab software such that, each row represents an experiment with different combination of parameters and their levels.
2.2.Signal to Noise (S/N) Ratio
characteristic which influence the output due to external factors namely noise factors. The objective of any experiment is always to find the highest possible S/N ratio for the result which implies that the signal is much higher than the random effects of the noise factors or minimum variance. As mentioned earlier, there are three categories of quality characteristics, i.e. the-lower-the-better, the higher-better, and nominal-better [8]-[10] [12]-[15]. To obtain optimal molding performance, the-lower-the-better quality characteristic for shrinkage must be taken. Table 3 shows the experimental results for total shrinkage and the corresponding S/N ratio.
The mean S/N ratio for each level of the parameters is summarized along with delta and rank for total shrinkage as shown in table 4.
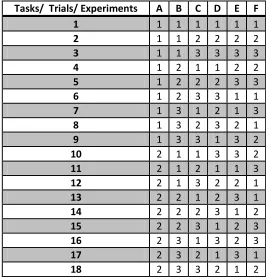
Table 2: Experimental plan using an L18 orthogonal array
Table 3: Experimental layout and summary of results for total shrinkage of mold A B C D E F Total Shrinkage S/N Ratio
75 185 120 80 5 5 0.013136 37.6307
75 185 140 88 8 8 0.013914 37.1310
75 185 150 96 10 10 0.014036 37.0551
75 195 120 80 8 8 0.013654 37.2948
75 195 140 88 10 10 0.013019 37.7084
75 195 150 96 5 5 0.013839 37.1779
75 200 120 88 5 10 0.012534 38.0382
75 200 140 96 8 5 0.012823 37.8402
75 200 150 80 10 8 0.012722 37.9089
90 185 120 96 10 8 0.013881 37.1516
Tasks/ Trials/ Experiments A B C D E F
1 1 1 1 1 1 1
2 1 1 2 2 2 2
3 1 1 3 3 3 3
4 1 2 1 1 2 2
5 1 2 2 2 3 3
6 1 2 3 3 1 1
7 1 3 1 2 1 3
8 1 3 2 3 2 1
9 1 3 3 1 3 2
10 2 1 1 3 3 2
11 2 1 2 1 1 3
12 2 1 3 2 2 1
13 2 2 1 2 3 1
14 2 2 2 3 1 2
15 2 2 3 1 2 3
16 2 3 1 3 2 3
17 2 3 2 1 3 1
90 185 140 80 5 10 0.013230 37.5688
90 185 150 88 8 5 0.013639 37.3043
90 195 120 88 10 5 0.014245 36.9268
90 195 140 96 5 8 0.013256 37.5518
90 195 150 80 8 10 0.012758 37.8843
90 200 120 96 8 10 0.012576 38.0091
90 200 140 80 10 5 0.012839 37.8294
90 200 150 88 5 8 0.013017 37.7098
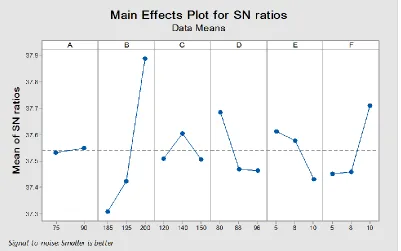
Table 4: The average response of S/N ratio for total shrinkage of mold
Level A B C D E F
1 37.53 37.31 37.51 37.69 37.61 37.45
2 37.55 37.42 37.60 37.47 37.58 37.46
3 - 37.89 37.51 37.46 37.43 37.71
Delta 0.02 0.58 0.10 0.22 0.18 0.26
Rank 6 1 5 3 4 2
3. RESULTS & DISCUSSION:
There are eighteen different tests were conducted using the process parameter combinations in the specified orthogonal array table to measure the sensitivity of quality characteristics of output from desired value. Taguchi method uses the S/N (signal-to-noise) ratio to determine the most significant parameter. To get the better performance, smaller shrinkage is desired. Hence smaller is better criteria has been selected and. A sample calculation for one parameter is shown below.
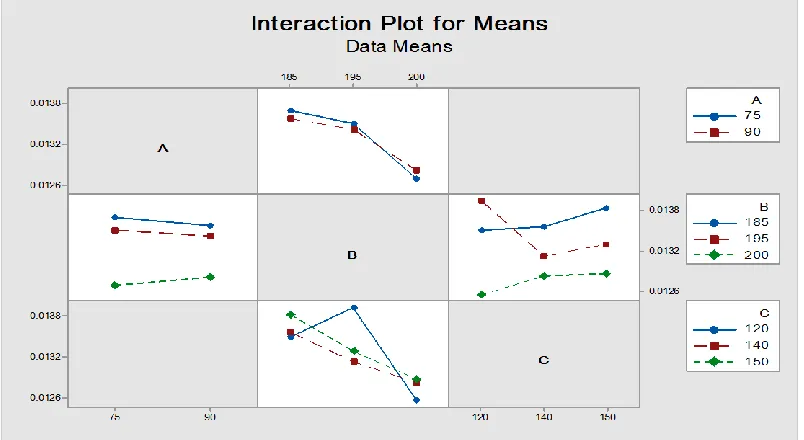
Figure 3: Average response S/N ratio of interaction of AXB and BXC graph for mold shrinkage
Figure 4: Average response of mean of interaction of AXB and BXC graph for mold shrinkage
Table 5: The optimal set of parameters for shrinkage characteristic of a mold Symbols Parameter Optimum Setting
A Injection Speed 90 % rpm
B Melting Temperature 200 0C
C Injection Pressure 140 bar
D Holding Pressure 80 bar
E Holding Time 5 sec.
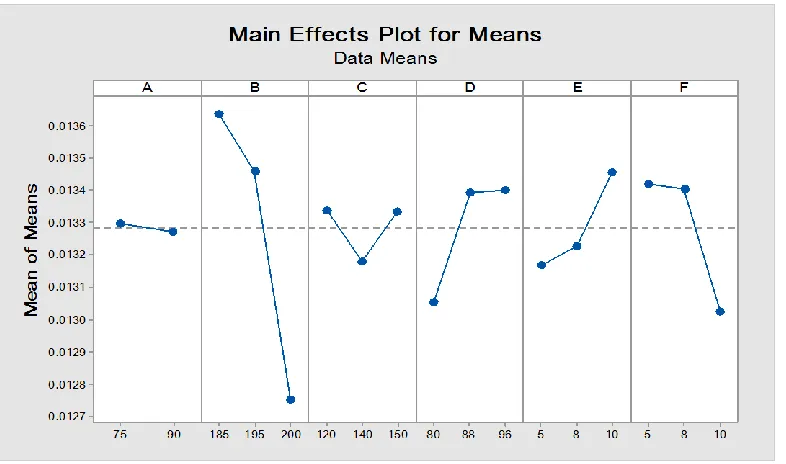
Figure 5: Average response mean of means for factors graph for mold shrinkage
From the above table 4 and figure 1 it is seen that most significant parameters can be determined by the Larger difference of S/N ratio. The experimental results have been compared with optimal parameters obtained by Taguchi Technique, it is found that most significant parameter that decreases total shrinkage is melting temperature (B) followed by cooling time (F), holding pressure (D), holding time (E), Injection pressure (C) and injection speed (A).
3.1 Analysis of Variance (ANOVA):
ANOVA is used to determine the most significant parameter affecting the output quality and characteristic [13]-[15] using the quantities such as degree of freedom (f), sum of squares (SS), variance (V), percent contribution of each parameter (F-ratio) and then contribution ratio or contribution of variance is determined. From the table 5 it is observed that highest contribution ratio is for Melting temperature (B) while Injection speed (A) is the lowest and cooling time (F), holding pressure (D), holding time (E), Injection pressure (C) have moderate value between the other two.
Table 6: ANOVA results for shrinkage characteristic of a mold
Source DoF Seq SS Adj SS Adj MS F P
A 1 0.000031 0.000031 0.000031 0.02 0.893
B 2 0.026465 0.026465 0.013233 8.35 0.018
C 2 0.000977 0.000977 0.000488 0.31 0.746
D 2 0.004673 0.004673 0.002337 1.47 0.301
E 2 0.002786 0.002786 0.001393 0.88 0.462
F 2 0.006034 0.006034 0.003017 1.90 0.229
Error 6 0.009505 0.009505 0.001584 - -
For the verification of results the confirmation test is conducted [10] and an optimum condition at the selected levels of significant parameters can be predicted such as A2, B3,C2, D1, E1 and F3. The final optimal set of combination of parameters is found out. The predicted average (M) of the response shrinkage of mold can be expressed as [14]-[19].
M = (A2-T) + (B3-T) + (C2-T) +(D1-T) + (E1-T) + (F3-T) +T, where T=overall average of S/N ratio.
Μ = (37.5484-37.6754) + (37.8893- 37.6754) + (37.6049.63- 37.6754)+ (37.6862- 37.6754) + (37.6129- 37.6754) + (37.7107- 37.6754) + 37.6754=37.675463 dB. A confidence interval (C.I) is evaluated = 0.33. Using
R = number of trials to run confirmation test, from ANOVA table ve and fe = 6 and Fα (1, 6) = 12.11 at 95%
confidence level and tabulated. At the 95% confidence level the estimated / predicted average of the shrinkage found to be in the range of 37.345463 dB < Shrinkage > 38.005463dB.
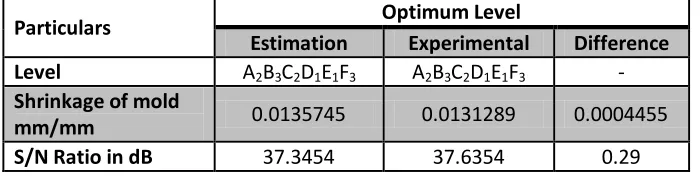
Table 7: The comparison of estimated and experimental results of shrinkage of a mold
Particulars Optimum Level
Estimation Experimental Difference Level A2B3C2D1E1F3 A2B3C2D1E1F3 -
Shrinkage of mold
mm/mm 0.0135745 0.0131289 0.0004455
S/N Ratio in dB 37.3454 37.6354 0.29
4. CONCLUSIONS
The following observations were made from the experiment / Taguchi analysis, for better performance of Injection molding tool die design. From the analysis of the Taguchi approach, the following can be concluded from the present work:
[1] The optimum conditions are A2, B3, C2, D1, E1, F3 i.e. injection speed (90 %rpm), melting
temperature
(200°C), injection pressure (140 bar), holding pressure (80 bar), holding time (5 sec), and cooling time (10 sec).
[2] The optimum total shrinkage is 0.012534 mm/mm of mold.
[3] Melting temperature is the most significant factor while injection speed is the insignificant or least
significant factor.
[4] The contribution of parameters is melting temperature (52.4%), holding pressure (3.6%), holding
time (0.9%) and cooling time (6.9%).
[5] The suspected interaction between factors injection pressure and holding pressure is not found
whereas; the interaction between melting temperature and injection pressure does exist.
[6] The optimal shrinkage is 0.013575mm/mm.
[7] From the ANOVA, contribution ratios in case of shrinkage characteristic optimization are tabulated.
[8] The estimated range for optimum shrinkage is 37.345463 dB < Shrinkage > 38.005463dB. The experimental results are in good agreement within the specified range.
REFERENCES:
[1] Harper, C.A., 2000, “Modern Plastic Handbook”. Mc Graw Hill Publishers.
[2] Chanda, M. and Roy, S.K., 1998, “Plastic Technology Handbook”, 3rd Edition, Revised and Expanded.
Marcel Dekker, Inc.
[3] Strong, A.B., 2000, “Plastics: Material and Processing”, 2nd Edition, Prentice hall, Inc.
[4] Ozcelik, B. and Erzurumlu, T., 2005, “Comparison of the warpage optimization in the plastic injection
molding using ANOVA, neural network model and genetic algorithm”. Journal of Material Processing Technology.
[5] Barriere, Th., Liub, B., and Gelin, J.C., 2003, “Determination of the optimal process parameters in
metal injection molding from experiments and numerical modeling”. Journal of Material Processing Technology, 143-144, pp.636-644.
[6] Tang, S.H., Tan, Y.J., Sapuan, S.M., Sulaiman, S., Ismail, N. and Samin, R., 2007, “The use of Taguchi
method in the design of plastic injection mould for reducing warpage”. Journal of Material Processing Technology, 182, pp.418-426.
[7] Erzurumlu, T. and Ozcelik, B., 2006, “Minimization of warpage and sink index in injection-molded
thermoplastic parts using Taguchi optimization method”. Journal of Material and Design, 27, pp.853-861.
[8] Jones, D.H.M. and Ellis, J.W., 1986, “Polymer Products: Design, Material and Processing”. Chapman
and Hall Ltd.
[9] Roy, R.K., 2001, “Design of Experiments using The Taguchi Approach: 16 Steps to Product and
Process Improvement”. John Wiley & Sons, Inc.
[10]Roy, R.K., 1990, “A Primer on the Taguchi method”. Competitive Manufacturing Series, Van Nostrand
Reinhold, New York.
[11]S.kamaruddin, Zahid A. Khan and S.H.Foong, “Application of Taguchi Method in the Optimization of injection Moulding Parameters for Manufacturing Products from Plastic Blend”, 2010, IACSIT
International J. Engineering and Technology, volume 2, number 6, December 2010, ISSN: 1793-8236, pp. 574 – 580.
[12]Barriere, Th., Liub, B., and Gelin, J.C., “Determination of the optimal process parameters in metal injection molding from experiment and numerical modelling”, 2003, J. Material Processing Technology, 143-144, pp. 636 – 644.
[13]Ferit Ficici, Murat kapsiz and Mesut Durat, “Applications of Taguchi design method, in the Optimization of injection Moulding Parameters for Manufacturing Products from Plastic Blend”, 2010, IACSIT international J. Engineering and Technology, volume 6, number2, January 2011, pp. 237 – 243.
[14]Roy R.K., 1990, “A primer on the Taguchi method”. Competitive manufacturing series, Van Nistrand Reinhold, Newyork.
Parameters Contribution Ratio
A -
B 52.4%
C -
D 3.6
E 0.9
methodology in describing the performance of coated carbide tools when turning AISI 1045 steel. Journal of Materials Processing Technology, 145, 46 (2004).
[16]Lin T. R. et al., “Optimization technique for face milling stainless steel with multiple performance characteristics” Int. J Adv Manufacturing Technology, volume 19, 330 (2002).
[17]P. Sharma, A. Verma, R.K. Sidhu, O.P. Pandey, Process parameter selection for strontium ferrite sintered magnets using Taguchi L9 orthogonal design, Journal of Materials Processing Technology 168 (2005), pp. 147-151.
[18]Hari singh, Pradeep Kumar, “Tool wear optimization in turning operation by Taguchi method”, Indian Journal of Engineering and Material Sciences, volume11, February 2004, pp. 19-24. [19]Mohammed Yunus and Dr.J.Fazlur Rahman unus, “ Optimization of usage parameters of ceramic