© 2018 IJSRCSEIT | Volume 3 | Issue 3 | ISSN : 2456-3307
A Novel Music Emotion Classification Method Using SVM
Harthi Vasudevan*1, Sathya M2
*1Department of Computer Science, Pondicherry University/Pondicherry, Tamil Nadu, India 2Department of Computer Science, Pondicherry University/Pondicherry, Tamil Nadu, India
ABSTRACT
The Emotion is crucial to living and learning. Music plays a important role on the emotion of the human thoughts. In this study, The emotion classification for the Tamil music database is created and analyzed. For obtaining the data, the applied feature is extracted and Analyzed. Emotion classification analysis represents the user`s perspective and effectively meets the user's retrieval need. The proposed model is based on Support Vector Machine (SVM) which will search and optimize the efficient feature for the Retrieval of Emotions. In this work two datasets are created they are Tamil Music Feature Library and Tamil Music Emotion Library. Secondly, the comparison of Linear Regression , Support vector machine and Support vector machine ( SVM) which provide that SVM has the best performance on analyzing the correct feature which will classify the maximum number of correctly classified songs. Finally, SVM model is built for the Tamil Music Dataset and the emotion recognition for each song were experimented. Those experimented Results show that our Model is effective in terms of retrieval Performance.
Keywords: Music Emotion Recognition, Support vector machine, Linear Regression , Tamil Music Database.
I.
INTRODUCTION
Emotion recognition is the one of the main factor which plays a major role in making the human and machine interactions more natural. In spite there are different techniques to boost machine intelligence, machines are still not able to make out human emotions and expressions correctly. Emotion recognition automatically identifies the emotional state of the human from his or her speech. Usually recognition task focuses on extracting features from audio. It is obvious that though music itself contains some expressions of the vocalists, it can manipulate our mind. From digital signal processing point of view, the music is the combination of emotion vocalist tone and Linguistic information. In this paper, audio features from the input music files are extracted by using Music information retrieval toolbox and these are intended to use in the emotion classification system. Musical aspects definitely play
an important role in deciding the emotion of a song. Even so, most people are able to connect the words of a song better than its musical features. In most cases, the words of the song are what truly express the emotions associated with the music. Emotion feature, being as the high-level feature of multimedia data, comes closer to human cognition.
value, such as the way fear inspires the fight-or-flight response. Plutchik’s emotion wheel helps us look at literacy through a broader lens. Literacy means “a person’s knowledge of a particular subject or field.” So enhancing emotional literacy means not only having words for emotions, but understanding how different emotions are related to one another and how the tend to change over time.
Baixi Xing, proposed the Chinese folk music and image by Machine learning approach on the emotion aspect to explore cross-media retrieval by semantics could achieve encouraging performance. The optimization algorithm which include Differential evolutionary algorithm – Support vector machine for the emotion retrieval based on the images.
Sameh Souli The support vector machines method based on Gaussian Kernel is used to classify the datasets due to its capability to deal with high-dimensional data. Paul Ruvolo Audio classification typically involves feeding a fixed set of low-level features to a machine learning method, then performing feature aggregation before or learning. Mengu Qiau[39] Experimental results show that our approach is successful in discriminating MP3 covers and the steganograms generated by the stenographic tool, MP3Stego, in each category of signal complexity, especially for the audio streams with high signal complexities that are generally more difficult to steganalyze. Antonio M.Rinaldi manage and share ontology in the WEB. The system provides a graphical interface to add multimedia features are automatically extracted using algorithms based on MPEG-7 descriptors.
Win De Mulder structured overview makes it possible to detect the most promising techniques in the fields of recurrent neural networks, applied to language modelling, but it also highlights the techniques for which further research is required. Chu Guan[42] enhanced by this new formulation, we develop the SMO method for optimizing the MKLA
dual and present a theoretical analysis to show the lower bound of our method, Debora C.Correa[50] A number of approaches use such musical information to process, retrieve and classify music content.
In this paper, the emotion of the Tamil songs can be retrieved by the Particle swarm optimization- Support vector machine(PSO-SVM) model. The efficiency of the model can be experimentally verified with other models.
The organization of this document is as follows. In Section 2 (Methodology), This section will give the detail of the classifiers used in the system.
In Section 3(Experiments),This sections will explain the Music Library Dataset and Music Emotion Dataset. In Section 4 (Applying Classifiers), the classifiers are applied and results are obtained. In Section 5(Implementation Results), The comparison of the each classifier results will be occurred. In Section 6(Conclusion and Future works), The work of the proposed model is concluded and the future works on this methods will be explained.
II.
METHODOLOGYIn this Section the Classifiers like, Linear Regression , Support Vector machine is explained.
2.1 Linear Regression
modeler might want to relate the weights of individuals to their heights using a linear regression model. Before attempting to fit a linear model to observed data, a modeler should first determine whether or not there is a relationship between the variables of interest. This does not necessarily imply that one variable causes the other (for example, higher SAT scores do not cause higher college grades), but that there is some significant association between the two variables. A scatterplot can be a helpful tool in determining the strength of the relationship between two variables. If there appears to be no association between the proposed explanatory and dependent variables (i.e., the scatterplot does not indicate any increasing or decreasing trends), then fitting a linear regression model to the data probably will not provide a useful model. A valuable numerical measure of association between two variables is correlation coefficient, which is a value between -1 and 1 indicating the strength of the association of the observed data for the two variables.
2.2 Support Vector Machine
Support vector machine simulations are carried out on nonlinear problems previously studied by other researchers using neural networks. This allows initial comparison against other techniques to determine the feasibility of using the proposed method for nonlinear detection. An SVM is a method for separating clouds of data in the feature space using an optimal hyperplane. By consequence of Cover’s theorem, a nonlinear mapping from the pattern space to the higher dimensional feature space is more likely to create linearly separable clouds of data.
The SVM nonlinearly maps inner products of the pattern space data, as opposed to the data itself, via a kernel. That is, the pattern space maps to a nonunique generalized surface in the feature space. Thus, the projection does not have the full dimensionality of the feature space, and there are mechanisms for controlling the capacity of the SVM. Furthermore, data points near the optimal
hyperplane called support vectors are used as a basis for the model. Consequently, an SVM is a nonparametric learning machine for which capacity can be controlled and whose solution is familiar to optimization theory. The equation for making a prediction for a new input using the dot product between the input (x) and each support vector (xi) is calculated as follows:
f(x) = B0 + sum (ai * (x,xi))
This is an equation that involves calculating the inner products of a new input vector (x) with all support vectors in training data. The coefficients B0 and ai (for each input) must be estimated from the training data by the learning algorithm.
III.
EXPERIMENTSIn this section the Music Library Dataset, Music Emotion Dataset and Music Emotion Feature Library are explained
3.1 Music Library Dataset
In this paper, we proceed to build up the music emotion library based on the Tamil Music Collection.
3.1.1 Preprocessing
To explore different ways to make a collection for Tamil music such as following:
Timeline of Tamil Language based music development is about the search on the Film based music with different Generations.
From each Generations the movies are selected on equal number.
Each Song now will be collected in the Dataset
Then we need to transform all the music in the collection to the same format for feature extraction. The music format of the songs in albums is .mp3, which could preserve most of the audio information. However, the formats to the music are diverse. As a result, the .wav format to be unified format. Then we cluster the collection of 1050 Tamil music songs in .wav format with first 1 minute 30 seconds and also with the maximal information.
3.1.2 Feature Extraction
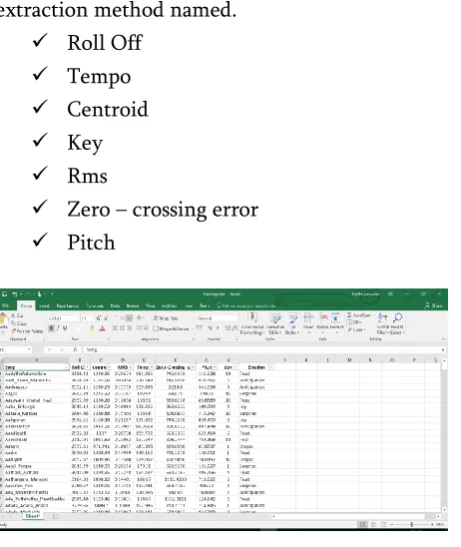
Once pre-processing has been done, the features are extracted using MIR toolbox. Seven features namely Roll Off, Centroid, RMS, Tempo, Zero-crossing rate, Pitch and Key are extracted for each song. These extracted values are exported to excel sheet and are stored.
3.2 Music Emotion Dataset
The Emotion of the Data set is classified using the theory obtained.Every song has undergone a feature extraction method named.
Roll Off
Tempo
Centroid
Key
Rms
Zero – crossing error
Pitch
Figure 2. After Extracting 8 Features and Emotion Database.
3.2.1 Classification of Emotion
According to Robert Plutchik`s wheel of emotions. The wheel is used to illustrate different emotions in a compelling and nuanced way. Plutchik first proposed his cone-shaped model (3D) or the wheel model (2D) in 1980 to describe how emotions were related. He suggested 8 primary bipolar emotions: joy versus sadness; anger versus fear; trust versus disgust; and surprise versus anticipation. Additionally, his circumplex model makes connections between the idea of an emotion circle and a color wheel. Like colors, primary emotions can be expressed at different intensities and can mix with one another to form different emotions. Plutchik proposed that eight defense mechanisms were manifestations of the eight core emotions. According to his theory the 8 emotions:
YEMOTION = [ ƒJoy, ƒSadness, ƒAnger, ƒFear, ƒTrust, ƒDisgust, ƒSurprise, ƒAnticipation].
The Emotions are obtained from the following theory. Those emotions are to be used in the dataset. 3.2.2 Emotion Labelling Experiment
Now, The Data collection is applied for this work consists of 550 music clips of relevant Tamil Songs.
20 Volunteers are invited to participate in the experiment. Five volunteers have music profession background, while 15 volunteers are fond of music without music profession background.
The experiment does not require volunteer to have a prior preparation of test music theme and background. The volunteers only need a to select the emotions listed.
The volunteers are given an environment where no other disturbances occurred.
The volunteers are not supposed to see others during the session.
At the start of the session the volunteers are supposed to wear the headphones and keep the volumes at same level.
The results are collected in the excel format so the differences can be easily seen.
The Emotions are listed and they are selected by each volunteer based on them. If the Two similar emotions are selected y the volunteers then that particular song are rejected. So, from the experiment we get 500 songs.
3.3 Music Emotion Features Library
The experiment questionnaire results and the music features will form the database. And the music emotion recognition model will be got by a promising algorithm based on the database.
Each music clip will get an emotion and features such as YEMOTION will be got by the vector PSO-SVM based on the music features that ae mentioned: Vrolloff, Vcentroid, Vrms, Vtempo, Vzerocrossingrate, Vpitch, Vkey. Now, From the 500 music clips 250 are selected as Training set and rest 250 is selected as Testing set. So, from this model the emotions are the songs will be predicted and the checked for verification.
IV.
APPLYING CLASSIFIERSA. 4.1 Linear Regression
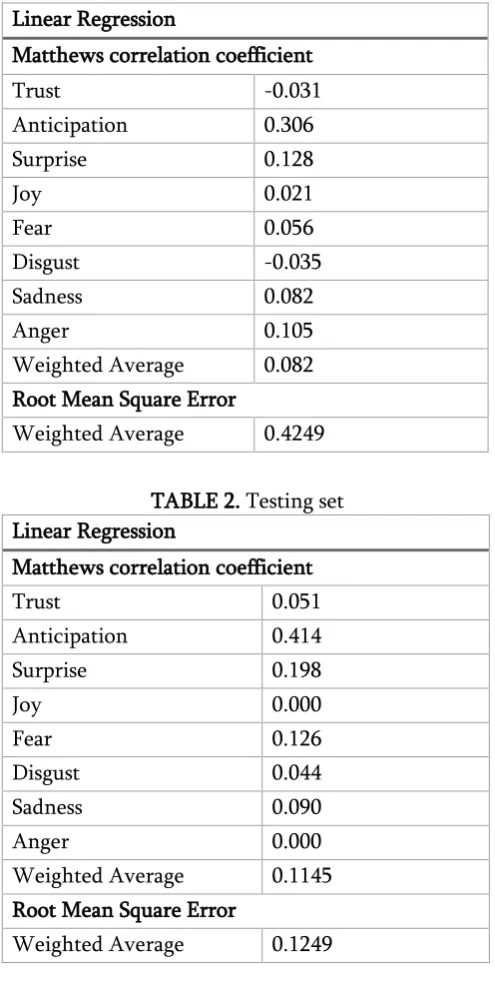
The recognition results are presented in MCC (Matthews Coefficient Correlation) and Root Mean square error. The results are obtained using weka. This result is for the Linear regression, Training and Testing set. In this Linear regression the MCC and RMSE are used for comparison. The value obtained is based on the classification of the classifier in WEKA. The .csv format is used.
For importing the file, then the features are set for cross-validation around 10. The the Linear Regression classifier was used.
Correlation coefficient : | MCC | =
Root Mean square error formula :
Table 1. Training Set
Linear Regression
Matthews correlation coefficient
Trust -0.031
Anticipation 0.306
Surprise 0.128
Joy 0.021
Fear 0.056
Disgust -0.035
Sadness 0.082
Anger 0.105
Weighted Average 0.082 Root Mean Square Error
Weighted Average 0.4249
TABLE 2. Testing set Linear Regression
Matthews correlation coefficient
Trust 0.051
Anticipation 0.414
Surprise 0.198
Joy 0.000
Fear 0.126
Disgust 0.044
Sadness 0.090
Anger 0.000
Weighted Average 0.1145 Root Mean Square Error
Weighted Average 0.1249
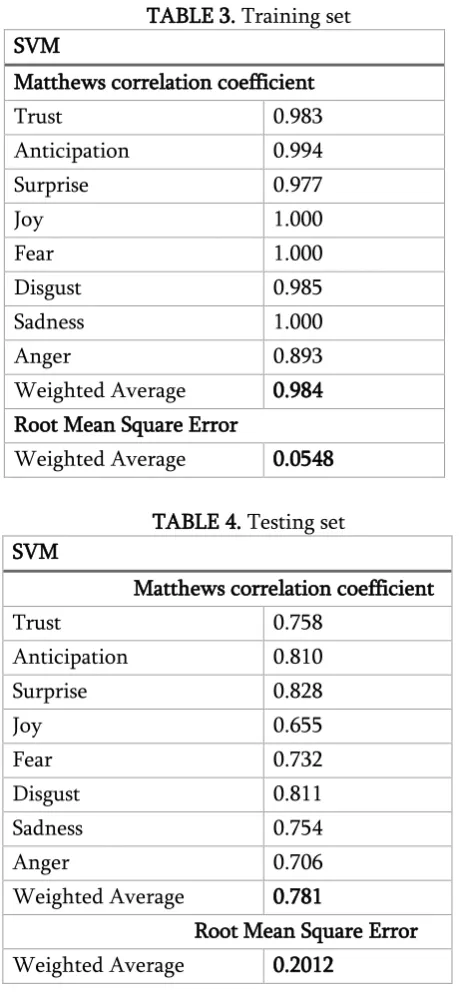
4.2 SVM
TABLE 3. Training set
Weighted Average 0.984 Root Mean Square Error
Weighted Average 0.781
Root Mean Square Error Weighted Average 0.2012
It is observed that from the Training results the weighted average for the MCC is 0.984 and RMSE is 0.0548 and For the Testing results the weighted average for the MCC is 0.781 and RMSE is 0. 2012.The results obtained are comparatively higher than the Linear Regression. efficiency. A Laptop with Intel core i3 7th generation with 4 GB memory was used in this experiment. The accuracy comparison of LR, SVM is shown in TABLE IV that there are three methods have a similar time cost on model building. However, the model performance of SVM appears to be the best.
5.1 Accuracy
TABLE 5. Accuracy
Algorithm Train Test
Accuracy Timing Accuracy Timing
Linear
The model performance differs for each emotion. That is Joy, Anticipation, Trust, Disgust, Surprise achieve high value of correlation coefficient. which is an exciting result for the Tamil Music emotion research. To be analysed, in the listening experiment, volunteers report that it is hard to define Angry, Sadness, Fear in Tamil music. As a result, these three emotion words are not clearly perceived by the volunteers and vague emotion rating makes errors in the model building from the source data layer. It is obtained that the Joy and Trust are choose for most of the songs provided. Self-Organising learning could be a suitable method to solve the problem of the imbalanced data classification. These results are valuable that it could contribute to the emotion characters for the Tamil music and make guidance to the future research of the Tamil Music Dataset.
VI.
CONCLUSIONthe model performance, we tested the new set of data with the songs. Future works can be based on the n-number of songs and can also concentrate in many emotions.
VII.
REFERENCES
[1]. Baixi Xing,Kejun Zhang, Emotion-driven chinese folkMusic image retrival based on DE-SVM,2014.
[2]. XIA, Y., Wang, L., WONG, K.-F., & Xu, M. (2008). Lyric-based Song Sentiment Classification with Sentiment Vector Space Model. International Journal of Computer Processing of Languages, 21(4), 309330. [3]. Oudenne, A. M., & Chasins, S. E. (2015).
Identifying the Emotional Polarity of Song Lyrics through Natural Language Processing.Cpsc65,
[4]. Hu, X. (2010). Improving mood classification in music digital libraries by combining lyrics and audio. The 10th Annual Joint Conference on Digital Libraries, 159–168.
[5]. Corona, H. (2015). An Exploration of Mood Classification in the Million Songs Dataset, (August).
[6]. Shanmugapriya, K., & Srinivasan, B. (2015). An Efficient Method for Determining Sentiment from Song Lyrics Based On WordNet Representation Using HMM. Ijircce.Com,1139– 1145. Retrieved from
[7]. Ascalon, E. I. V, & Cabredo, R. (2015). Lyric-Based Music Mood Recognition, 3, 1–8.
[8]. Adit J., Jessica A., Karishma K. and Rahul D., (2015),Emotion Analysis of Songs based on Lyrical and AudioFeatures, International Journal of AI & Applications(IJAIA), Vol.6, No.3.
[9]. Poria, S., Cambria, E., Howard, N., Huang, G. Bin, & Hussain, A. (2016). Fusing audio, visual and textual clues for sentiment analysis from multimodal content. Neurocomputing,174, 50– 59.
https://doi.org/10.1016/j.neucom.2015.01.095
[10]. Abburi, H., Sai, E., Akkireddy, A., Gangashetty, S. V, & Mamidi, R. (2016). Multimodal Sentiment Analysis of Telugu Songs, (Saaip), 48–52.
[11]. Han, K. M., Zin, T., & Tun, H. M. (2016). Extraction Of Audio Features For Emotion Recognition System Based On Music, 5(6), 53– 56.
[12]. P. M. Brossier, "The aubio library at MIREX 2006," MIREX 2006, p. 1, 2006.
[13]. D. Bogdanov, N. Wack, E. Gómez, S. Gulati, P. Herrera, O. Mayor, G. Roma, J. Salamon, J. R. Zapata, and X. Serra,"Essentia: An audio analysis library for music information retrieval.," in ISMIR, 2013, pp. 493–498. [14]. B. McFee, M. McVicar, C. Raffel, D. Liang, and
D. Repetto, "librosa: v0.3.1," Nov. 2014. J. Bullock and Volume 1 | Issue 1 | July-August 2016 | www.ijsrcseit.com U. Conservatoire, "Libxtract: A lightweight library for audio feature extraction," in Proceedings of the International Computer Music Conference, 2007, vol. 43.
[15]. G. Tzanetakis and P. Cook, "Marsyas: A framework for audio analysis," Organised sound, vol. 4, no. 03, pp.
[16]. H. Rawlinson, N. Segal, and J. Fiala, "Meyda: an audio feature extraction library for the web audio api," in Web Audio Conference. Web Audio Conference, 2015.
[17]. O. Lartillot and P. Toiviainen, "A matlab toolbox for musical feature extraction from audio," inInternational Conferenceon Digital Audio Effects, 2007, pp. 237–244.
[18]. G. Peeters, B. L. Giordano, P. Susini, N. Misdariis, and S. McAdams, "The timbre toolbox: Extracting audio descriptors from musical signals," The Journal of the Acoustical Society of America, vol. 130, no. 5, pp.2902– 2916, 2011.
musical signals," The Journal of the Acoustical Society of America, vol. 130, no. 5, pp. 2902– 2916, 2011.
[20]. C.McKay,I.Fujinaga, and P.Depalle,"jAudio:A feature extraction library,",in Proceedings of the International Conference onMusic Information Retrieval, 2005, pp.600–3.
[21]. T. Nasukawa, "Sentiment Analysis" : Capturing Favourability Using Natural Language Processing Definition of Sentiment Expressions,"pp.70-77,2003.
[22]. K. Dave, I. Way, S. Lawrence, and D.M. Pennock, "Mining the peanut Gallery: Opinion Extraction and Semantic Classification of Product Reviews," 2003.
[23]. Souraya E., Neamat E.G, and Moustafa M. , "Sentiment Analysis of Call Centre Audio Conversations using Text Classification", International Journal of Computer Information Systems and Industrial Management Applications ,ISSN 2150-7988 Volume 4 (2012) pp. 619 -627.
[24]. Downie, J. S., & Ehmann, A. F. (2009). Lyric text mining in music mood classification, (Ismir), 411–416.