DOI : https://doi.org/10.32628/CSEIT195261
Credit Card Fraud Detection Using Random Forest Algorithm
G. Niveditha
*1, K. Abarna
2, G. V. Akshaya
3Department of Computer Science and engineering, Sri Krishna College of Technology, Coimbatore, Tamilnadu, India
ABSTRACT
Credit card fraudulent happens through the account holder’s card number, card details and personal information. E-commerce payment system is providing the payment for online transaction. The model is used to identify whether a new transaction is fraudulent or not. Aim is to detect 100% of the fraudulent transactions while minimizing the incorrect fraud classifications. A standard scalar model is initially trained with the normal behavior of a card holder. If an incoming credit card transaction is not accepted by the trained standard scalar model with sufficiently high probability, it is considered to be fraudulent, which defines a plot of test perception as the y coordinate versus its 1-specificity or false positive rate (FPR) as the x coordinate, is an effective method of estimate the quality or performance of diagnostic tests. The significance of the application technique reviewed in the minimization of credit card fraud. Still some issues when genuine credit card customers are misclassified as fraudulent. SMOTE is a statistical technique for increasing the number of cases in your dataset in a balanced way. Random forest builds multiple decision trees and integrate them together to get stable prediction and accuracy of about 98.6%.
Keywords : SMOTE, ROC, FPR, Information Security, Data mining Techniques
I. INTRODUCTION
The rapid growth of credit card use on the Internet has made database security lapses particularly costly in some cases, millions of accounts have found the middle ground. credit card fraud happens when shopper give their credit card number to unfamiliar individuals, when cards are lost or stolen, when mail is diverted from the intended recipient and taken by criminals, or when employees of a business copy the cards or card numbers of a card holder. The most common forms of credit card fraud are Electronic or Manual Credit Card Imprints, CNP (Card Not Present)Fraud, account take over. By detecting this fraud cases different software are developed but by chance it can not existing much more years. So we are going for next stage for detecting fraudulent cases in credit card by machine learning approach. Machine learning approach is based on algorithm
performance, so here we use much accurate algorithm Random forest .this is the best algorithm for classification. These analysis has taken by choose different attributes of credit card. Credit Card Fraud Detection is a typical example of classification. The process have focused more on analyzing the feature modeling and possible business use cases of the algorithm’s output than on the algorithm itself[3]. We used the implementation of Regression Algorithm in the ‘ROCR’ package on the PCA transformed Credit Card Fraud data.
semi-supervised learning. The purpose of this paper is to identify the card is fraud or non-fraud and supervised learning algorithm is used. The supervised learning algorithm builds a mathematical model of a set of data that contains both the inputs and the desired outputs. Classification and regression algorithms are the types of supervised learning. Classification algorithms are used which gives some conclusion from the observed value where the outputs are restricted to a limited set of values. Regression algorithm is used to estimating the relationships among variables, it gives continuous outputs, meaning they may have any value within a range. The goal is to approximate function, that when you have new input data (x) that you can predict the output variables (Y) for that data. Linear regression model is used to fit data with the best hyper-plane which goes through the points. The output variable is a real or continuous value in regression[4].The following definitions are – in the current problem’s context.
True Positive - The fraud cases that the model predicted as ‘fraud.’
False Positive - The non-fraud cases that model predicted as fraud.
True Negative - The non-fraud cases that model predicted as non-fraud.
False Negative - The fraud cases that model predicted as non-fraud.
Accuracy - The measure of correct predictions made by the model, the ratio of fraud transactions classified as fraud and non-fraud classified as non- fraud to the total transactions in the test data.
Sensitivity - The ratio of correctly identified fraud cases to total fraud is Sensitivity or True Positive Rate or Recall.
Specificity - The ratio of correctly identified non- fraud cases to total non-fraud is Specificity or True Negative Rate.
Precision - The ratio of correctly predicted fraud cases to total predicted fraud.
Fig.1 Precision Recall Curve
II. RELATED WORKS
K. Drapala, 2017 deals with the important Cyber Security Your Users The first step for behavior profiling is user behavior model development including data collection. Transparent as much as possible with less user interaction. Monitoring individual actions to obtain training data is less costly and more effective in creating a behaviour profile.
Omar et. al. 2013,A Discussion of Privacy Challenges in User Profiling with Big Data Techniques: Personalization systems based on user profiles tend to assist the user Profiling Privacy and Security Issues
III. EXISTING SYSTEM
In credit card fraud detection, Data normalization is applied before Cluster Analysis and with the result obtained from the use of Cluster Analysis Artificial Neural Networks on fraud detection has shown by clustering attributes neuronal inputs can be reduced[2]. The results can be obtained by using normalized data and data should be MLP trained. The research was based on unsupervised learning. Importance of this paper is to find new methods for fraud detection and to increase the accuracy of results. The data set is based on real time transactional data by a huge European company and personal details in a data is kept confidential[1]. Accuracy of an algorithm is around 50%. This algorithm used to reduce the cost measure and result can be obtained 23% and this algorithm used find a Bayes minimum risk. In this existing system we implement machine learning algorithm is used to predict the fraudulent or non-fraudulent cases. KNN algorithm is the one of the classification algorithm. Taking the different data of credit card from the large data value we have chosen one data for reference and calculate the distances between the reference and each point by using eclidiance distance. Eclidiance distance is used to calculate the minimum distance.
IV. PROPOSED SYSTEM
We are applying random forest algorithm for classify the credit card dataset. Random forest builds multiple decision trees and merges them together to get a more accurate and stable prediction[8]. Random Forest is an algorithm for classification and regression. It is a collection of decision tree classifiers. Random
Rather than searching for the most important feature while splitting a node, it searches for the best feature among a random subset of features. This results in a wide diversity that results in a better model. Random forest has precedence over decision tree as it corrects the habit of over fitting to their training set. A subset of the training set is sampled randomly so that to train each single tree and then a decision tree is built, each node then splits on a feature selected from a random subset of the full feature set. Even for large data sets with many features and data instances training is extremely fast in random forest and because each tree is trained independently of the others. By using Random Forest algorithm the generalization error and over fitting were achieved.
In classification this is the mode (or most common) class value. Its purpose is to used database in which the data points are separated into several classes to predict the classification of a new sample point . Classification steps
1) Training phase: a model is constructed from the training instances. classification algorithm finds relationships between predictors and targets. 2) Testing phase: test the model on a test sample
whose class labels are known but not used for training the model.
3) Usage phase: use the model for classification on new data whose class labels are unknown
V. DATASET
been transformed with PCA are time and amount. The Feature Time restrains the hours advance between initial transaction and the each and every transaction in the dataset. The feature amount is the transaction where the example- dependent cost-sensitive learning is used for this feature. Feature Class is the response variable and it takes value 1 in case of fraud and 0 otherwise. Different pre processing technique are in machine learning, standard scalar is used here[9]. The Standard Scaler undertake your data is normally distributed within each and every feature and will scale them such that the distribution is now centered around 0, with a standard deviation of 1.The mean and standard deviation are intended for the feature and those the feature is scaled based on: xi– mean(x)/st dev(x).
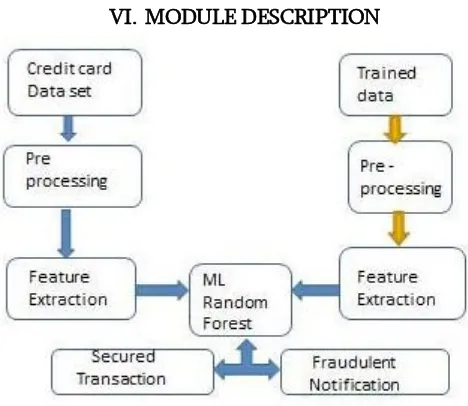
VI. MODULE DESCRIPTION
Fig. 2. Basic block diagram
1. Pre-Processing
Data preprocessing is a technique that is used to convert the raw data into a clean data set, which mainly include data cleaning, integration, transformation and reduction, and obtains training sample data needed. Pre- processing refers to the transformation applied to our data before feeding it to the algorithm. Steps in Data Preprocessing are Import libraries, Read data, Checking for missing values,
Encoding categorical data, Standardize the data, PCA transformation and Data splitting[S].
a. Import libraries: A library is a collection of modules that can be called and used. A lot of the things in the programming world do not need to be written specific and at any time they are required. There are functions for them, which can simply be invoked.
b. Read data: Locate the directory of the CSV file and it is more efficient to keep the dataset in the same directory as your program can 5 read it by using a method called read_csv which can be found in the library called pandas. After inspecting the dataset create a matrix of features (X) and a dependent vector (Y) with the respective observations.
c. Checking for missing values: Periodically some data may be missing in the dataset. The most common idea to handle the problem is to find the mean value for each column and replace it in the missing value.
d. Encoding categorical data: The qualitative form of the data should be categorized, that is data will be in texts form. And it is much complicated for machines to understand texts rather than numbers, whereas the models are based on mathematical equations and calculations.
data set consists of many variables correlated with each other.
g. Data splitting: The dataset should be splitted into two sets of data, one set of data is training data and other is tested data. Training set are trained by machine learning models, to find the correlation coefficient and prediction analysis. Both the training set and tested set are divided into four sets. They are, X_train, X_test, y_train, y_test = train_test_split(X,y, test_size = 0.3, random_state=0)[8].
2. Feature Extraction
Feature selection include reducing the computational costs, saving storage space, facilitating model selection procedures for accurate prediction[8], and interpreting complex dependencies between variables .The features that are well selected not only optimize the classification accuracy but also reduce the number of required data for achieving an optimum level of performance of the learning process .
a. Filter methods : It is used as a processing steps for wrapper Methods.
b. Wrapper methods: Subset of features are used and train a model using them. Based on the inference that we draw from the previous model, and decide to add or remove features from the subset.
● Forward Selection: Forward selection is an iterative method, starts with having no feature in the model. In each iteration, keep adding the feature which improves the model till an addition of a new variable does not improve the performance of the model.
● Backward Elimination: Backward elimination, starts with all the features and eliminates the least significant feature at each iteration which improves the performance of the model. Repeat this until no changes is observed on removal of features.
● Recursive Feature elimination: It is used to find the best performing feature subset. It repeatedly creates models and keeps aside the best or the worst performing feature at each iteration.
3. Trained Data
Creating a trained dataset that will allow the algorithm to pick up the specific characteristics that make a transaction more or less likely to be fraudulent. utilize random under- sampling to create a trained dataset with a balanced class distribution that will force the algorithms to detect fraudulent transactions to achieve high performance. To create balanced trained data set[9].
4. Secured Transaction
In secured transaction, we analyzed both normal and fraud transaction[3].
Fig.2. Fraud x Normal Transaction by Hours
VII.CONCLUSION
Random forest attain good results on small data set. The data are balanced by using smote technique where the data set was divided into two separate data sets – the training data set and the testing data set. The training data set was used to train the normal behaviour of the user, whereas the testing data set was used to verify the accuracy and also the effectiveness of the trained data[7]. The accuracy level compared to other algorithm it gives more. One aim of this study is to identify the user model that Computer Science and Information Technologies, vol 6 (2), 2016
[2]. “Cost sensitive Modeling of Credit Card Fraud Using Neural Network strategy”, ICSPIS 2016, 14-15 Dec 2018, Amirkabir University of Technology Tehran, Iran.
[3]. Analysis on Credit Card Fraud Detection Methods”International Journal of Computer Trends and Technology (IJCTT) – volume 8 number 1– Feb 2017 Nterchange-newline" [4]. Accenture Security (2017) Cost of cyber crime
study. https://www.accenture.com/us-en/insight-cost-of-cybercrime-2017. Accessed 5 Jan 2018 Aha D, Kibler D (1991) Instance-based learning algorithms. Mach Learn 6:37–66 Al-Jarrah OY, Yoo PD, Muhaidat S, Karagiannidis GK Taha (2015) Efficient machine learning for
big data: A review. Big DataRes2(3):87–93. https://doi.org/10.1016/j.bdr.2015.04.001
[5].Almukaynizi M, Nunes E, Dharaiya K, Senguttuva(2017) Proactive identification of exploits in the wild through vulnerability mentions online. In: Proceedings of the 2017 International Conference on Cyber Conflict (CyCon U.S.) pp 82–88
[6].Babko-Malaya O, Cathey R, Hinton S, Maimon D, Gladkova T (2017) Detection of hacking behaviors and communication patterns on social media. In: Proceedings of the 2017 IEEE International Conference on Big Data.pp 4636– 4641
[7].Baumeister RF, Vohs KD, DeWall CN, Zhang L (2007) How emotion shapes behavior: Feedback, anticipation, and reflection, rather than direc tcausation. Personal Soc Psychol Rev 11(2):167–203 Bilge L, Han Y, Dell’Amico M (2017) Riskteller: Predicting the risk of cyber incidents. In: Proceedings of the 2017 ACM SIGSAC Conference on Computer and Communications Security (CCS). ACM, New
York.pp 1299– 1311.
https://doi.org/10.1145/3133956.3134022 [8]. Branco P, Torgo L, Ribeiro RP (2015) A survey
of predictive modelling under imbalanced
distributions. CoRR
abs/1505.01658.http://arxiv.org/abs/1505.01658, 1505.01658
[9]. Chawla NV, Bowyer KW, Hall LO, Kegelmeyer WP (2002) Smote: Synthetic minority over-sampling technique. J Artif Intell Res 16(1):321–357 Cooper GF, Herskovits E (1992) A bayesian method for the induction of probabilistic networks from data. Mach Learn 9(4):309–347 \
[10]. ayal B, MacGregor JF (1997) Recursive exponentially weighted PLS and its applications to adaptive control and prediction. J Process Control.