CSEIT1722238 | Received : 01 April 2017 | Accepted : 12 April 2017 | March-April-2017 [(2)2: 766-770]
International Journal of Scientific Research in Computer Science, Engineering and Information Technology © 2017 IJSRCSEIT | Volume 2 | Issue 2 | ISSN : 2456-3307
766
UAV based precision agriculture using HIPI
Chemwotie Kipkurui Brian
Department of Computing, Jomo Kenyatta University of Agriculture and Technology, Nairobi, Kenya
ABSTRACT
Over a number of years, there has been great movement towards mechanizing agriculture. This has not left out the use of unmanned aircraft Vehicles (UAVs). There has been models created to identify and suggest applicable solutions on the problems identified using the models based on UAVs. Over time, the need for real time identification of problems and their respective solutions has risen. This paper looks into the use of Hadoop Image Processing Interface (HIPI) in development of a model that can be used to provide real time solutions to the farmer based on the images gathered by the UAV on the agricultural fields. HIPI was developed to simplify the parallelization of image processing using Hadoop MapReduce framework.
Keywords: UAV, HIPI, Image
I.
INTRODUCTION
The unceasingly growing need for increasing the food production and decrease the degradation of diseases, water supplies, chemical effects and deficiencies, has brought about the development of several precision agriculture systems over the past decade so as to meet the needs of modern societies [1]. The techniques of field surveillance employed currently are either done manually or with the use of satellite imaging or UAVs. These techniques offer sporadic and expensive information to the farmers about the condition of their farms.
Unmanned aircraft Vehicles (UAVs) are seen as potential platforms for remote sensing over agricultural fields because smaller pixel sizes may be obtained by flying at lower altitudes [2, 3].
Furthermore, UAV flights could be scheduled for key periods of vegetative growth while avoiding cloudy conditions [4, 5]. The use of UAVs to carry out the task of monitoring the state of the farm can be beneficial to many reasons, including high spatial resolution and quick turnaround times, which has been used to monitor crop growth [6,7],surveillance of a large area within a short time, feeding the farmer with the necessary farm information in real time. UAVs were
initially used for chemical spraying while they were the solution to visibility problems due to cloudy weather or inaccessibility to a field of tall crops, like maize [8]. They also have the strong advantage compared to satellite and airborne sensors of high image resolution [9].
The existing models based on UAVs depend on a single system to process farm data. This might be a disadvantage if used in large agricultural fields. We are proposing a model that makes use of HIPI in parallelizing image processing so as to speed up the whole operation. The main intention of this is to feed the farmer with the necessary information in real time through an application residing in the farmers phone. The UAVs are responsible for taking images from the agricultural fields and transmitting them to the server where they will be processed using the HIPI based framework. HIPI aims at creating an interface for computer vision with MapReduce technology [10]. HIPI provides a platform that contains relevant framework that is applicable to all image processing and computer vision applications.
soil moisture content, etc. None of the research done have used HIPI or MapReduce in its image processing task.
II.
THE MODEL
Our model heavily relies on the collection of thermal, NIR and visible images. High resolution visible images and thermal are collected using the UAV at a low altitude of approximately 15m. The UAV should be automated with waypoints provided beforehand. The cameras (thermal and visual) should be set to take the images at a frequency given by the equation below:
Where I is the number of images, s is the speed (meters/sec) of the UAV and a is the area that is preset to be covered by the UAV.
The images captured should contain the GPS coordinates to facilitate the tracking. The server is responsible for image enhancement and processing. The following steps implements the proposed model:
1. Loop_start 2. Image Capture 3. Image transmission
4. Image reception and bundling 5. HIPI processing
6. Sending output to the farmer 7. End loop
The images from the UAV are sent to the server in batches. The batches are formed based on the time taken. The images sent under one batch are bundled together at the bundling stage. The HIPI processing is then implemented with the guidance of the diagram in fig 2.
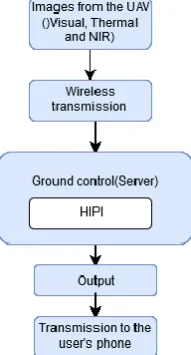
Figure 1. The work flow diagram from the image capture using the UAVs to the point of delivering the processed information in the user’s phone.
The image bundle is first loaded into the system. The culling process is filtering of images based on whether it contains the GPS coordinates or not.
Figure 2. HIPI Framework
The culling process filters out the images acquired during turns and outside the region of interest, as well as images with excessive roll. The images that pass the culling stage are converted to float images, to facilitate the access of pixel information. The images are then distributed to the various maps. It is at the mapping stage where new (RGB and fused) images are created based on the original image.
A. Image Enhancement
RGB Image Conversion
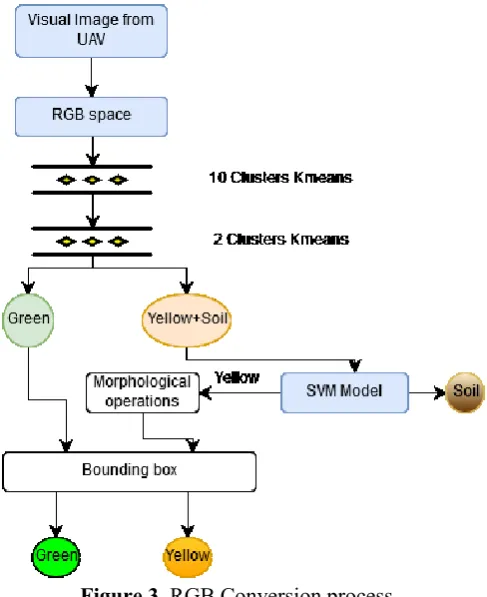
pixels (associated with potential diseases), and the last of pixels that correspond to the soil. This model aims at segmenting only the green pixels of the image by employing a hierarchical K-means algorithm [12].
Two steps are implemented in each color space starting with the 10 class clustering. This is responsible in breaking down the images into groups of pixels with similar colors. The second step, 2 class clustering, separates the green clusters from the yellow and soil clusters.
After the clustering stage, the model then circles the pixels that represent the soil and another circle on yellow pixels representing leaves with diseases. An SVM classification model with a linear kernel is trained based on these selections and is used for the classification between soil and other non-green colors in the rest of the images [11]. The morphological operations are then done to smoothen. The bounding box are assigned to the two color spaces in order to highlight informative candidate regions.
Fused Images
In the selection of fusion techniques, we propose the use of optimized image fusion in DWT over simple averaging in DWT. A simple averaging in DWT technique works by performing simple averaging in the wavelet transform domain, which is applied at every pixel for all sub-bands using the following equation
Fused image=0.5*thermal + 0.5*visual.
The main challenge in this technique is its blurring effect. The optimized image fusion in DWT solves this by utilizing the weighted average approach. Thermal images are brighter than the visual images. Weights are assigned according to the equation below:
Fused image=0.3*thermal + 0.7*visual. [13]
B. Processing
Still within the mappers, after the new images have been created, the image identification algorithms will be applied on the newly created images. The tasks that the mappers need to accomplish are to check on:
Vegetation indices
To assess the crown Leaf Area Index (cLAI) over the farm field, Normalized Difference Vegetation Index (NDVI) [14] is calculated. Using the cLAI obtained, the farm field is then mapped over the thermal image obtained resulting in cLAI estimation for each individual crop. The expected output is similar to the one in fig 4.
Figure 3. RGB Conversion process
Figure 4. Image showing vegetation indexes
The Photochemical Reflectance Index (PRI) [15] should be calculated to detect water stress in the crops. Water stress levels should be quantified by comparing the image-derived PRI and the simulated non-stress PRI (sPRI) obtained through radiative transfer. The resulting diagram is similar to the one in fig 5.
Figure 5. Image showing water stress levels in areas with different irrigation treatments
Diseases and Nitrogen identification
When crop diseases and pests occur, the chlorophyll level will appear different degrees of decline. The decline is usually expressed as a reflectance decrease in the near-infrared band, which can be detected in the near-infrared remote sensing images. While detecting nitrogen deficiency, the circular regions suggested above (RGB conversion) is being used. Among the selected candidates, the images that exhibit some diseases and N deficiency need to be separated from the rest (e.g. tassels or stressed leaves for which assessment cannot be made). This distinction is based on the “V” shaped deformation that is directly associated with diseases and N deficiency.
A skeletonization algorithm [16], based on the contrast of the yellow and green pixels in the suggested circular regions, is responsible for constructing spatial descriptions of this deformation. The extracted
descriptors are then used to train a classification model, which in turn makes an assessment on the existence of diseases and N deficiencies in the suggested region.
Crop Count
Crop counting makes use of the fused images as discussed above. The process of crop counting follows the following algorithm:
1. Auto-determination of perspective transform parameters
2. Crop straightening using perspective transformation
3. Crop segmentation based on excessive green 4. Gaussian Smoothing
5. Calculation of projection histogram 6. Local maxima detection
7. Crop counting
The reducing stage in the map-reduce is responsible for grouping related information generated from the mapping section. Information related to tasks (vegetation indices, water stress, etc.) are each grouped to their respective groups.
C. Output
The output should be a summary of the observations from the field in question. In addition to that, recommendations should be made based on the output summary.
III.
CONCLUSION
This paper has describe the various image processing steps that can be performed within the HIPI framework to facilitate almost real time response to the farmers. The model discussed serves as a proposed concept for an architecture that brings forth a new implementation technique in the field of monitoring. Today, UAVs are a reality in many agricultural fields. However, precision agriculture is yet to discover further progress and UAVs will be at the center of this.
IV.
REFERENCES
Automation (ICRA) 2016 IEEE International Conference on, pp. 3288-3294, 2016.
[2]. S. Fouché and N. W. Booysen,"Assessment of crop stress conditions using low altitude aerial color-infrared photography and computer image processing, "Geocarto Int., vol. 2, pp. 25–31, 1994.
[3]. Y. Inoue, S. Morinaga, and A. Tomita, "A blimp-based remote sensing system for low ltitude monitoring of plant variables: A preliminary experiment for agricultural and ecological applications," Int. J. Remote Sens. , vol. 21, pp. 379 – 385, 2000.
[4]. E. R. Hunt, Jr., C. S. T. Daughtry, C. L. Walthall, J. E. McMurtrey III, andW.P.Dulaney, " Agricultural remote sensing using radio-controlled model aircraft,"in Digital Imaging and Spectral Techniques: Applications to Precision Agriculture and Crop Physiology, ASA Special Publication 66. Madison, WI, USA: American Society of Agronomy,2003, pp. 197 –205.
[5]. S. R. Herwitz, L. F. Johnson, S. E. Dunagan, R. G. Higgins, D. V. Sullivan, J. Zheng, B. M. Lobitz, J. G. Leung, B. A. Gallmeyer, M. Aoyogi, R. E. Slye, and J. A. Brass, "Imaging from an unmanned aerial vehicle: Agricultural surveillance and decision support,"Comput. Electron. Agric. ,vol. 44, pp. 49–61, 2004 [6]. J. Torres-Sánchez, F. López-Granados, J.M.
Peña, "An automatic object-based method for optimal thresholding in UAV images: Application for vegetation detection in herbaceous crops," Computers and Electronics in Agriculture, 114, 43-52, 2015.
[7]. F.A. Vega, F.C. Ramírez, M.P. Saiz, F.O. Rosúa, "Multitemporal imaging using an unmanned aerial
[8]. vehicle for monitoring a sunflower crop," Biosystems Engineering, 132, 19-27, 2015. [9]. Sugiura, R., Noguchi, N., & Ishii, K. Remote
-sensing technology for vegetation monitoring using an unmanned helicopter. Biosystems Engineering, 90(4), 369-379, 2005
[10]. Jannoura, R., Brinkmann, K., Uteau, D., Bruns, C., & Joergensen, R. G. Monitoring of crop biomass using true colour aerial photographs taken from a remote controlled hexacopter. Biosystems engineering , 129, 341-351, 2015
[11]. Sweeney C, Liu L, Arietta S, Lawrence J. HIPI: a Hadoop image processing interface for image-based mapreduce tasks. Chris. University of Virginia. 2011.
[12]. Zermas, D., Teng, D., Stanitsas, P., Bazakos, M., Kaiser, D., Morellas, V., Mulla, D. & Papanikolopoulos, N. (2015). Automation solutions for the evaluation of plant health in corn fields.. IROS (p./pp. 6521-6527), : IEEE. ISBN: 978-1-4799-9994-1
[13]. A. K. Jain, M. N. Murty, and P. J. Flynn, "Data clustering: A review," ACM Comput. Surv., vol. 31, no. 3, pp. 264–323, Sep. 1999. [Online]. Available:
http://doi.acm.org/10.1145/331499.331504 [14]. Hanif, M., & Ali, U. (2006, July). Optimized
visual and thermal image fusion for efficient face recognition. In 2006 9th International Conference on Information Fusion (pp. 1-6). IEEE.
[15]. Rouse JW, Haas RH, Schell JA, Deering DW, Harlan JC (1974) Monitoring the vernal advancements and retrogradation of natural vegetation. In: MD UG, editor. NASA/GSFS final report. p. 371.
[16]. Gamon, J.; Penuelas, J.; Field, C. (1992) A narrow-waveband spectral index that tracks diurnal changes in potosynthetic efficiency. Remote Sensing of Environment, 41, 35-44. [17]. R. Telea and J. J. V. Wijk, "An augmented fast