Global gene expression analysis of developing neocortex
using SAGE
SEONG-SENG TAN*, JENNY GUNNERSEN and CHRISTOPHER JOB
Brain Development Laboratory, Howard Florey Institute, University of Melbourne, Victoria, Australia
ABSTRACT The mammalian brain is estimated to contain about a hundred billion neurons, making it the most complex biological structure on earth. Trying to understand the assembly and function of this elaborate organ is a formidable task. Yet the information to build a brain is encoded by no more than a subset of the 80,000 genes present in the genome, a more manageable number. This review describes the use of SAGE technology (Serial Analysis of Gene Expression) to decode the genetic repertoire of genes that are differentially expressed in time and in space during develop-ment of the neocortex, the part of the mammalian brain responsible for complex traits. We demonstrate that SAGE is not only powerful for generating comprehensive molecular portraits from the developing cortex but can also assist in discovering new genes.
KEY WORDS:
SAGE, differential gene expression, neocortex
0214-6282/2002/$25.00
© UBC Press Printed in Spain www.ijdb.ehu.es
*Address correspondence to: Dr. Seong-Seng Tan. Brain Development Laboratory, Howard Florey Institute, University of Melbourne, Royal Parade, Parkville, 3010, Victoria, Australia. Fax: +61-3-9348-1707. e-mail:[email protected]
Abbreviations used in this paper: SAGE, Serial analysis of gene expression.
Introduction
Current approaches to studying molecular control of cortical development are characterized by the traditional gene by gene approach. While this has provided occasional and tantalizing glimpses of key developmental processes, the nature of the prob-lem demands a global rather than a gene by gene approach. So whats special about the developing cortex? The cortex is as-sembled from neurons with unusually complicated life histories, viz (1) long-distance contemporaneous migration from two separate germinal zones into specific layers in a stage-dependent fashion, (2) interactions with radial glial scaffold, other migrating neurons and the surrounding extracellular matrix, (3) reciprocal innervation with specific subcortical targets such as the thalamus and spinal cord, and (4) juggling of the above with a cell’s differentiation program emanating from its lineage. In this context, a full under-standing of cortical development is unlikely to advance without consideration of the multiple gene sets that are activated in re-sponse to each of the above morphogenetic events.
Global studies of gene expression are designed to meet this need by determining which genes are expressed and quantify the levels of expression. These molecular profiles provide “snapshots” of functional capabilities of cells and tissues under question; in addition, they also yield insights into the phenotypic differences between cortical tissues that differ spatially or temporally. Ideally, gene profiling outputs should meet two important goals. First, the output would provide a molecular inventory of genes that are
expressed in developing cortical tissue in defined space and time. Data containing information on sequence abundance and com-plexity can then be analysed for higher order correlations using appropriately designed algorithms. Second, it should detect and quantify the expression of both known and unknown genes. The latter includes genes that have been neither cloned nor se-quenced. Although microarrays and oligonucleotide chips are well suited for quantifying the expression of known genes, only open-platform technologies such as SAGE are able to interrogate cells and tissues for both known and unknown genes.
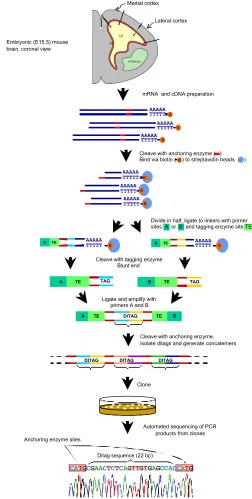
In this review, we outline the use of SAGE to profile genes that are expressed in different regions of the developing neocortex, and during different stages of neocortical development. The unit of SAGE output is a “tag” consisting of a short (10 bp) cDNA sequence. Each tag represents a bar-code for an expressed gene in the mRNA pool. SAGE works by two principles (Velculescu et al., 1995). First, a short tag of about 10 bp of random nucleotide sequence contains sufficient information to distinguish between 1,048,576 transcripts (410) provided the tag is taken from a
the developing cortex, viz neuronal phenotype, layer identity, and area specification. A major focus of current research is to address the question - what is responsible for partitioning the cortex into different tangential domains (area maps)? One view suggests that area identity is determined by interactions between the genetic endowment of the cells and specific environmental influences. No doubt, environmental influences (eg. thalamocortical afferents, (O’Leary et al., 1994)) play key roles in determining area-specific features, but these are notoriously difficult to assay on an objective level. On the other hand, the expression of locale-specific genes provide the opportunity for molecular assays of regional identity.
The notion that functional and architectural specializations of the cortex are correlative of gene activity can be illustrated by the barrelfield example. In rodents, an area of the somatosensory cortex (SI) is devoted to processing sensory information from the vibrissae of the face through a series of intermediate relays (Woolsey and Van Der Loos, 1970). The cytoarchitecture of this part of the cortex is marked by discrete aggregates of neurons in layer 4 termed “barrels”. Each barrel is innervated by clusters of ventrobasal thalamic afferents, arranged in a pattern that mirrors the whisker field on the rodent’s snout (Woolsey and Van Der Loos, 1970). There is evidence that thalamic afferents to the cortex carry a blueprint of the vibrissae pattern, prior to the overt appearance of the barrels (Erzurumlu and Jhaveri, 1990). In addition, molecular correlates (e.g. proteoglycans, peanut lectin-binding proteins) of barrel field architecture are transiently present in SI before or during barrelfield differentiation (Cooper and Steindler, 1986; Crossin et al., 1989; Steindler et al., 1989), providing a compelling demonstration of gene activity in an area-specific manner (Cohen-Tannoudji et al., 1994).
Area-Specific Features in the Developing Cortex
What sort of evidence is available during embryonic stages to suggest the emergence of asymmetry in an otherwise uniform cerebral wall? Axon tracing experiments using DiI have revealed early regionalization of certain cortical regions that are wired to the thalamus. Among the earliest axons to emerge are those from the subplate, a transitory structure beneath the cortical plate. Even before corticogenesis is half-complete, subplate axons appear to traverse the internal capsule and invade specific regions of the thalamus (McConnell et al., 1989). Reciprocal connections from the thalamus to specific cortical areas suggest the presence of area-sensitive guidance cues for circuit formation (Barbe and Levitt, 1992; Ghosh and Shatz, 1993). Thus, area pools (He et al., 1998; de Waard et al., 1999; Gunnersen et al.,
2000, Augustine et al., 2001).
Overview of Neocortical Organisation
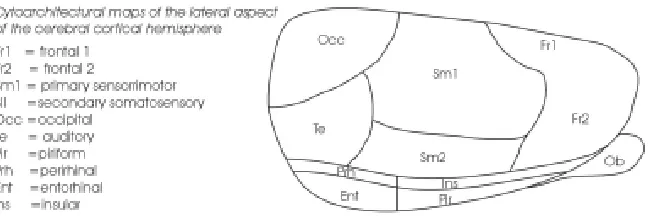
Mature neurons of the mammalian neocortex originate from dividing neuroepithelial cells that are situated at some distance away and are morphologically indistinguishable from each other (Bayer and Altman, 1991). Yet from this simple sheet of neuroepi-thelium, a complex structure, unique only to mammals, is as-sembled. To appreciate the developmental agenda, it is worth considering the organisation of this evolutionarily-selected organ. Parallel to the pial surface, the neocortex is divided into distinct areas serving different functional modalities such as visual, audi-tory, somatosensory and motor responses (Fig. 1). Although there are variations in complexity between different mammalian spe-cies, there is great consistency across and within species in the functional specialization of anatomically distinct areas. For in-stance, the map of areas from one individual to another is almost identical; areas devoted to vision are posterior in the cortex, whereas areas concerned with body movements are anterior.
Functional and Areal Specification of Cortex
From the beginning of this century, early investigators such as Brodmann have used comparative studies to propose that the cortex is composed of a patchwork of “cortical areas”, each with a specific and unique set of functions (Brodmann, 1909). Almost a century later, this view continues to form the backbone of neocor-tical research. While functional uniqueness of each corneocor-tical area (e.g. motor, visual, auditory) is generally accepted and under-stood, much less is known about the structural and genetic uniqueness of each area. Beyond the fact that neurons in each area may be wired to subcortical targets, and that they may exhibit local variations in cell density (e.g. visual cortex) or architectonic feature (e.g. barrel-field), it is generally accepted that neurons from different cortical areas possess common characteristics. Examples include (1) constant neuronal number per given volume of cortical tissue (Rockel et al., 1980), (2) constant quanta of neurons emanating from their progenitors (Tan et al., 1998) and (3) common intrinsic cellular microcircuitry (Sur et al., 1988; Metin and Frost, 1989).
A fundamental question is: what determines structural unique-ness during development? Starting from a uniform sheet of neu-roepithelial cells, at least three kinds of diversity are generated in
specification in the cortex needs to be consid-ered over at least three stage-related levels: (1) acquisition of area identity before the subplate is formed, (2) specific recognition of subplate axons for thalamic targets, and (3) recognition of thalamic axons for specific cor-tical targets.
There are other examples of developmen-tal asymmetry. The pattern of neurogenesis is not uniform, with gradual rostral to caudal, and lateral to medial gradients (Berry and Rogers, 1965). There appear to be pockets of the germinal zone where neurons are born earlier than their brethren in surrounding
eas (eg. piriform cortex compared with adjacent ante-rior and posteante-rior cortical regions, (Bayer, 1990)). In both rodents and in primates, certain cortical areas appear to have higher cell production rates, particu-larly in the visual cortex (Dehay et al., 1993; Polleux et al., 1997). Finally, work in our laboratory has shown that the migration of neurons to the cortical plate is not uniform along the medio-lateral axis: dispersion pat-terns in the medial cortex are predominantly radial whereas lateral cortex displays a greater incidence of tangential dispersion (Tan et al., 1995).
Molecular Markers of Regional Identity
This area of rich controversy continues to baffle those who look for molecules that specify cortical area maps. Unlike in the hindbrain or spinal cord, molecules
suggesting that gene expression is segregated along medio-lateral lines, rather than the evolutionarily older limbic versus the more modern neocortex. Indeed, the pyramidal layer of the hippocampus (archicortex) exhibits expression of the reporter (Fig. 3D) as does the floor plate (Fig. 3B).
Efforts to clone the “trapped” gene have so far proved elusive. Nevertheless, the R197 mouse line provides a “proof of principle” demonstration of genetic specification of medial versus lateral regions long before the commencement of neurogenesis. Sup-porting this are recent experiments where Emx2 and Pax6 -/- mice show defects in regionalization across the caudal-lateral to ros-tral-medial axis of the forebrain (Bishop et al., 2000). Both these homeobox transcription factors are expressed in gradients along with Pax6 having maximal expression at the rostral-medial pole and Emx2 at the caudal-lateral pole. In Emx2 -/- animals markers for anterior neocortex such as Cadherin 6 expand their zone of expression into the posterior region of the neocortex whereas in Pax6 -/- animals this expression contracts anteriorly. Cadherin 8 whose expression marks both the lateral somatosensory cortex and auditory cortex extends its expression medially in Pax6 -/-animals. These shifts cause anatomical changes as injection of DiI into the occipital neocortex will normally label the lateral geniculate nucleus but in Emx2 -/- animals, these projections connect with the ventroposterior nucleus whose afferents nor-mally extend only so far as the somatosensory cortex. Both these results suggest that these factors purvey anterior (Pax6) or posterior (Emx2) character to the early neocortex by regulating position-dependent expression of downstream genes within the neocortex.
that overtly presage or even accompany the appearance of a defined functional or cytoarchitectonic area of cortex are either non-existent or rarely seen. Instead, the vast majority of reported molecules that are shown to possess asymmetric distribution in the cortex appear to have broad expression patterns, overlapping multiple functional and anatomical domains (Fig. 2). This phenom-enon, although disappointing for those looking for tight matching between specific gene expression and area identity, is not entirely surprising. The cortex is the product of at least 200 million years of evolution during which differential selection pressures have been brought to bear, in different animals over different eras (Northcutt and Kaas, 1995; Finlay and Darlington, 1995). Rather than a collection of smoothly integrated modules, the cortex is considered by some to be a mosaic of disparate areas, assembled in random fashion by opportunistic phylogenetic processes.
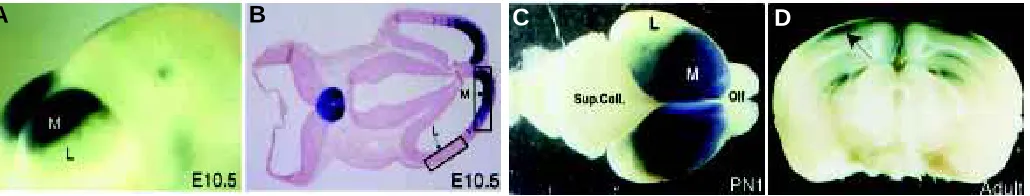
A number of markers with overt asymmetric expression in the developing cortex deserve comment (Fig. 2). The R197 line was created by as part of an enhancer-trap experiment (Tan, 1991). Of all the markers under discussion, R197 exhibits the earliest genetic specification of a cortical region. As early as E 10.5, the lacZ reporter gene is expressed in medial but not lateral cerebral neuroepithelium (Fig. 3A). Although the identity of the “trapped” gene remains unknown, the strong and clear cut expression of the reporter in the ventricular zone of the cingulate and medial, but not lateral cortex at E10.5 suggests intrinsic neuroepithelial prepatterning (Fig. 3B). This medial versus lateral asymmetry persists throughout the entire period of corticogenesis into post-natal (Fig. 3C) and adult stages (Fig. 3D). There is no expression of the reporter in either lateral neocortex, or in lateral limbic cortex,
Fig. 2. Region-specific and overlapping domains of gene expression in the adult rodent cortex.
Fig. 3. Expression of the lacZ transgene in developing and adult R197 mouse cortex. (A,B) At E10.5, expression is restricted to the medial but not lateral domain of the cerebral wall. Expression is also seen in the floor plate. Boxed outlines in (B) represent tissue areas that may be used to generate region-specific SAGE libraries. (C) At postnatal day 1 (PN1), lacZ expression is clearly segregated in the medial (M) cortex, and absent in the lateral (L) territory. (D) In adult cortex, lacZ expression is restricted to layers 2/3 of medial (arrow) and cingulate cortex. There is also expression in part of the CA1 and dentate gyrus of the hippocampus. Olf, olfactory bulb; Sup. Coll, superior colliculus.
It is unclear what the direct downstream targets of Emx2 and Pax6 are but Table 1 lists known examples of molecular asymme-try in the developing cortex, in spatial and temporal terms. Of special relevance is the work by Levitt and colleagues (Barbe and Levitt, 1991) (Levitt et al., 1997). They showed that neurons from an older part of the cortex are committed to express LAMP (limbic-associated membrane protein) very early in development; this protein continues to be expressed even when pieces of limbic cortex are exchanged with sensorimotor neocortex (Barbe and Levitt, 1991). It has also been shown that explants of mouse somatosensory cortex, marked by a lacZ transgene, retained their gene expression pattern even after transplantation into other areas of the brain, including the cerebellum (Cohen-Tannoudji et al., 1994). The monoclonal antibody PC3.1 recognises a 29 kDa protein expressed specifically in neurons of parietal cortex and when VZ cells are isolated three weeks before the onset of PC3.1 expression, they develop immunoreactivity corresponding to the cortical source (Arimatsu et al., 1992).Otx1 and Otx2, two mam-malian homologues of the Drosophila homeobox gene Orthodenticle, are expressed early in a “nested” pattern within the developing forebrain and later are exclusively found in layer 5 and 6 neurons (Simeone et al., 1992; Frantz et al., 1994a). Another POU-specific homeodomain gene, SCIP is found early in the preplate, subventricular zone, and among migrating layer 5 neu-rons only (Frantz et al., 1994b).
As mentioned, several cadherins have expression patterns that overlap particular neocortical regions (Nakagawa et al., 1999). Cadherins are cell-cell adhesion molecules which interact with one another homophilically and have been shown to regulate synapse formation, suggesting that they may control the extent of local connections within region or regulate their connectivity to subcor-tical targets which express cadherins of the same sort (Fannon and
Colman, 1996; Nakagawa et al., 1999). The Ephrin family of cell-surface signalling molecules have also been found to have asym-metric distribution within the neocortex. Of much interest is Ephrin A5 which has graded expression across the somatosensory cortex (Vanderhaegen et al., 2000). The barrel field is distorted in Ephrin A5 -/- animals with individual whisker receptive fields being changed both in area and the extent to which they overlap with surrounding whisker representations (Vanderhaeghen et al.,2000; Prakash et al., 2000). More dramatically, introducing an additional source of FGF8 produced a duplication of the somatosensory barrel fields (Fukuchi-Shimogori and Grove, 2001). These results represent the first functional evidence that genes are capable of defining the boundaries for specific sensory representation and their topography.
Stage-Specific Programs of Gene Expression
Proper brain function requires proper assembly of neurons and establishment of circuitry. These two processes occur during two critical epochs of brain development, before and after birth. Before birth, neurons are generated in large numbers in germinal zones from where they migrate to their proper positions. After birth, these neurons mature by connecting to distant targets and to other neurons. Defective generation of neurons in sufficient numbers, or impediments to neuron migration to proper destinations are certain recipes for neurological disorders, including epilepsy and mental retardation. Similarly, failure to establish proper neuronal arboriza-tion during the early postnatal period can lead to funcarboriza-tional neuro-logical disorders later on in life. We review here why we have selected developing cortices from embryonic day 15 and postnatal day 1 for systematic comparisons of expressed genes.
At embryonic day 15, the timepoint at which neocortical neurogenesis is midway to completion in the mouse, the peak period of exponential increase of neuronal progenitor cells in the ventricular zone (VZ) has passed (Takahashi et al., 1996). At this stage, about half of the cellular constituents in the ventricular epithelium are made up of post-mitotic, migratory neurons which will eventually settle and further mature to form the cortical plate (CP). Specifically, cells destined to form layer IV, otherwise known as the granular cell layer, are born (Bayer and Altman, 1991). This layer is of special functional importance as a subset of these cells, the spiny stellates, are the primary receivers of thalamic afferent input and hence are intimately involved in areal regionalization of the neocortex.
This association is further strengthened by observations that the cells of layer IV are directly coupled to those of the subplate (Ghosh, 1995b). The subplate is composed of a transitory cell population which appears to be crucial in guiding mature connec-tions between the neocortex and the thalamus. Pioneer projecconnec-tions from the subplate to the internal capsule (IC) may act as a temporary scaffold for thalamocortical afferents (TAs) and cortico-thalamic efferents (Allendoerfer and Shatz, 1994) (Molnar et al., 1998). The interaction between layer IV and subplate cells may be necessary for this targeting.
By embryonic day 15, TAs have reached the subplate but they then ‘mark time’ forming temporary contacts with cells in the subplate prior to their invasion of the CP. Speculatively, these axons form short-lived circuits with subplate neurons so that they might target their point of ingress into the CP by actively querying
TABLE 1
SPATIAL AND TEMPORAL MOLECULAR ASYMMETRY IN DEVELOPING CORTEX (adapted from Levitt et al., 1997)
Marker Spatial distribution Temporal distribution References
LAMP Limbic cortex E14 (rat) to adult;
fated by E12 (Ferri and Levitt, 1993) Otx-1 Layers V/VI – anterior E13 (rat) to adult (Frantz et al., 1994a)
neocortex
Latexin Layers V/VI – lateral P6 (rat) to adult; (Arimatsu et al., 1992) isocortex fated by E12
Transgene Layer IV – somatosensory P2 (mouse) to adult; Cohen-Tannoudji et al., 1994) (H-2Z1 mouse) cortex fated by E14
Transgene Layers II/III – cingulate (Tan, 1991) (R197 mouse) and medial neocortex E10.5 (mouse) to adult
SCIP Layer V - neocortex E13 (rat) to adult (Frantz et al., 1994b) Cadherin 6 Somatosensory, Auditory, P0 (mouse) to adult Suzuki et al., 1997 Cadherin 8 Frontal P0 (mouse) to adult Suzuki et al., 1997 Ephrin-A5 Motor, Primary From P19 (rat) Vanderhaeghen et al., 2000
Somatosensory,
Auditory, Gradient of From P0 (mouse) expression in secondary
Somatosensory
Ephrin-A7 Caudal Sensory cortex, Miyashita-Lin et al., 1999 Motor
Emx-2 Gradient of expression From E8.5 (mouse) Simeone et al., 1992; with caudo-lateral> through embryogenesis Boncinelli et al., 1995; rostro-medial within VZ. Bishop et al., 2000 Pax-6 Gradient of expression From E8.5 (mouse)
the underlying subplate. This is corroborated from in vitro co-culture experiments indicating that accurate pathfinding between thalamus and cortex is not dependent upon diffusible factors (Molnar and Blakemore, 1991). More pertinently, inhibition of action potentials in embryonic feline TAs in vivo results in guidance failure (Catalano and Shatz, 1998). Analogous experiments in which subplate neuronal activity was inhibited, resulted in non-characteristic terminal branching of TAs in layer IV (Herrmann and Shatz, 1995).
These results do not mean that molecular addressing is unnec-essary in the cortex but rather such address molecules are likely to be cell-cell adhesion or signalling proteins necessary for stimulat-ing or inhibitstimulat-ing synapse formation between thalamic axons and target or non-target tissues. This is supported by experiments where explants of specific thalamic nuclei whose axons, in vivo, are destined for a particular cortical region will, in vitro, show improved outgrowth on target compared to non-target cortical membrane preparations (Bolz and Gotz, 1992). It follows that if such ‘access’ molecules do indeed exist then the crucial time for their expression, and hence for our identification of them, will be when TA axons are interfacing with the subplate, i.e., at around embryonic day in the mouse.
In contrast neurogenesis has all but finished by postnatal day 1 in the mouse with only a few cells still migrating to the upper layers of the CP (Bayer and Altman, 1991). Additionally, thalamocortical afferents ‘waiting’ in the underlying subplate invade the CP and begin to form functional synapses with layer IV neurons (O’Leary et al., 1994). Therefore the fundamental processes of neurogenesis, long-distance migration and axonal pathfinding have essentially been completed. By this time it is less likely that molecules specifying the positional aspects necessary for regionalization will still be required. Molecules reflecting regional differences in synap-tic plassynap-ticity, neurotransmission and those that stabilise expression of these proteins will be more likely to be identified at this time.
The Technology
As mentioned, any attempt to understand developmental pat-terning and regionalization of the mammalian cortex would benefit from a global, rather than an individual gene, approach to obtain complete gene expression profiles of functional regions at different stages of development. In the adult mouse brain, about 12,000 genes are expressed (Hastie and Bishop, 1976), reflecting the complexity of cell types in this organ. What would be useful is a systematic quantitative analysis with the power to catalog not only the known genes expressed but also to discover new genes, measure the abundance of transcripts, and identify regional differ-ences in expression.
SAGE has been developed specifically to meet such chal-lenges. The technique has been used effectively to characterize the identity and abundance of the entire set of mRNA transcripts expressed from the yeast genome (designated the transcriptome), identifying genes that had not been predicted from sequence information alone (Velculescu et al., 1997). More importantly, phenotypic expression of the significantly more complex human genome has also proved amenable to SAGE analysis. New models for p53-induced apoptosis (Polyak et al., 1997) and the APC pathway (He et al., 1998) in colorectal cancer cell lines have been proposed based on insights gained from SAGE data. Genes shown
to be induced or repressed in human gastrointestinal tumors relative to expression levels in normal tissues represent potential diagnostic or prognostic markers, or even therapeutic targets (Zhang et al., 1997). Use of SAGE as a comparative tool to investigate different physiological or pathological conditions comple-ments the power of the technique to provide a quantitative over-view of gene transcription in a particular tissue or cell type. This feature has been recognized by researchers in the Cancer Ge-nome Anatomy (CGAP) project who are currently using SAGE as part of a large–scale multi-pronged approach to “delineate the molecular fingerprint of the cancer cell” ((Lal et al., 1999); www.ncbi.nlm.nih.gov/ncicgap).
Advantages of SAGE over Other Methods
Of the range of techniques available to assess and compare levels of gene expression, none is as suited to global expression profiling as SAGE. Techniques such as northern blotting (Alwine et al., 1977), RNase protection (Zinn et al., 1983) or reverse transcrip-tion-polymerase chain reaction (RT-PCR; (Veres et al., 1987)) are mainly useful for the study of one, or a small number of, known genes. Differential display (Liang and Pardee, 1992)or cDNA subtraction–based methods (Hedrick et al., 1984)(Diatchenko et al., 1996) utilize hybridization to uncover differential expression of unknown genes on a small to medium scale. These techniques suffer from the inability to provide information on transcript abun-dance.
Large scale expressed sequence tag (EST) sequencing is also an effective approach to gene discovery, however it is laborious due to the length of the clones and a high level of redundancy. More than 1.1 million human EST’s have been found to collapse by UniGene clustering to only approximately 63,000 unique genes (Schuler et al., 1996). In the case of the mouse ESTs, sequencing from the (variable) 5’-end of cDNAs has artificially enhanced the number of clusters, or genes, which currently stands at 15,275 (http://www/ncbi/nlm/nih.gov/UniGene). These clusters contain nearly 270,000 gene and EST sequences, of which approximately 214,000 are derived from 5’-EST reads. Thus it can be seen that the mouse EST deposition rate is lagging far behind that for the human ESTs.
Divide in half, ligate to linkers with primer sites A or B and tagging enzyme site TE
Cleave with anchoring enzyme, isolate ditags and generate concatemers
Automated sequencing of PCR products from clones Clone
DITAG DITAG
DITAG
AAAAA TTTTT
AAAAA TTTTT AAAAA TTTTT
B B
B
AAAAA TTTTT B
AAAAA TTTTT B
Cleave with tagging enzyme Blunt end
A TE TAG B TE TAG
Ligate and amplify with primers A and B
A TE DITAG
Cleave with anchoring enzyme ( ) Bind via biotin ( ) to streptavidin beads ( )B
AAAAA TTTTT B
AAAAA TTTTT B
AAAAA TTTTT B B TE
A TE
TE B
Ditag sequence (22 bp) Anchoring enzyme sites
CATGCGAACTCTCAGTTGTGAGCCACCATG
Lateral cortex Medial cortex
mRNA and cDNA preparation Embryonic (E15.5) mouse
brain, coronal view
Currently, the cost of setting up a facility for production and/or analysis of microarrays is beyond the budget of most laboratories (Bowtell, 1999). The combined cost of an arrayer and scanner currently amounts to between US$100,000 and US$300,000. Hardware aside, the purchase price of the entire available clone sets for microarray production is listed at US$40,000-US$48,000 for a mouse set and US$90,000 for the human set. Alternatively, a single pass over the Affymetrix 30K mouse gene/EST Genechip microarrays could cost up to US$12,000. Without further techno-than 30,000 mouse genes and expressed ESTs due to
redundan-cies. Thus the coverage of the mouse genome, which is estimated to contain between 30,000 and 100,000 genes, is low (Silver, 1995). By way of comparison, Kinzler and coworkers (Zhang et al., 1997) analyzed gastrointestinal SAGE tags for more than 300,000 transcripts derived from about 49,000 human genes, 548 of which were differentially expressed. Low abundance transcripts ex-pressed at less than 5 copies per cell comprised 86% of the total transcripts and 49% of the tags in the low abundance category (with no match in the Genbank database) represent yet to be discovered genes.
Theoretically, SAGE is infinitely sensitive, since the number of tags sequenced can be progressively increased until no new tags are collected. Increasing the number of yeast tags from 40,000 to 50,000 resulted in accumulation of only approximately 300 new genes (Velculescu et al., 1997). After collecting a total of 700,000 human tags from numerous gastrointestinal tissues and cell lines, the rate of new tag accumulation per 50,000 tag increment is essentially zero (V. Velculescu, pers. comm.). In practice, SAGE and cDNA microarray hybridization are quantitative techniques of similar sensitivity (approximately 1/100,000 or several copies per cell; (Hastie and Bishop, 1976; Zhang et al., 1997; Bowtell, 1999; Duggan et al., 1999). SAGE has the advantage, however, of generating quantitative data in the format of transcript copy per cell, or percentage of the total transcript pool. Valid comparisons can be made not only between levels of a particular transcript in different samples but also between levels of different individual transcripts in a single sample. In a library of SAGE tags, two transcripts of equal abundance have an equal probability of being represented regardless of length or sequence composition (providing an an-choring enzyme recognition site is present). Two single SAGE tags are ligated together to form ditags prior to any amplification step. Thus, the potential for biased PCR amplification of particular ditags (although minimal since all ditags are the same length) can be eliminated during tag extraction by discounting repeated occur-rences of particular ditag combinations (Velculescu et al., 1995). In the case of microarrays, on the other hand, relative data is generated and the only meaningful comparison is between test and reference levels of fluorescent signal intensity at a single position in the array. Different lengths and sequence compositions of cDNA clones across the array will result in varying hybridization kinetics and signal output. Comparison between physically separated array components could be confounded further by artifacts arising from construction of the chip itself and from the small-volume hybridization.
A major strength of the SAGE technique is that information about absolute transcript abundance in particular tissues or cell types is cumulative and can be stored. This feature allows cross-referencing and mining of data from other SAGE projects via the unique tag identifier number assigned to each tag. Because the tag identifier number is calculated from the sequence of the tag, consistency of experimental design in selection of the anchoring enzyme (specifying position) and tagging enzyme (determining tag length) is important. The vast majority of SAGE libraries con-structed to date have used the anchoring enzyme NlaIII and the tagging enzyme BsmF1. In addition, modification of the tagging enzyme allows tag length to be increased from 10 to 21 (long SAGE), significantly increasing accuracy of tag to gene mapping (SAGE 2001 meeting, September 2001, San Diego, USA).
AUGUSTINE, C., GUNNERSEN, J., SPIRKOSKA, V. and TAN, S-S (2001) Place and time-dependent expression of mouse sFRP-1 during development of the cerebral neocortex. Mech. Dev. 109: 395-397.
BARBE, M. F., and LEVITT, P. (1991). The early commitment of fetal neurons to the limbic cortex. J. Neurosci. 11: 519-533.
BARBE, M. F., and LEVITT, P. (1992). Attraction of specific thalamic input by cerebral grafts depends on the molecular identity of the implant. Proc. Natl. Acad. Sci. USA 89: 3706-3710.
BAYER, S. A. (1990). Development of lateral and medial limbic cortices in the rat in relation to cortical phylogeny. Exp. Neurol. 107: 118-131.
BAYER, S. A., and ALTMAN, J. (1991). Neocortical morphogenesis and histogen-esis. Neocortical Development. Raven Press, New York.
BERRY, M., and ROGERS, A. W. (1965). The migration of neuroblasts in the developing cerebral cortex. J. Anat. 99: 691-709.
BISHOP, K. M., GOUDREAU, G., and O’LEARY, D. D. (2000). Regulation of area identity in the mammalian neocortex by Emx2 and Pax6. Science 288: 344-349.
BOLZ, J., and GOTZ, M. (1992). Mechanisms to establish thalamocortical connec-tions in the developing brain. In Development of the central nervous system in vertebrates Plenum Press, New York, pp. 179-192.
BONCINELLI, E., GULISANO, M., SPADA, F. and BROCOLLI, V. (1995) Emx and Otx gene expression in the developing mouse brain. In Ciba Foundation Symposium 193 (Ed. Blakemore, C). John Wiley and Sons, Chichester, pp. 100-116.
BOWTELL, D. D. L. (1999). Options available - from start to finish- for obtaining expression data by microarray. Nature Genet. Suppl. 21: 25-32.
BRODMANN, K. (1909). “Vergleichende lokalizationlehre der Grosshimrinde in ihren Prinzipien dargestelt auf Grund des Zellenbaues.” Barth, Leipzig.
CATALANO, S. M., and SHATZ, C. J. (1998). Activity-dependent cortical target selection by thalamic axons. Science 281: 477-608.
COHEN-TANNOUDJI, M., BABINET, C., and WASSEF, M. (1994). Early determi-nation of a mouse somatosensory cortex marker. Nature 368: 460-463.
COOPER, N. G. F., and STEINDLER, D. A. (1986). Lectins demarcate the barrel subfield in the somatosensory cortex of the early postnatal mouse. J. Comp. Neurol. 249: 157-169.
CROSSIN, K. L., HOFFMAN, S., TAN, S. S., and EDELMAN, G. M. (1989). Cytotactin and its proteoglycan ligand mark structural and functional bound-aries in somatosensory cortex of early postnatal mouse. Dev. Biol. 136: 381-392.
De WAARD, V., van den BERG, B. M. M., VEKEN, J., SCHULTZ-HEIENBROK, R., PANNEKOEK, H., and van ZONNEVELD, A. J. (1999). Serial analysis of gene expression to assess the endothelial cell response to an atherogenic stimulus. Gene 226: 1-8.
DEHAY, C., GIROUD, P., BERLAND, M., SMART, I., and KENNEDY, H. (1993). Modulation of the cell cycle contributes to the parcellation of the primate visual cortex. Nature 366: 464-466.
DIATCHENKO, L., LAU, Y. F. C., CAMPBELL, A. P., CHENCHIK, A., MOQADAM, F., HUANG, B., LUKYANOV, S., LUKYANOV, K., GURSKAYA, N., SVERDLOV, E. D., and SIEBERT, P. D. (1996). Suppression subtractive hybridization: a method for generating differentially regulated or tissue-specific cDNA probes and libraries. Proc. Natl. Acad. Sci. USA 93: 6025-6030.
DUGGAN, D. J., BITTNER, M., CHEN, Y., MELTZER, P., and TRENT, J. M. (1999). Expression profiling using cDNA microarrays. Nature Genet. Suppl. 21: 10-14.
ERZURUMLU, R. S., and JHAVERI, S. (1990). Thalamic axons confer a blueprint of the sensory periphery onto developing rat somatosensory cortex. Dev. Brain Res. 56: 229-234.
FANNON, A. M., and COLMAN, D. R. (1996). A model for central synaptic junctional complex formation based on the differential adhesive specificities of the cadherins. Neuron 17: 423-434.
FERRI, R. T., and LEVITT, P. (1993). Cerebral cortical progenitors are fated to produce region-specific neuronal populations. Cereb. Cortex 3: 187-198.
FINLAY, B. L., and DARLINGTON, R. B. (1995). Linked regularities in the develop-ment and evolution of mammalian brains. Science 268: 1578-1584.
FRANTZ, G. D., WEIMANN, J. M., LEVIN, M. E., and McCONNELL, S. K. (1994a). Otx1 and Otx2 define layers and regions in developing cerebral cortex and cerebellum. J.Neurosci. 14: 5725-5740.
logical advances, this price is not expected to diminish rapidly since a major disadvantage of the currently available high-density microarrays on glass supports is that they are not reusable. While running a large-scale SAGE project is by no means cheap, the fundamental instrumentation (thermocyclers for PCR and auto-mated DNA sequencing) is already installed in the majority of laboratories making the technique far more accessible.
Comparison of Genes expressed at Different Stages
and Different Regions
We have completed a comparison of the two SAGE libraries, each containing approximately 20,000 tags (from each time point) representing approximately 11,000 unique transcripts (Gunnersen et al., 2002). This analysis has identified genes that are differen-tially expressed in these discrete developmental epochs. Notably, genes more highly expressed at E15 included known cell division genes and transcription factors of the bHLH, Sox, zinc finger, ring finger and winged helix gene families. To further compare region-ally-expressed genes, we generated 40,000 tags from anterior cortex and compared an equal pool from posterior cortex (from embryonic day 15). Preliminary results suggest differential expres-sion of roughly 200 to 300 different genes. The readily identifiable genes fit into several different categories including transcription factors (homeobox, zinc finger), signalling molecules (Wnt recep-tor, phosphotases, kinases), and translational proteins. Future work will compare SAGE libraries obtained from medial versus lateral regions of the developing neocortex (Fig. 4).
Conclusions
The SAGE technology outlined in this review offers a powerful tool for systematic and comprehensive molecular description of the developing cortex. Genetic attributes from all developmental stages of the cortex can be plumbed, in addition to mutant cortices arising from genetic variation. Although we have chosen the cortex as the object of our enquiry, the same rationale may be applied to other parts of the nervous system. More importantly, this approach has the potential to re-define the current way of studying brain devel-opment in molecular terms. No longer will the traditional gene by gene approach be considered sufficient or sophisticated enough for studying the problem. Instead, simultaneous read out of genetic activity will provide new frameworks for generating new hypoth-eses. Just as the dawn of molecular biology led to radical shifts in methodologies and paradigms for studying evolutionary theory, genome scale analysis of gene expression is expected to provide new understandings on the operation of genetic networks during brain development.
References
ALLENDOERFER, K. L., and SHATZ, C. J. (1994). The subplate, a transient neocortical structure: its role in the development of connections between thalamus and cortex. Annu. Rev. Neurosci. 17: 185-218.
ANGEVINE, J. B., and SIDMAN, R. L. (1961). Autoradiographic study of cell migration during histogenesis of the cerebral cortex in the mouse. Nature 192: 766-768.
FRANTZ, G. D., BOHNER, A. P., AKERS, R. M., and McCONNELL, S. K. (1994b). Regulation of the POU domain gene SCIP during cerebral cortical development. J. Neurosci. 14: 472-485.
FUKUCHI-SHIMOGORI, T., and GROVE, E. A. (2001). Neocortex patterning by the secreted signaling molecule FGF8. Science 294: 1071-1074.
GHOSH, A. (1995). Subplate Neurons and the Patterning of Thalamocortical Connections. In Development of the Cerebral Cortex. Proc. Ciba Foundation Symp.”, John Wiley & Sons, Chichester, pp. 150-172.
GHOSH, A. and SHATZ, C. J. (1993). A role for subplate neurons in the patterning of connections from thalamus to neocortex. Development 117: 1031-1047.
GUNNERSEN, J.M., SPIRKOSKA, V., SMITH, P.E., DANKS, A. and TAN, S-S (2000). Growth and migration markers of rat C6 glioma cells identified by serial analysis of gene expression. Glia 32: 146-154.
GUNNERSEN, J.M., AUGUSTINE, C., SPIRKOSKA, V., KIM, M., BROWN, M., and TAN, S-S. (2002) Global analysis of gene expression patterns in developing mouse neocortex using Serial Analysis of Gene Expression (SAGE). Mol. Cell Neurosci. (in press)
HASTIE, N. D., and BISHOP, J. O. (1976). The expression of three abundance classes of messenger RNA in mouse tissues. Cell 9: 761-774.
HE, T. C., SPARKS, A. B., RAGO, C., HERMEKING, H., ZAWEL, L., da COSTA, L. T., MORIN, P. J., VOGELSTEIN, B., AND KINZLER, K. W. (1998). Identification of c-MYC as a target of the APC pathway. Science 281: 1509-1512.
HEDRICK, S. M., HEDRICK, S. M., AND HEDRICK, S. M. (1984). Isolation of cDNA clones encoding T-cell-specific membrane-associated proteins. Nature 308: 149-153.
HERRMANN, K., AND SHATZ, C. J. (1995). Blockade of action potential activity alters initial arborization of thalamic axons within cortical layer IV. Proc. Natl. Acad. Sci. USA 92: 11244-11248.
LAL, A., STRAUSBERG, R. L., PRANGE, C., LASH, A., MARRA, M., PAPADOPOULOS, N., KINZLER, K., AND RIGGINS, G. J. (1999). Expression analysis of multiple tumors for the Cancer Genome Anatomy Project using Serial Analysis of Gene Expression (abstract). In “SAGE workshop”, Hilversum, The Netherlands.
LEVITT, P., BARBE, M. F., AND EAGLESON, K. L. (1997). Patterning and specification of the cerebral cortex. Annu. Rev. Neurosci. 20: 1-24.
LIANG, P., AND PARDEE, A.B. (1992). Differentiated display of the eukaryotic messenger by means of the polymerase chain reaction. Science 257: 967-971.
McCONNELL, S. K., GHOSH, A., AND SHATZ, C. J. (1989). Subplate neurons pioneer the first axon pathway from the cerebral cortex. Science 245: 978-982.
METIN, C., AND FROST, D. O. (1989). Visual responses of neurons in somatosen-sory cortex of hamsters with experimentally induced retinal projections to somatosensory thalamus. Proc. Natl. Acad. Sci. USA 86: 357-361.
MIYASHITA-LIN, E.M., HEVNER, R., WASSERMAN, K., MARTINEZ, S. and RUBENSTEIN, J.L. (1999) Early neocortical regionalization in the absence of thalamic innervation. Science 285, 905-909.
MOLNAR, Z., AND BLAKEMORE, C. (1991). Lack of regional specificity for connec-tions formed between thalamus and cortex in co-culture. Nature 351: 475-477.
MOLNAR, Z., ADAMS, R., AND BLAKEMORE, C. (1998). Mechanisms underlying the early establishment of thalamocortical connections in the rat. J. Neurosci. 18: 5723-5745.
NAKAGAWA, Y., JOHNSON, J. E., AND O’LEARY, D. D. (1999). Graded and areal expression patterns of regulatory genes and cadherins in embryonic neocortex independent of thalamocortical input. J. Neurosci. 19: 10877-10885.
NORTHCUTT, R. G., AND KAAS, J. H. (1995). The emergence and evolution of mammalian neocortex. Trends Neurosci. 18: 373-379.
O’LEARY, D. D. M., SCHLAGGAR, B. L., AND TUTTLE, R. (1994). Specification of neocortical areas and thalamocortical connections. Annu. Rev. Neurosci. 17: 419-439.
POLLEUX, F., DEHAY, C., MORAILLON, B., AND KENNEDY, H. (1997). Regula-tion of neuroblast cell-cycle kinetics plays a crucial role in the generaRegula-tion of unique features of neocortical areas. J. Neurosci. 17: 7763-7783.
POLYAK, K., XIA, Y., ZWEIER, J. L., KINZLER, K. W., AND VOGELSTEIN, B. (1997). A model for p53-induced apoptosis. Nature 389: 300-305.
PRAKASH, N., VANDERHAEGHEN, P., COHEN-CORY, S., FRISEN, J., FLANAGAN, J. G., AND FROSTIG, R. D. (2000). Malformation of the func-tional organization of somatosensory cortex in adult ephrin-A5 knock-out mice revealed by in vivo functional imaging. J. Neurosci. 20: 5841-5847.
ROCKEL, A. J., HIORNS, R. W., AND POWELL, T. P. S. (1980). The basic uniformity in structure of the neocortex. Brain 103: 221-244.
SCHULER, G. D., AND AUTHORS (1996). A gene map of the human genome. Science 274: 540-546.
SILVER, L. M. (1995). Mouse Genetics Oxford University Press, Oxford.
SIMEONE, A., ACAMPORA, D., GULISANO, M., STORNAIUOLO, A., AND BONCINELLI, E. (1992). Nested expression domains of four homeobox genes in developing rostral brain. Nature 358: 687-690.
STEINDLER, D. A., COOPER, N. G. F., FAISSNER, A., AND SCHACHNER, M. (1989). Boundaries defined by adhesion molecules during development of the cerebral cortex: the J1/tenascin glycoprotein in the mouse somatosen-sory cortical barrel field. Dev. Biol. 131: 243-260.
STOYKOVA, A. AND GRUSS, P (1994) Roles of Pax-genes in developing and adult brain as suggested by expression patterns. J. Neurosci. 14: 1395-1412.
SUR, M., GARRAGHTY, P. E., AND ROE, A. W. (1988). Experimentally induced visual projections into auditory thalamus and cortex. Science 242: 1437-1441.
TAKAHASHI, T., NOWAKOWSKI, R. S., AND CAVINESS, V. S. (1996). The leaving or Q fraction of the murine cerebral proliferative epithelium: a general model of neocortical neuronogenesis. J. Neurosci. 16: 6183-6196.
TAN, S.-S. (1991). Liver-specific and position-effect expression of a retinol-binding protein-lacZ fusion gene (RBP-lacZ ) in transgenic mice. Dev. Biol. 146: 24-37.
TAN, S.-S., AND BREEN, S. J. (1993). Radial mosaicism and tangential disper-sion both contribute to mouse neocortex development. Nature 362: 638-640.
TAN, S.-S., WILLIAMS, E. A., AND TAM, P. P. L. (1993). X-chromosome inactivation occurs at different times in different tissues of the post-implanta-tion mouse embryo. Nature Genet. 3: 170-174.
TAN, S.-S., FAULKNER-JONES, B. E., BREEN, S. J., WALSH, M., BERTRAM, J. F., AND REESE, B. E. (1995). Cell dispersion patterns in different cortical regions studied with an X-inactivated transgenic marker. Development 121: 1029-1039.
TAN, S.-S., STURM, K., TAM, P. P. L., REESE, B. E., AND FAULKNER-JONES, B. E. (1998). Separate progenitors for radial and tangential cell dispersion during development of the cerebral neocortex. Neuron 21: 295-304.
VANDERHAEGHEN, P., LU, Q., PRAKASH, N., FRISEN, J., WALSH, C. A., FROSTIG, R. D., and FLANAGAN, J. G. (2000). A mapping label required for normal scale of body representation in the cortex. Nature Neurosci. 3: 358-365.
VELCULESCU, V. E., ZHANG, L., VOGELSTEIN, B., AND KINZLER, K. W. (1995). Serial analysis of gene expression. Science 270: 484-487.
VELCULESCU, V. E., ZHANG, L., ZHOU, W., VOGELSTEIN, J., BASRAI, M. A., BASSETT, D. E., JR., HIETER, P., VOGELSTEIN, B., AND KINZLER, K. W. (1997). Characterization of the yeast transcriptome. Cell 88: 243-251.
VERES, G., GIBBS, R. A., SCHERER, S. E., AND C.T., CASKEY. (1987). The molecular basis of the sparse fur mouse mutation. Science 237: 415-417.
WOOLSEY, T. A., and van der LOOS, H. (1970). The structural organization of layer IV in the somatosensory regions (SI) of mouse cerebral cortex: the description of a cortical field composed of discrete cytoarchitectonic units. Brain Res. 17: 205-242.
ZHANG, L., ZHOU, W., VELCULESCU, V. E., KERN, S. E., HRUBAN, R. H., HAMILTON, S. R., VOGELSTEIN, B., AND KINZLER, K. W. (1997). Gene expression profiles in normal and cancer cells. Science 276: 1268-1272.