Learning by modelling: A study of individual differences
Kirsten ter Horst (s1092774)
UNIVERSITY OF TWENTE
DEPARMENT OF BEHAVIOURAL SCIENCE
Examination committee
First Advisor: Dr. Y.G. Mulder
1
Abstract
Modelling is a useful cognitive skill that is becoming increasingly important in many domains,
especially in science. Learning by creating computer models actively engages students in their
knowledge construction and offers students the possibility to test their acquired understanding. In
practice, however, novice modellers experience several difficulties, whereby learning gains often fail
to show. This study investigated whether self-explanations can overcome these difficulties and
enhance student’s domain knowledge and the quality of their models. High school students (n= 34)
were asked to perform a modelling task that required them to construct a coherent model of the effects
of alcohol consumption on the human body. During the entire modelling task students were asked to
think aloud. Students were post hoc classified as either high self-explainers, i.e., students that
generated a minimum of 11 self-explanations; n= 24, or low self-explainers, i.e., students that
generated less than 11 self-explanations; n= 10. The main results were derived from between-group
analysis of knowledge gain scores and model performance scores. The between group analyses
concerning knowledge gain scores showed that there were significant differences between high and
low self-explainers in favour of the former. However, no student constructed a model that reflected a
complete understanding of the alcohol processes, and differences between high and low self-explainers
in model performance scores failed to show.
2
Samenvatting
Modelleren is een nuttige cognitieve vaardigheid die steeds belangrijker wordt in diverse gebieden,
vooral in de wetenschap. Leren door het creëren van computermodellen zorgt er voor dat studenten
actief kennis construeren en biedt studenten de mogelijkheid om hun verworven kennis te testen. In de
praktijk blijkt echter dat beginnende modelbouwers verscheidene problemen ondervinden, waardoor
de gewenste leerwinsten vaak uitblijven. Deze studie onderzocht of zelf-verklaringen tijdens het
modelleren deze problemen kunnen verminderen of voorkomen, en of zelf-verklaringen daarmee in
staat zijn om domeinkennis te vergroten en de kwaliteit van modellen te verbeteren. Middelbare
scholieren (n= 34) werden gevraagd om een modelleer taak uit te voeren waarbij ze een
samenhangend model moesten construeren van het effect van alcoholconsumptie op het menselijk
lichaam. Gedurende de gehele modelleer taak werden de studenten gevraagd hardop te denken.
Studenten werden post hoc ingedeeld in frequente zelf-uitleggers, studenten die een minimum van 11
zelf-verklaringen genereerden; n= 24, of sporadische uitleggers, studenten die minder dan 11
zelf-verklaringen genereerden; n= 10. De belangrijkste resultaten vloeiden voort uit de uitgevoerde tussen
groepen analyses van leerwinst scores en modelprestatie scores. Een tussen groepen analyse
betreffende leerwinst scores toonde aan dat er significante verschillen waren voor frequente en
sporadische uitleggers. De gemiddelde leerwinst score was veel hoger voor frequente
zelf-uitleggers dan voor sporadische zelf-zelf-uitleggers. Echter construeerde geen enkele student een model dat
een volledige weergave van de alcohol processen gaf. Daarnaast bleken er geen verschillen te zijn
tussen frequente en sporadische zelf-uitleggers betreffende modelprestatie scores.
3
Table of contents
1. Introduction ... 4
1.1 Present study and hypotheses ... 7
2. Method ... 8
2.1 Participants ... 8
2.2 Materials ... 8
2.2.1 Modelling program ... 8
2.2.2 Modelling task ... 9
2.2.3 Instructional text ... 9
2.2.4 Knowledge test ... 9
2.3 Procedure ... 10
2.4 Coding and scoring ... 11
2.4.1 Coding and scoring of self-explanations ... 11
2.4.2 Coding and scoring of learning outcomes ... 12
2.4.3 Coding and scoring of model run scores ... 12
2.4.4 Coding and scoring of performance success ... 12
2.5 Analyses ... 13
3. Results ... 14
4. Discussion ... 17
5. References ... 21
6. Appendices ... 23
Appendix A ... 23
Appendix B ... 26
Appendix C ... 28
Appendix D ... 29
Appendix E ... 30
Appendix F ... 31
6
therefore say that in case of well-structured domains learning with worked-out examples needed theamplification of self-explanations. In other words, self-explanations were of such essential importance,
that without applying them much less learning effect of worked-out examples could be shown.
However, learning by modelling differs in critical ways from learning in well-structured domains with
worked-out examples. Learning with worked-out examples in contrast with learning by modelling
prevents learners from using load-intensive strategies, this enables them to focuses their attention on
the principles to-be-learned. With learning by modelling students independently have to build a
coherent model versus learning with worked-out examples were students are guided through the entire
process. So we cannot just assume that learning by modelling will also benefit from self-explanations.
On the other hand there is a reason to believe that modelling could also benefit from
self-explanations. Hilbert et al. (2008) investigated the effect of self-explanation in a concept mapping task,
and found results that were consistent with the original findings of Renkl (1997). Concept mapping is
a method of graphically representing concepts and their interrelations, which closely resembles the
core characteristics of modelling. In both concept mapping and modelling a lot is asked from students:
they have to engage in several processes at a time. Hilbert et al. (2008) showed that there were
significant differences in learning gains between students who were prompted to generate
self-explanations during a concept mapping task and students who were not prompted. We have therefore
reason to believe that students can also benefit from self-explanations in less structured learning
methods. According to Renkl and Atkinson (2003), self-explanation activities may be considered
effective in concept mapping because, although it increases cognitive load even more, it also directly
contributes to mental model construction. As concept mapping is very comparable with modelling, it
seems plausible that students will also benefit from self-explanations when learning by modelling.
However, in contrast with concept mapping we have also reason to believe that self-explanations will
arise spontaneously. Modelling includes the stage data interpretation, data interpretation is supposed to
occur when students run the model. When they run the model the results of their input will be shown
(Mulder et al., 2010). Not all the information about the rationale of the answer that is necessary for
understanding the solution procedure is included in the runs. It seems therefore likely that this data
interpretation phase will lead to self-explaining. When students actively explain the information the
7
1.1 Present study and hypotheses
The purpose of the present study was to answer the general research question: Is frequency of
generated self-explanations related to how much students benefit from a learning by modelling task?
This study therefore utilized an observational design that observed the generation of spontaneous
self-explanations. The learning environment was designed in accordance with Mulder et al.’s (2011). To be
able to register the generated self-explanations students were asked to think-aloud during the entire
modelling task.
To answer the research question three hypotheses were investigated. The first hypothesize
concerned the learning gains. Consistent with Renkl (1997) and Hilbert and Renkl (2009), students
who evidenced more self-explanations were expected to learn more from the task than students who
generated fewer self-explanations. Said differently, a higher frequency of generated self-explanations
during a modelling task will enhance learning gains (Hypothesis 1). The second hypothesis concerned
the reason why some students will generate more self-explanations then others during a modelling task.
Following the presumption that data interpretation will lead to self-explanations, and that data
interpretation supposed to occur during a model run we hypothesize that: The more often a model run
is performed the more self-explanations will be generated (Hypothesis 2). Previous research on
self-explanations only investigated whether self-self-explanations were a predictor for learning gains. As it
seems plausible that students who learned more also performed better, it was in this study also
investigated whether self-explanations were also a predictor for performance success. We hypothesize
that: A higher frequency of generated self-explanations during a modelling task will lead to a higher
8
2. Method
2.1 Participants
The sample consisted of 34 Dutch high school students (23 men, 11 women). The average age of the
students was 16.53 years (SD= 0.79) All participants were enrolled in the interdisciplinary beta subject
NLT (nature, living, & technique). The sample consisted of a lot more men than women, which was
due to the fact that all students had an NT (nature & technique) or an NH (nature & health) profile, in
the Netherlands in general more men than women choose these exact profiles. The sample consisted of
two groups, one Havo group (general higher secondary education) of (11 men, 3 women) and one
Vwo group (pre university education) of (12 men, 8 women); these two levels of education are above
average.
2.2 Materials
2.2.1 Modelling program
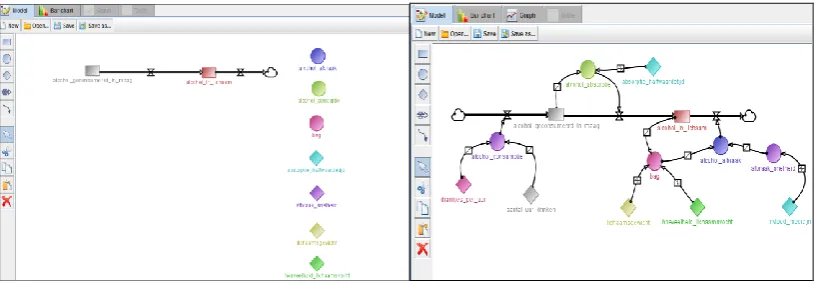
Participants engaged in a modelling task using the modelling program SCYDynamics. This program
can be used to create and run models in the system dynamics modelling language. Models created with
SCYDynamics have a graphical structure that consists of variables and relationships a (see Figure 1).
Variables are the constituent elements of a model and relations define how two or more variables are
related. When participants have created a model or a part of it they can see the output of these
creations when they run the model. The output can then be analysed through a bar chart, or graph tool.
When participants were confused about the meaning of certain tools of the program they could consult
a modelling manual that offered an explanation and examples of the operation of the tools.
13
Model concept scores were assessed for students’ created concepts. The total model consistedof five concepts: including ingestion, absorption, distribution, elimination, and elimination extension.
The concepts were scored by a software agent that filtered the information from the log files. A
scoring rubric was designed that assessed the five concepts separately (Appendix C). A concept was
seen as correct when it included all the belonging elements and relationships, when this was the case
one point were assigned. For the concepts ingestion and elimination extension, one or more elements
needed to be created by the students themselves, therefore these concepts could only be scored as
correct when the variables belonging to a concept were created correctly (the right name and the right
kind). All concepts could earn one additional point when the correct qualitative specifications were
chosen, so a maximum of two points could be achieved per concept. The maximum model concept
score was 10 points.
2.5 Analyses
To test the hypotheses that were established in the introduction the following statistical analyses were
conducted. First, knowledge gain scores were computer by subtracting the pre-knowledge scores from
the post-knowledge scores, then a paired sample t-test was performed to determine whether post-test
scores significantly differed from pre-test scores. To determine if significant differences for high and
low self-explainers concerning, pre-knowledge scores, gain scores, amount of feedback requested,
model structure and model concept scores existed analyses of variance where conducted. Finally,
correlation analyses were performed to provide insights into the interdependence of all the used
14
3. Results
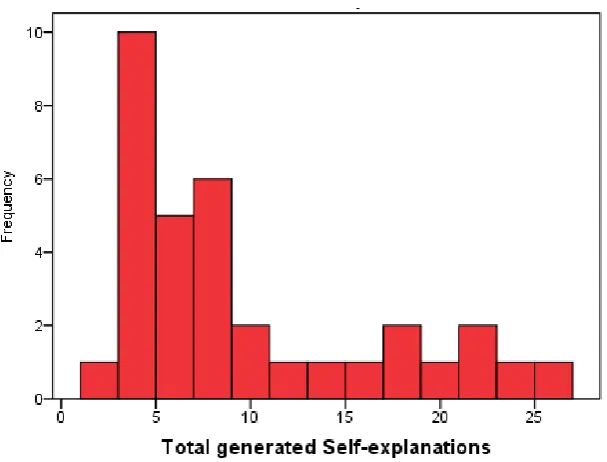
Individual differences were reported by dividing the sample into ''high'' and ''low''
self-explainers. These two groups were defined post hoc, using the students’ number of generated
self-explanation scores. It appeared that the self-explanation data was not normally distributed
and that the data was very skewed to the right, which indicated that most students generated a
very low amount of explanation against a few students that generated al lot of
self-explanations (Figure 2). The histogram shows a clear transition from a few to a lot generated
explanations at 11. Students were therefore defined as high explainers when a
explanation score of at least 11 was obtained. Students who generated less than 11
self-explanations were defined as ''low'' self-explainers.
Figure 2 Distribution of Generated Self-explanations
To determine whether students in general learned from the modelling task a paired sample
t-test was performed. The mean score for post-knowledge (M= 3.88, SD= 1.72) was higher than the
mean score for pre-knowledge (M=2.86, SD=1.22). It appeared that the scores were significantly
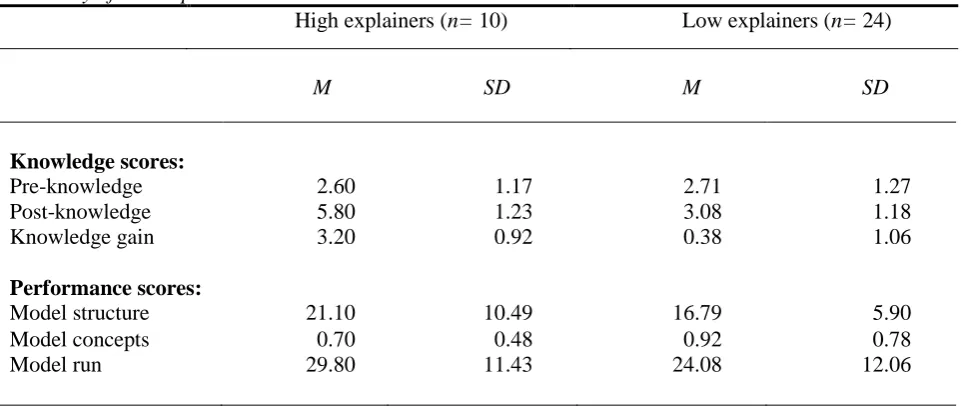
different, t (33) = -4.27, p = <.001. Table 1 summarizes the descriptive statistics for participants’
scores in the high self-explainer and the low self-explainer group. Univariate analysis of variance
(ANOVA) revealed no significant differences between the high and low self-explainer groups
15
Table 1Summary of Participants Scores
High explainers (n= 10) Low explainers (n= 24)
M SD M SD
Knowledge scores:
Pre-knowledge 2.60 1.17 2.71 1.27
Post-knowledge 5.80 1.23 3.08 1.18
Knowledge gain 3.20 0.92 0.38 1.06
Performance scores:
Model structure 21.10 10.49 16.79 5.90
Model concepts 0.70 0.48 0.92 0.78
Model run 29.80 11.43 24.08 12.06
To test Hypothesis 1, that self-explanation scores influenced knowledge gain scores, a
univariate ANOVA was performed. Results yielded a main effect for self-explainer group (high/low),
F(1, 34) = 54.26, p = <.001, such that the average gain score was significantly higher for high
self-explainers than for low self-self-explainers. Hypothesis 2 predicted that a students’ model run scores could
predict self-explanation scores. To analyse this hypothesis a univariate ANOVA was performed and
revealed that there were no significant differences for high and low self-explainers concerning the
average amount of runs performed F(1,34) = 1.63, p= .211. Hypothesis 3 predicted that
self-explanation scores could enhance performance success. As the scores of the dependent variables
model structure and model concept score were not normally distributed, Mann Whitney U tests for two
independent samples were conducted to test this hypothesis. The first analysis determined whether the
model structure scores varied as a function of whether students were defined as high (MR= 21) or low
(MR= 16.04) self-explainers, the results were not significant, U = 85, p= .182. The second analysis
determined whether the model concept scores varied as a function of whether students were defined as
high (MR= 16) or low (MR= 18.13) self-explainers, these results were also not significant, U = 105,
p= .518.
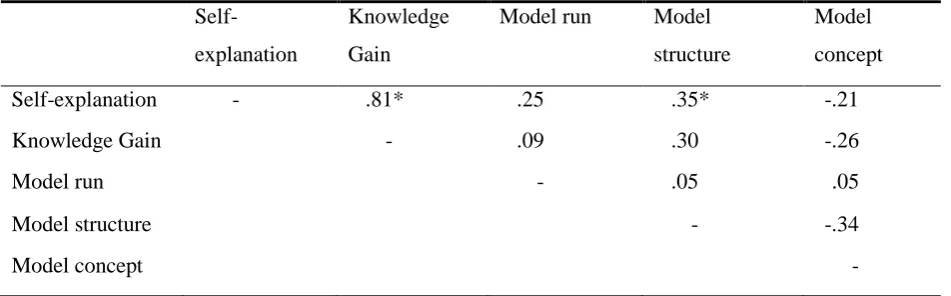
Table 2 summarizes the performed correlations analysis. Two correlations appeared to
be significant. As expected self-explanation scores and knowledge gain scores were highly
correlated. The correlation between self-explanation scores en model structure scores was less
16
Table 4Summary of Correlation Analyses
Self-explanation
Knowledge
Gain
Model run Model
structure
Model
concept
Self-explanation - .81* .25 .35* -.21
Knowledge Gain - .09 .30 -.26
Model run - .05 .05
Model structure - -.34
Model concept -
19
without the provision of support structures can be a productive exercise in failure. In the study
of Kapur (2008) there were two groups, one who solved ill-structured problems and one who
solve structured problems. The ill-structured group struggled with defining and analyzing the
problems, resulting in poor quality of solutions. However, despite failing during the task,
these students outperformed their counterparts in the well-structured condition on near- and
far-transfer measures. Suggesting that high learning gains do not immediately imply high
performance success.
So it appeared that self-explanations led to a complex relation between the model performance
and students’ knowledge gains. Students’ model performance was quite low which is very contrasting
with the high knowledge gains. There are two possible conclusions concerning the effect of
self-explanations, (1) self-explanations were able to enhance learning gains but were not able to enhance
model performance, or, (2) high self-explainers did understand the task but did not take the effort to
adjust their models correctly. This is quite possible because students knew they did not receive a grade
for the modeling task. The existing research on self-explanations only tested if self-explanations were
an indicator for learning gains, but they did not test if self-explanations could be a predictor for
performance scores. So we cannot say if this is consistent with earlier research on self-explanations.
What we can say is that for modelling in general performance scores are often quite modest and that
learning gains often fail to show (Mulder et al., 2010). So the modest performance scores in our study
resemble those of earlier studies on modelling.
Of course, the present study not only provided answers to the research questions, it also
provides suggestions for future investigations. This study established that learning by modelling can
benefit from self-explanations. In order to ensure that in the future all students are able to benefit from
self-explanations further research should develop self-explanation prompts just as was done for
concept mapping in the research of Hilbert and Renkl (2008). The research of Atkinson et al. (2003)
also showed the effectiveness of self-explanation prompts, the prompts were used for a new
worked-out example method whereby more and more worked-worked-out solution steps were removed as learners
transition from relying on examples to independent problem solving, to facilitate this transition
self-explanation prompt were added.
To even further enhance the effects of self-explanation prompts on learning gains, a distinction
between different forms of self-explanations should be made to develop the most effective prompts. In
the research of Renkl (1997) five self-explanation categories and two monitoring categories were
established. It appeared that certain self-explanation categories were able to enhance learning gains
20
most successful categories. Principle based explanations, indicated in their study that students referredto the principles of probability calculation and explained these principles to themselves. In the case of
modelling a possible example of a principle based explanation could be ''This relationship must be
linear, because when X increases Y also increases ''. Anticipative reasoning indicated in their study
that students were making connections between examples and thinking ahead, in the case of modelling
a possible example could be ''This element is shaped as a diamond, and I know that this element
cannot change over time, so this mean that all other diamonds are also constant ''. When a combination
of these two categories was used even more learning gains were obtained.
In the case of modelling there is however an obstacle concerning the timing of the prompts.
For learning with worked-out examples it is very logical were to give prompts as this method is very
structured, but for modelling it would be rather difficult to find those critical points. A possible
solution to overcome this problem could be to look at the timing were students with very high
knowledge gain scores generated self-explanations.
In conclusion it can be said that self-explanations are able to enhance learning by modelling.
Further research should concentrate on the development of prompts, so that in the future all students
23
6. Appendices
Appendix A
Codering self-explanations
1. Omschrijving self-explanation
explanations: Het aan je zelf uitleggen van een opdracht, tekst, programma etc. explanation is dus een constructieve activiteit waarin actief kennis wordt verworven. Self-explanations kunnen betrekking hebben op verschillende onderwerpen maar bevatten altijd een uitleg of verklaring van het betreffende onderwerp.
2. Codeer instructies:
Er bestaan verschillende vormen van self-explanations, deze worden duidelijk in het schema hieronder. Deze dienen als hulp bij het coderen, maar tijdens het coderen worden in deze vormen geen onderscheidt gemaakt.
Alleen de frequentie explanations worden gecodeerd niet de frequentie geen self-explanations.
27
*Uitleg variabelen:
Aan variabelen kunnen maximaal 2 punten worden toegekend:
1 punt voor de juiste naam van de variabele
1 punt wanneer de juiste soort variabele is gekozen
*Uitleg relaties:
Aan relaties kunnen maximaal 3 punten worden toegekend:
1 punt voor elke juiste link tussen variabelen
30
Appendix E
Beoordeling schema kennis toets
Naam:
Leerling nummer:
Sectie 1 punten:
Vraag 1:
Vraag 2:
Totaal:
Sectie 2 punten: Vraag 3:
Vraag 4:
Vraag 5:
Vraag 6:
Totaal:
Sectie 3 punten: Vraag 7:
Vraag 8:
32
Hoe verdeeld alcohol zich over je lichaam?
Met het bloed verspreidt de alcohol zich door je lichaam. Omdat lichamen verschillen heeft het drinken van alcohol dus niet bij iedereen dezelfde effecten. Daarom wordt vaak gekeken naar de relatieve hoeveelheid alcohol in je lichaam. Dit wordt aangegeven met de term Bloed Alcohol Gehalte oftewel BAG. BAG is het aantal gram alcohol per liter bloed, ook wel het alcoholpromillage genoemd. Het drinken van alcohol zorgt niet bij iedereen voor hetzelfde bloedalcoholgehalte, er zijn grote
individuele verschillen: de ene drinker is de andere niet. De hoeveelheid lichaamsvocht blijkt van invloed op het bloedalcoholgehalte. Gewicht is hier natuurlijk van belang; bij een zwaarder persoon kan hetzelfde glas alcohol zich over meer kilo’s verdelen dan bij een lichter persoon. Ook blijkt de hoeveelheid lichaamsvocht per kilo per persoon te verschillen. Het lichaam van een vrouw bevat een lager percentage lichaamsvocht per kilo dan dat van een man. Daarom
wordt de alcohol bij vrouwen minder verdund en zijn vrouwen gemiddeld sneller onder invloed dan mannen.
Hoe wordt alcohol weer afgebroken?
Alcohol wordt ook weer door je lichaam afgebroken. Gelukkig maar, anders zou je constant dronken zijn. Alcohol wordt voornamelijk afgebroken door de lever. Via je bloedbaan komt alcohol in je lever. Daar wordt het afgebroken door twee enzymen. Het enzym
alcoholdehydrogenase (ADH) zet de alcohol om naar acetaldehyde. Dit is een stofje wat erg irriterend is en voor een groot deel bijdraagt aan een kater. Het enzym Aldehydedehydrogenase (ALDH) breekt deze stof vervolgens verder af naar azijnzuur en uiteindelijk naar het
onschadelijke kooldioxide en water. Hoe snel alcohol wordt afgebroken is afhankelijk van de afbraaksnelheid, deze is ongeveer 7 gram per uur. Een alcoholconsumptie bevat 10 gram. De lever doet er dus 1,5 uur over de afbraak van 1 standaardglas alcohol.
34
2. Kijk in de grafiek naar de hoeveelheid geconsumeerde alcohol en naar de hoeveelheid alcoholin het lichaam. En vergelijk deze grafiek met de grafiek van situatie 1.
Je ziet dat de hoeveelheid geconsumeerde alcohol langere tijd boven nul licht. Dit heeft een effect op de hoeveelheid alcohol in je lichaam: in vergelijking met situatie 1 stijgt de hoeveelheid alcohol in je lichaam langer, wordt dus ook hoger en heeft dus ook weer langer de tijd nodig om uit je lichaam te verdwijnen. Als jouw grafiek andere resultaten laat zien, klopt je model niet met de werkelijkheid. Is dat het geval, dan moet je je model verbeteren.
3. Sla je model op onder de naam ‘situatie2’, als je model af is.
3. Controleer je model: (situatie 3)
In een normale situatie breekt de lever alcohol met een snelheid van ongeveer 7 gram per uur af. Hierin zitten wel individuele verschillen, van zo’n 5 tot zo’n 13 gram per uur. Medicijnen (waaronder paracetamol) kunnen de afbraak van alcohol vertragen. Je kunt het model laten doorrekenen wat er gebeurt stel dat medicijnen de afbraak van alcohol ernstig tot volledig vertragen. Dit doe je als volgt:
1. Pas je model aan zodat de afbraak van alcohol door medicijnen vertraagd wordt a. Voeg het element medicijnen toe.
b. verbind deze variabele zodat het model kloppend wordt. c. Stel de waarden voor de variabelen in.
2. Kijk in de grafiek naar de hoeveelheid geconsumeerde alcohol en naar de hoeveelheid alcohol in het lichaam. En vergelijk deze grafiek met de grafiek van situatie 1.
Je ziet een grafiek waarin de hoeveelheid alcohol in het lichaam niet meer in verhouding staat tot de hoeveelheid geconsumeerde alcohol. De hoeveelheid alcohol in het bloed is ontregeld en vooral toe. Dit kan ernstige gevolgen hebben.
Als jouw grafiek andere resultaten laat zien, klopt je model niet met de werkelijkheid. Is dat het geval, dan moet je je model verbeteren.
35
Appendix G
Coding table self-explanations
Naam: Leeftijd:
Leerling nummer: Havo/Vwo: Geslacht:
Opdracht Fases: Frequentie self-explanations:
(Situatie 1) Schetsen & Definiëren Tijdstip:
Totaal aantal minuten: Totaal aantal frequenties:
(Situatie 2) Controleer je model Tijdstip:
Totaal aantal minuten: Totaal aantal frequenties:
(Situatie 3) Controleer je model Tijdstip:
Totaal aantal minuten: Totaal aantal frequenties: