The 'Five Economists' Plan: The Original Idea and Further Developments
30
0
0
Full text
(2) CONTENTS Page. 1. Introduction. 1. 2. The Five Points in the ‘Five Economists’Plan. 1. 3. The Wage Tax Trade-Off. 2. 4. The Employment Effect of the Wage-Tax Tade-Off: Other Estimates That Have Been Produced. 7. 5. Discussion of Criticisms That Have Been Made of the Proposal. 9. 6. Conclusion. 19. Appendix 1. 20. Appendix 2. 23. Appendix 3. 26. References. 26. ii.
(3) The ‘Five Economists’ Plan:The Original Idea and Further Developments Peter Dawkins 1 Melbourne Institute of Applied Economic and Social Research, University of Melbourne. 1. Introduction In October 1998, I was one of five economists who wrote a letter to the Prime Minister, suggesting a suite of policies that could help to substantially reduce the unemployment rate to around 5 per cent. The other four were John Freebairn, Ross Garnaut, Michael Keating and Chris Richardson. This letter resulted from a period of discussion amongst the five, including at two conferences on unemployment, one hosted by the Melbourne Institute and one by the Reserve Bank and the ANU.2 Subsequent to this letter there has been much public discussion of the so called “five economists plan” and both the Federal Government and the Opposition have taken a considerable interest in the ideas put forward. Further, the Business Council of Australia endorsed the basic ideas its ‘New Directions’ paper on Rebuilding the Safety Net (Business Council of Australia 1999). There has also been a developing literature on the five economists plan in academia. This paper begins with a re-statement of the main features of the plan. Its main focus, however, is on the most publicised feature of the plan, a proposed wage tax trade-off, and the effect that would have on employment, unemployment and the distribution of income. Another important aim of the paper is to examine the main criticisms that the five economists have confronted. It is argued that having considered these criticisms the plan remains robust. It is conceded that there is a question-mark surrounding the political economy of the wage-tax trade-off proposal whether the institutional structures in Australia could facilitate its implementation. It is concluded that even this concern may be unfounded, but that some reform to the wage setting system may be beneficial.. 2. The Five Points in the ‘Five Economists’ Plan’ The ‘five economists’ letter to the Prime Minister in October 1998, can be summarised as containing five main points about the kind of policy package that could bring unemployment down to around 5 per cent. 1. Steady fiscal policy and monetary policy and continued microeconomic reform aimed at a continued strong and stable growth path. 2. Replacing Living Wage adjustments, for the time being, with tax credits for low wage earners in low income families, (to be done in a way that reduces effective marginal tax rates for low income families). 3. A long-term commitment to further reduce effective marginal tax rates, especially for low to middle income families. 4. A systematic approach to labour market programs. 5. Up-grading the education and training systems over the longer-term. 1. I am grateful to Simon Lambert for the material in Appendix 1 and to Rosanna Scutella for her assistance with Appendix 2. The text of the original letter was published in Dawkins (1999), pp. 57-59. © The Centre for Labour Market Research, 2002 2.
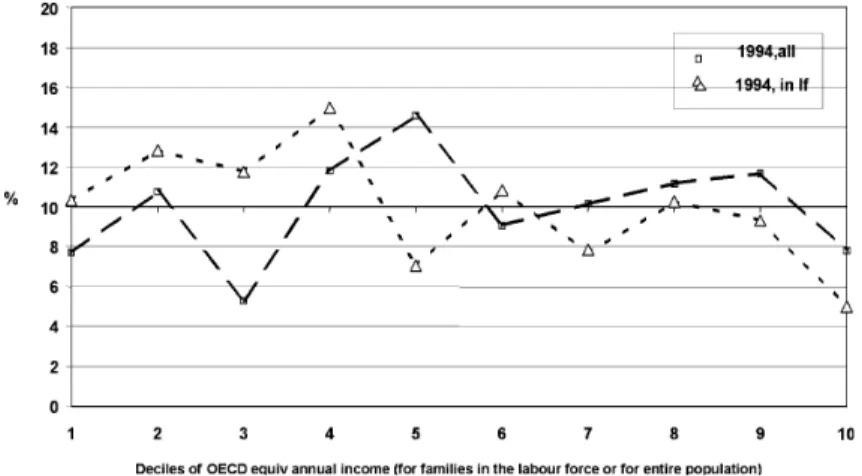
(4) In previous papers on the subject (Dawkins 1999, Dawkins et al. 2000, Keating 20013), we have discussed all five features of the plan. However, the five economists have received very little criticism in connection with points 1, 3 4 and 5. Point 2, the wage tax-trade-off, is the one that we emphasised most in our letter as a major innovation that could have substantial employment creating effects over the first few years of the plan. It has also been the most controversial aspect of our letter. This paper therefore concentrates on that part of the plan.. 3. The Wage Tax-Trade-Off An Overview We proposed that for a period of time, say four years, tax credits should be used as a way of increasing the incomes of low-wage earners in low-income families, rather than increases in the award wages safety net.. This approach had a number of advantages in our minds: i) Award wage increases are not a good way of increasing the incomes of low wage earners in low-income families; ii) Tax credits would be a much better way of increasing the incomes of low-wage earners in low-income families; iii) Suspending award wage increases for say four years, would have a very beneficial effect on employment, because it would significantly reduce the growth of average real wages, and iv) It would be especially helpful to the employment of low skilled labour because the wage of low skilled labour, relative to high skilled labour would be reduced. These four points are elaborated in the following four sub-sections. The Effect of Award Wage Increases on Low Wage Earners in Low-Income Families Research by Sue Richardson and Ann Harding (1998) highlighted how those people receiving low wage rates are well spread throughout the distribution of family incomes. This makes award wages safety net adjustments, sometimes called “Living Wage” increases, a very blunt equity device.. Figure 1 taken from Richardson and Harding (1998) shows their estimates of the proportion of adult minimum wage earners in each decile of the distribution of annual equivalent disposable family income, in 1994. 4 The bold broken line in the figure shows the distribution across all adults in the population in 1994. The dotted line shows the distribution across all those in the labour force. If minimum wage earners were equally distributed across the distribution of family incomes 10 per cent of them would be found in each decile. If we focus on the whole population of adults, the lowest incidence of minimum wage earners is found in the third decile (about 5 per cent) and the highest in the fifth decile 3. These papers also discussed the causes of high unemployment which provided useful back ground for the choice of the five features of the plan. Richardson and Harding also examine the distribution of low wage earners (with a higher cut-off than the national minimum wage), and find similar results. They also look at the effect on the distribution of income without equivalising income. This does not change the basic conclusion that low wage and minimum wage workers are well spread around the income distribution. 4. 2.
(5) (about 15 per cent). There is also a disproportionately high incidence of minimum wage earners in the seventh, eighth and ninth decile and even about 8 per cent in the top decile. In contrast they are disproportionately under-represented in the bottom and third deciles. The latter finding is partly because there is a disproportionate overrepresentation of people with no work at all in the lowest deciles. If we focus on those in the labour force, as would be expected there is a slightly higher representation of minimum wage earners in the bottom four deciles, but they are still very well spread around the whole distribution, with about half in the fifth decile or above. Figure 1 Proportion of Adult Minimum Wage Earners in Deciles of Annual Equivalent Disposable Family Income, in 1994 and 1986. Source: Richardson, S. and Harding, A. (1998) “Low Wages and the Distribution of Family Income in Australia”, Paper for Conference of the International Association for Research on Income and Wealth, Cambridge.. The Tax Credit Proposal and its Effects on Low Income Families and on Income Distribution One of the five economists, Michael Keating, developed a specific tax credit proposal (Keating and Lambert (1998a, 1998b). Under this proposal a tax-free tax credit of the order of 2 per cent would be paid as a supplement to the wage of low wage earners in low-income families, as an alternative to a Living Wage increase, in each year of the policy. After a certain level of income is reached the tax credit would be tapered out, but in combination with the tapering of other family payments in such a way as to avoid as far as possible, increasing effective marginal tax rates.. As an example, Keating pointed out that this would amount to an increase in disposable income of a little over $10 per week tax-free for a low paid employee earning two thirds of average male ordinary time earnings. To produce an equivalent increase in income for someone in the withdrawal range for family payment in the tax/transfer system that applied at the time would have required a wage increase of as much as $70 per week. This was nearly three times the $27 per week that the ACTU requested in its Living Wage claim in 1999. Subsequent to the Keating-Lambert proposal, the Coalition Government reformed the tax system with the ‘ANTS’ package. The Keating Lambert proposal was subsequently modified by Lambert (2000), to be well integrated with the new tax system.. 3.
(6) Lambert’s tax credit has been modelled on STINMOD as part of a modelling of the wage tax trade off implemented over a three year period. The tax credit was assigned a maximum value of $30 per week in 2003/04, at the end of the three years period (i.e. Maximum of $1,560 per annum). This credit grew from the first dollar of a family’s wage and salary income, accumulating at a 5 per cent rate, to the maximum at $31,150 (the projected threshold of the lower income test for FTB Part A). “While accumulated on an individual basis the tax credit was income tested on an income unit basis – consistent with the income testing of family assistance. In some cases the income test was extended to include other single income units considered to be dependent on the parental income unit (young students and the young unemployed). This extension was designed to be consistent with the current dependency rules for youth allowance. Eligibility for the tax credit was based solely on the receipt of wage and salary income by an individual. There was no link between award status and eligibility for the tax credit. Therefore someone who received the wage increase for those not on awards would be eligible for a tax credit and, subject to the income test, might receive an entitlement. On the other side of the coin, a person who did not receive a wage increase would be eligible for an earnings credit but might not receive any entitlement because of the operation of the income test. This might reflect that person’s own income (not all on awards are on low wages), a partner’s or parental income. The linking of the tax credit to FTB Part A means that it is more tightly tested (on an income unit basis) for those without dependent children who are not eligible for family assistance. There is therefore an element of horizontal equity in this approach.” (Lambert 2000, pp 31-32) The design of the tax credit and how it would fit in with Family Tax Benefit part is outlined in more detail in Appendix 1. An illustration of how would affect the hours/ income trade off for some hypothetical families are shown in Appendix 2. Lambert (2000) has also simulated the effects of the policy (including the trade-off with wages) on the distribution of income across Australian income units (roughly households), using the STINMOD model. His analysis suggests that the policy is likely to cause a redistribution of income away from the top part of the income distribution and towards the lower part boosting the incomes of low to middle income families. Table 1 is one of the tables from Lambert’s analysis. Columns 1 and 2 involve a wage tax trade-off, (column 2 having a higher average wage increase for those not relying on awards than column 1). The remaining columns do not have the award wage freeze or tax credits and represent a range of assumptions about the rates at which awards and other wages might increase over a three-year period (see appendix 2) The analysis is done in such a way that a good way of examining the effect of the policy is to compare column 1 with column 3 and column 2 with column 4, although other comparisons may also be made. The important point to note is that the winners from the policy, in terms of their share of disposable income) (in columns 1 and 2) are in income deciles 2 to 7, and the losers are in deciles 8, 9 and 10.. 4.
(7) Table 1 Share of Disposable Income by Decile of Weekly Disposable Income Sub-Scenario Decile of Weekly Income Unit Disposable Income 1 2 3 4 5 6 7 8 9 10 All. 1. 2. 3. 4. 5. 6. 7. 8. 9. 10. Share of Total Weekly Disposable Income % 0.91 0.90 0.91 0.90 0.91 0.89 0.91 0.90 0.91 0.89 3.55 3.51 3.54 3.50 3.53 3.50 3.54 3.50 3.53 3.50 4.59 4.55 4.55 4.52 4.55 4.51 4.55 4.52 4.55 4.52 6.08 6.04 6.04 5.99 6.04 5.99 6.04 5.99 6.04 5.99 7.34 7.32 7.19 7.17 7.20 7.18 7.19 7.17 7.20 7.17 8.83 8.81 8.72 8.71 8.71 8.71 8.71 8.72 8.71 8.71 10.55 10.55 10.52 10.53 10.52 10.53 10.52 10.52 10.52 10.53 13.15 13.18 13.19 13.21 13.21 13.22 13.19 13.22 13.20 13.21 16.98 17.02 17.13 17.20 17.16 17.20 17.14 17.19 17.15 17.20 28.02 28.12 28.22 28.27 28.19 28.26 28.21 28.28 28.19 28.27 100.00 100.00 100.00 100.00 100.00 100.00 100.00 100.00 100.00 100.00. Source: STINMOD. It should be stressed that the simulations were restricted to the first round effects of the policy and do not incorporate the effects of the employment increase of the kind found by Dixon and Rimmer (2000) and others. Since these involve a significant reduction in unemployment they would further reinforce the positive distributional impacts of the policy. The Effect on Employment If minimum award wages were frozen for four years, then inflation would effectively reduce the real wages (real before tax) of those who depend upon award wages safety net adjustments. The reduction would be a bit over 10 per cent (if the Reserve Bank is successful in achieving its inflation target). Assuming that award wage earners would otherwise receive real wage increases, the policy would reduce real wages of award wage earners relative to what they would otherwise receive, by greater than 10 per cent. If the effect of wages safety net adjustments would be to increase real award wages by about 1 per cent per year (increases in nominal wages of about 3.5 per cent per year), then the overall effect of the policy would be to dampen the growth of real award wages by around 14 to 15 per cent.. About 25 per cent of employees would be directly affected and about 20 per cent of the national wage bill.5 As a result, average real wages would be reduced by about 2.5 to 3 per cent relative to what they would otherwise have been (assuming no flow-on effects to other workers, and without any worker who relies on the safety net moving onto enterprise bargains). In our letter to the Prime Minister, the five economists quote the findings Debelle and Vickery (1998). In their estimate of the elasticity of labour demand, Debelle and Vickery (1998) found an elasticity of –1.0. Thus they concluded that a two per cent cut in average real wages would increase employment by about two per cent (and reduce the unemployment rate by one per cent). On this basis the policy proposal could be expected to produce an increase in employment of the order of 2.5 to 3 per cent and reduce the unemployment rate by around 1.25 to 1.5 per cent below what it would otherwise have been. 5. More details of the coverage of award wages are provided in Dawkins et al (2000) and Dawkins and Loundes (2000).. 5.
(8) A more recent estimate of the aggregate wage elasticity of labour demand (Lewis and MacDonald 2001) suggests that total hours worked has an elasticity of –0.9, and the aggregate elasticity of demand for workers was –0.8. On this basis our estimate of a reduction in the unemployment rate of around 1.25 to 1.5 per cent might be a little high. A reduction by about 1 to 1.25 per cent would be implied by the Lewis and MacDonald (2001) estimates. There are a number of caveats to the above estimates. First, since those who rely on the wages safety net have below average wages, and are of below average skill, the responsiveness of the demand for their labour to changes in their wages is likely to be above average. Hamermesh (2000) who has studied the empirics of labour demand extensively (see for example Hamermesh, 1993), has made the following observation based on a range of studies in various countries “the preponderance of evidence suggests that labour demand elasticities are substantially higher i.e. employment demands are more responsive, for a given cut in wages for low skilled workers, than for high wage workers. The evidence I think is quite clear on that. … That being the case, real wage growth cuts for low-wage workers will have a much bigger effect on total unemployment reduction than will an across-the- board slow down in real wages” (Hamermesh 2000, p.23). While there have been few studies of the elasticity of labour demand for low skilled workers in Australia such evidence that exists suggests that Australia is not an exception to this principle (e.g. Lewis 1985). This suggests that the employment effect would be larger than estimates based on the average worker. Further, if the effect of the pause were to flow on to other wages, then the effect could be further enhanced. On the other hand there is the possibility that freezing award wages would lead to some workers (who currently rely on wages safety net adjustments), receiving overaward pay or moving to enterprise bargains, thereby reducing the wage effect and dampening the employment effect. On the other hand if the demand for award wage workers increases, this could increase the number of workers on awards. (We will return to the issue of flow on effects and movements off awards later). Meanwhile let us return to the point that less skilled workers have a higher elasticity of labour demand than higher skilled workers. The Effect on the Employment of Unskilled Workers Hamermesh (2000) who is acknowledged as a leading world authority on labour demand, (see for example Hamermesh, 1993), has made the following observation “the preponderance of evidence suggests that labour demand elasticities are substantially higher i.e. employment demands are more responsive, for a given cut in wages for low skilled workers, than for high wage workers. The evidence I think is quite clear on that. That being the case, real wage growth cuts for low-wage workers will have a much bigger effect on total unemployment reduction than will an across-the- board slow down in real wages” (Hamermesh 2000, p.23).. Hamermesh was basing this statement on a range of studies in various countries. While there have been few studies of the elasticity of labour demand for low skilled workers in Australia such evidence that exists suggests that Australia is not an exception to this principle (e.g. Lewis 1985).. 6.
(9) 4. The Employment Effect of the Wage-tax Tradeoff: other Estimates that have been Produced Borland In his discussion of the five economists plan, Borland (1999a) wrote that his best guess of the effect of the proposal on the unemployment rate was that it would reduce it by 1 percentage point after a total of four years. In arriving at this best guess, he provided upper and lower bound estimates. His upper bound estimate was of a reduction in unemployment by 2.1 percentage points, resulting from a 7.2 percentage increase in employment. His lower bound estimate was of a 0.3 percentage point reduction in unemployment, resulting from a 2.1 percentage increase in employment.. These estimates were based on upper and lower bound estimates of the effect on average real wages and upper and lower bound estimates of the elasticity of labour demand for low skilled workers. Richardson Richardson (1999) in a study for the Business Council of Australia modelled a revised version of the plan on the Access Model of the Australian economy. In the modelling, it was assumed that the award wage pause was for just three years. The study found that an extra 169,000 jobs are created after a total of ten years, and the unemployment rate reduced by 1 percentage point. Two thirds of the employment effect was achieved after six years. As explained more fully in Criticism 9, the policy was also found to pay for itself in the long run because of increased tax revenue and less expenditure on unemployment benefits. Dixon and Rimmer Introduction It was noted in section 3 above that if the award wage pause were to flow on to other wages, then the employment effect could be enhanced. On the other hand there is the possibility that freezing award wages would lead to some workers (who currently rely on wages safety net adjustments), receiving over-award pay or moving to enterprise bargains, thereby reducing the wage effect and dampening the employment effect.. To understand these interactive effects it is necessary to use an integrated model of the economy. Dixon and Rimmer have modelled these interconnections using the MONASH Model. That model has two advantages over the alternatives: (i) it disaggregates the labour market into a larger number of occupations than other similar models, which allows us to use information we have on the number of workers in different occupational groups who depend upon the wages safety net; and (ii) the extent of flow-on effects to workers, and the extent to which people might cease to become dependent on the wages safety net, is made endogenous. Dixon and Rimmer have constructed two distinct scenarios to evaluate using the model. Under the first, the reduction in real wages discussed above is assumed to be permanent in its effect. The wage-tax trade-off is accepted under the system as a long run change with the tax credit seen as the appropriate compensating policy. There is thus no need for any catch-up adjustments after the three-year period of the freeze.. 7.
(10) Under the alternative scenario, the wage shock is taken to be temporary. In other words, at the end of the three-year period there is a readjustment during which previous relative wages are re-established. Scenario 1 Under Scenario 1, the policy leads to strong and sustained employment growth. After 3 years, employment is more than 2 percentage points higher than it would have been without the policy. After 6 years, it is over 3 percentage points higher, and after 10 years it is almost 4 percentage points higher than it would otherwise have been. Compared with what they would otherwise have been, real before-tax wages are lower for all groups. However, the downward effect on real after-tax wages is significantly smaller: after ten years, on average they are about 1 to 2 per cent lower than they would otherwise have been.. There are significant gains in both national income and employment. Real GDP gets a big boost. It is about 2 per cent higher after 5 years, and over 3 per cent higher after 10 years. Total employment is almost 4 percentage points higher. The largest growth in employment is amongst those who rely on wages safety net adjustments for wage increases. Employment for this group increases by about 10 per cent in three years. This simulation makes the policy look very attractive and, as Dixon and Rimmer point out, the tax credit is a small price to pay, for the very large benefits. The only people who appear to be significant losers in this policy are those workers who both currently depend upon award wage increases and who are in relatively high income families. Since the credit is means tested on family income, they do not qualify for the tax credit. Scenario 2 Under Scenario 2, while there are similar short-run gains in employment, these are not sustained. Short-run gains in GDP are also made, but again these reduce over time, although they do remain positive after 10 years.. Thus the main effect of the policy under this scenario is to bring forward in time employment and output growth and to defer some of the growth in wages that would otherwise have occurred. This could still be a very worthwhile policy particularly if it was considered that there is more likely to be under-utilised labour in the short run than in the long run. It may be a useful strategy to address the problems of the group of long-term unemployed carried over from the early nineties. Which Scenario Should We Believe? A good way of thinking about these simulations is that they provide upper and lower bound estimates of the effect of the policy. The most realistic scenario probably lies somewhere between the two.. Good reasons why there would be a good chance that permanent effects would ensue have been outlined in Dawkins et .al. (2000). A central point here is that, by using the tax credits as compensation and causing a more equitable distribution of income, any social pressures for catch up in the wages safety net, are weakened.. 8.
(11) Further, because of the unusual nature of the wages safety net in Australia, with minimum wages being much higher relative to median wages than in most other countries, it seems very unlikely that market forces would greatly offset the effects of the policy. The falls in real wages seem likely to be effective. Flow-On Effect and the Effect on the Number of Workers Relying on Awards In the Dixon and Rimmer (2001) analysis, the flow on effect to the wages of other workers (whose wages are not solely reliant on wages safety net adjustment) are made endogenous, as are the number of workers relying on awards. They find significant flow on effects because the restraint of award wage earners affects the ability of other to secure wage increases, and the number of workers relying on award wages increases. This is because the effect of the increased demand for award wage earners outweighs the supply side effect of workers wanting to move off awards onto higher wage setting processes such as enterprise bargains. Comparing the Policy with a Cut in Payroll Tax One idea that is sometimes put forward as an alternative way of reducing wage costs in order to achieve a stronger growth in employment is to cut payroll taxes.. Dixon and Rimmer (2000) find that the employment effects of such a policy would be very small compared with the effects of the wage tax trade-off. Even if cuts in payroll tax were possible without increases in other taxes, the effects would be quite small. This occurs because the cuts only cause very small effects on effective labour supply compared with the wage tax trade-off. Further analysis by Dixon and Rimmer In a subsequent paper, Dixon and Rimmer (2001) enrich their analysis by introducing a more disaggregated analysis of labour supply behaviour, and the differential tendency of the short-run and long-run unemployed to make effective offers to the labour market compared with the employed. The results suggest that an outcome somewhere between the two scenarios in their first paper, and also that the biggest impact is on the longterm unemployed. This is because the major determinant of the size of the stock of long-term unemployment is the flow of the short-term unemployed into long-term unemployment. Their modelling indicates that it is this flow on which the policy has a major impact.. 5. Discussion of Criticisms that have been made of the Proposal Introduction In this section nine criticisms of the proposal that have been confronted either in the literature or at seminars, are discussed. Criticism 1: The Elasticity of Labour Demand is too Low for the Policy to Work Nevile (2001) has criticised the proposal on a number of grounds. The main one was that the elasticity of labour demand is too low for it to be a successful policy. He noted that the Five Economists referred to the elasticity estimates of Debelle and Vickery (1998), discussed in section 3 above, and argued that this was unreasonably high. He used three arguments for this.. 9.
(12) First he referred to minimum wages studies mostly in the US, to suggest that ‘microeconomic’ studies of labour demand indicate that the elasticity of labour demand is lower than Debelle and Vickery’s estimate. As James, Wooden and Dawkins (2001) have pointed out this was based upon a mistake. The studies he was in fact referring to were minimum wage studies, which do not produce estimates of the elasticity of labour demand of the kind estimated by Debelle and Vickery’s estimate, or indeed to estimates of the wage elasticity of demand for sub-groups of workers. They provide an estimate of the responsiveness of the employment of say teenagers, or young adults to a change in the minimum wage. Inferring that these are elasticities of labour demand in the normal sense of the term is making the mistake of the ‘fallacy of the inflated denominator’. “The majority of studies focus on teenagers. Thus the dependent variable in these studies is the employment-to-population ratio for all teenagers. As most teenagers earn substantially more than the minimum wage and do not see their wages rise as a result of an increase in that wage, it is not surprising that most studies find that rises in minimum wages only have a small impact on total teenage employment. For example, in their much quoted summary of US research, Brown, Gilroy and Kohen (1982, p. 524) concluded that: ‘Time series studies typically find that a 10 per cent increase in the minimum wage reduces teenage employment by one to three percent.’ This however, does not mean that the demand for teenage labour has an elasticity of between just –0.1 and –0.3. These results refer to the impact of a 10 per cent increase in the minimum wage on total teenage employment including employees whose wages are not affected by increases in the minimum wage. Thus, an explanation for the small estimated employment impact from minimum wage increases lies in what Brown (1988, p. 144) has labelled the ‘fallacy of the inflated denominator’: ‘Part of this small effect is due to the fallacy of the inflated denominator: with incomplete coverage and the fact that most workers in nearly any demographic group earn more than the minimum wage, the effect on any such group’s employment will be smaller (in proportional terms) than it would be if impacts on those directly affected could be isolated.’ This point has been made even more forcefully by Neumark and Wascher (1997, p. 4): ‘The logic underlying the conclusion that minimum wages substantially redistribute income towards low-wage workers – based on existing estimates of the employment effects of minimum wages – is flawed for two reasons. First, the – 0.1 to –0.2 elasticities used to reach this conclusion are taken from studies of the employment effects of minimum wages for entire age groups and are not equivalent to – as some have asserted – the elasticity of demand for minimum wage workers [emphasis added]. An estimate of the effect of a minimum wage increase on total employment in any particular age group is really the effect on the low-wage individuals in the group for whom the new minimum wage raises wages, averaged over all workers in this age category; as high-wage workers are for the most part unaffected by changes in the minimum wage, the aggregate elasticity will understate the employment effect on low-wage workers.’ Similar points have been made by Gramlich (1976, pp. 430-431) and, more recently, by Addison and Blackburn (1999, p. 394).”. 10.
(13) Unfortunately, when reporting results from minimum wage studies many commentators, including Nevile fail to grasp this point.” (James, Wooden and Dawkins, 2001). In fact, (as discussed in section 3), a careful review of microeconomic studies of the elasticity of labour demand, such as that conducted by Hamermesh (1993), reveals that the elasticity of demand for workers of lower skill, who are likely to be disproportionately affected by the proposal is actually higher than the elasticity of labour demand for higher skilled workers. In other words closer examination of the evidence on labour demand for low-skilled workers suggest that the five economists may have under-played the size of the employment effect of the proposal. The second basis on which Neville concluded that Debelle and Vickery’s estimate of the elasticity of labour demand was too high was the idea that hours of work may be more responsive to real wage reductions than numbers of persons. We noted earlier that Lewis (2001) has provided some evidence that there may be some substance in this. His estimates were of an elasticity of demand for hours of –0.9 (very close to Debelle and Vickery’s –1.0), but a slightly lower elasticity of demand for persons of –0.8. It has already been noted above that using Lewis’ estimate of –0.8 produces a slightly smaller employment effect of the policy. It is worth repeating however, that this is an aggregate elasticity and evidence on the elasticity of demand for low skilled workers suggests that the policy can be expected to produce a larger employment effect than might be predicted simply by using the aggregate elasticity. The third basis on which Nevile criticised Debelle and Vickery (1998) concerned their estimate of the output effect of a reduction in real wages. In this regard Lewis (2001) study is again useful. Lewis and MacDonald (2001) concludes from his analysis that ‘overall wage moderation would have a significant impact on employment growth’, but ‘most of this comes from the effects of wage restraint on output’. Of the –0.8 estimate of the wage elasticity of labour demand -0.6 is the estimated output effect, with lower labour costs encouraging output expansion. Criticism 2: International Evidence on Minimum Wages Suggests that an Increase in Minimum Wages has a very Small Effect on Employment Belchamber (1999) has made this criticism, referring particularly to the studies of Card and Krueger (see for example Card and Krueger 1994, 1995).. “The relevant evidence in this context deals specifically with minimum wages and employment; wage/employment elasticities for the economy as a whole conceal more than they reveal about minimum wages and employment. Card and Krueger, among others, report no significant relationship between minimum wages and employment in a wide range of studies using North American data.” (Belchamber, 1999, p.19) First, it should be added that in a review of minimum wages studies from various countries, in the Joint Government’s submission to the Safety Net Review (2000-2001), 12 out of 17 US studies since 1990, and 17 out of 23 studies from other countries, find a statistically significant negative relationship between minimum wages and employment. Secondly, Belchamber’s criticism of the five economists proposal is subject to similar problems to the Neville argument which was based upon minimum wage studies.. 11.
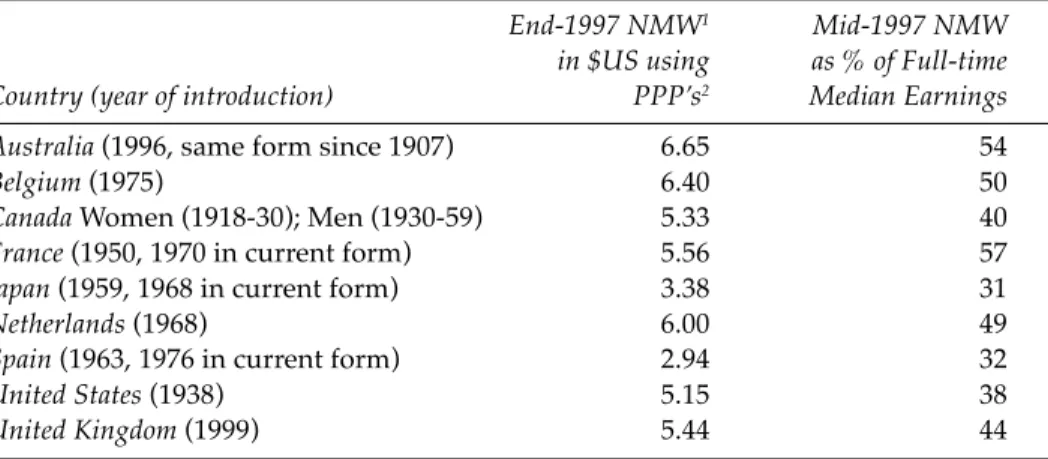
(14) Hamermesh’s comments on this at a conference in 1999 (BCA (1999) are a good summary. “Changes to the minimum wage have two avenues of effect on labour demand. First there is the demand elasticity, but more important is how many people are affected by it. We can double the minimum wage but it is not going to make any difference whatsoever because there is nobody or hardly anybody, down there in the US at that level. In the US, minimum wage cuts affect many fewer people, relatively than do minimum award wages in Australia. A large number of empirical studies for the US, Britain, Germany look at wage elasticities by skill category. The preponderance of them suggest the evidence I indicated, namely that these elasticities are larger at the lower end of the skill distribution. I do not think that minimum wage studies are relevant for this”. (BCA 1999, p.24) In the US the minimum wage is much lower relative to median earnings than in Australia, and many fewer workers are paid the minimum wage. Table 1 presents evidence from Metcalf (1999) on the real value of the national minimum wage in each of nine countries, (including the UK and Australia) and its value relative to full-time median earnings. This shows that Australia, is at the high end of the distribution as far as minimum wages are concerned. Table 2 Summary of Minimum Wage Systems in Selected OECD Countries with a National Minimum. Country (year of introduction) Australia (1996, same form since 1907) Belgium (1975) Canada Women (1918-30); Men (1930-59) France (1950, 1970 in current form) Japan (1959, 1968 in current form) Netherlands (1968) Spain (1963, 1976 in current form) United States (1938) United Kingdom (1999). End-1997 NMW1 in $US using PPP’s2. Mid-1997 NMW as % of Full-time Median Earnings. 6.65 6.40 5.33 5.56 3.38 6.00 2.94 5.15 5.44. 54 50 40 57 31 49 32 38 44. 1 National minimum wage, 2 Purchasing power parity Source: Reproduced from Metcalf (1999). When it is added that the federal minimum wage is only the bottom rung of a whole structure of minimum wages in Australia, this provides further reason to become nervous about the effect of raising them significantly, especially armed with the knowledge that international evidence suggests that the elasticity of demand for low skilled labour tends to be higher than for others. Meltcalf was a member of the Low Pay Commission in the UK which was asked by the Blair government to recommend the level at which the UK minimum wage should be set. The Commission undertook extensive research as well as consultation. They concluded that “the National Minimum Wage should be introduced at a rate which offers real benefits to the low paid, while avoiding unnecessary risks to businesses and. 12.
(15) jobs”, and advised that the appropriate rate for the National Minimum Wage should be 3.70 per hour in June 2000 along with an initial Development Rate of 3.20 per hour (for 18 to 20 year olds) and accredited trainees over 21 for a limited period of time. (Low Pay Commission, 1998 p.5) The Low Pay Commission was very keen to avoid setting the minimum wage too high, in order to avoid serious adverse employment effects. Metcalf has subsequently written a journal article on the subject of minimum wage setting. Metcalf (1999), pointed out that his reading of the international research evidence is that modest increases in minimum wages, when they are at very low levels, do not tend to have adverse effects on employment, (and may sometimes have positive effects). However, at higher levels increases in minimum wages can be expected to have significant adverse effects on employment. It is particularly noticeable, that all of the studies of minimum wages in France (the only country in table 1 with the minimum wage higher than in Australia), reviewed in the Joint Government’s submission to the Safety Net Review (2000-2001), a significant negative relationship between minimum wages and employment was found. Criticism 3: Those on Award Wages would move onto Enterprise Bargains and get Wage Increases Anyway The plan is based upon the idea that a substantial proportion of workers on the wage safety net, rely fundamentally on increases in award wages to get increases in their pay. If that is not the case then the policy cannot be expected to work in the intended way. Put another way, if workers who currently receive wage increases due to safety net adjustment would get the wage increases anyway, through over-award increases or movement onto enterprise bargains, then the policy would not restrain the growth in real wages.. What clues can we find to help us judge whether wages safety net increases are required to deliver wage increases to these workers? 1. The ACTU and the Industrial Relations Commission, appear to believe strongly that such increases in awards are necessary to deliver wage increases to these workers. 2. The evidence presented in Table 2 above, demonstrates that the Federal minimum wage in Australia is very high by international standards, both in terms of it real value, and also as a proportion of median earnings. This gives credence to the view that if the minimum wage were withdrawn, many of the workers who receive the minimum wage, would be unlikely to have a strong enough position in the labour market to be able to bargain for wage increases. Indeed some may even face wage cuts. 3. This is consistent with the long-standing body of evidence that compared with other countries the distribution of earnings in Australia is somewhat compressed at the bottom end of the earnings distribution. (For a review of this evidence see Norris, 1993). 4. International evidence suggests that there are strong market forces at play which are tending to give rise to a widening earnings distribution. This is thought to result mainly from skilled biased technological change increasing the demand for skilled workers, and possibly to a lesser extent from globalisation and the disintegration of production across countries. This has resulted in a widening. 13.
(16) distribution of earnings in most OECD countries. This widening distribution can have three components: • Changes in the composition of employment in favour of high wage workers • Widening of intra-occupational wage differentials • Widening of inter-occupational wage differentials Evidence of the first two of these is available for Australia (see for example Norris and McClean (1999) and Borland (1999), but not the third. The lack of evidence of widening inter-occupational wage differentials, along with the lack of evidence of employment growth among low-skilled workers, and that the distribution of earnings has not widened as much in Australia as some other countries such as the UK and the US provides further reason to believe that if wage safety net adjustments were not made, most workers who currently depend upon such adjustments, would unlikely to get wage increases. Further, if the demand for award wage workers increased significantly, this could even lead to an increase in the number of workers covered by awards. In Dixon and Rimmer (2001) general equilibrium analysis of the economy is used in which the number of award workers is endogenous to the model, and their simulation of the plan actually produced an increase in the number of workers on awards. In assessing the employment effects of the policy it is important to consider any possible flow-on effect of the award wages freeze, to other workers. While a Federal Government survey found that 22 per cent of workers were found to rely solely on award wage increases, the majority of other workers had wages that were underpinned by awards. Such workers are either covered by enterprise agreements underpinned by awards or receive over-award payments. With some of these workers there is a direct flow-on of wages safety net adjustments (Joint Governments Submission, 2000 Ch. 5). With most of them however, any such flowon effect would be indirect. For example if the demand for award wage workers increased due to their reduction in relative pay, this would tend to reduce the demand for workers on enterprise agreements, and lead to a consequent downward effect on wages under enterprise agreements. Again this effect is endogenous to the general equilibrium modelling of Dixon and Rimmer and is found to be important. This leads to greater wage restraint than that estimated in section on ‘The Effect on Employment’ above. Criticism 4: Earned Income Tax Credits will have Negative Effects on the Labour Supply of Second Earners in Households This critique of the five economists is associated with Patricia Apps (2001). Indeed Apps argues that the five economists proposal would reduce aggregate labour supply, increase the tax burden on two earner families and have a negative effect on aggregate output.. However, Apps (2001) analysis of earned income tax credits does not consider the specifics of the five economists plan, especially the wage-tax trade-off. Further, her empirical analysis of the likely effects of tax credits is based upon the tax credit proposal put forward by the ALP in the 1998 federal election. This was a quite different proposal from the five economists’ proposal. Secondly she added to that ALP proposal a cut in the top marginal rate of income tax, suggesting that this represented the five economists. 14.
(17) plan. A combination of the ALP proposal and a cut in the marginal rate of income tax is in fact a very bad representation of the five economists’ proposal. The best representations of the five economists earned income tax credit proposal can be found in Keating and Lambert (1998) and Lambert (2000), an extract of the latter being include in Appendix 1. The misunderstanding about the top marginal rate of income tax appears to have arisen from Apps reading an article in the Australian Financial Review by one of the five economists, Garnaut (1999). In that article Garnaut argued that the long run agenda should be to implement a negative income tax (along the lines of a basic income flat tax proposal). In this proposal he argues that the aim over a ten year period should be for the flat tax rate to be lower than the current top marginal rate.6 The main aims of the proposed tax reform of the five economists plan are two fold: (i) to improve the living standard of low wage earners in low income families more than is possible through adjustments to minimum award wages; (ii) as a result to allow a lower growth in wage costs to stimulate employment through labour demand effects; (iii)to improve work incentives for low wage earners low income families. International studies of earned income tax credits suggest that they can have positive effects on the labour supply of some (especially sole parents) but also some other single and married workers, but can also have a negative effect on the labour supply of some second earners (see e.g., Eissa and Hoynes 1999, Eissa and Liebman 1996 Scholz 1996, for US evidence and Duncan and McCrae 1999, Blundell et. al. 2000). It has to be added that the way that the tax credit is implemented is important in determining the magnitude of these effects. Considerable care has been taken to ensure that the five economists proposed tax credit is well integrated with Family Tax Benefit Part A, so as not to cause very high effective marginal tax rates for low income families with children. However the presence and size of these is an empirical issue. One way of estimating the likely magnitude of these effects is to model the earned income tax credit in a behavioural micro-simulation model of the tax-transfer system such as the Melbourne Institute Tax and Transfer Simulator (MITTS). Such a study is underway and preliminary findings are that there would be sizable positive labour supply effects for lone parents and some relative small positive and negative effects for other households, with the negative effects primarily for second earners.7 On balance, previous evidence (which looks like being confirmed by the MITTS analysis of the Lambert proposal) suggests that the positive labour supply effects of earned income tax credits outweigh the negative ones, but that the magnitude of these effects are not very large. Indeed compared with the labour demand effects of the wage-tax trade-off, the supply side effects are likely to be relatively small. Thus the main issue in analysing the five economists plan is to assess the demand side effects of the wage restraint, which has already been covered.. 6 This is not to deny that Ross Garnaut’s long-term vision of the tax-transfer system (see Garnaut 1998) or a modified version of is very worthy of consideration, but that vision is not well represented by the Apps paper. 7 Detailed findings of this analysis will be presented in a forthcoming Melbourne Institute Working paper.. 15.
(18) Criticism 5: The Policy will have very little Effect on Jobless Families as most of the Jobs would go to Second Earners One comment that has been encountered is that since most new jobs have tended to be part time jobs going into households that already have at least one job, then extra jobs created will also tend to go to second earners. This however is direct contrast to the point made in Criticism 4 above that if anything the policy may create some disincentives for second earners. It is hard to se how both these criticisms could hold simultaneously. Criticism 6: The Policy will have very little Effect on Long-Term Unemployment One argument that has been confronted in seminars is that a modest reduction in minimum wages will not reduce labour costs enough to induce employers to hire many long-term unemployed. Larger wage cuts would be needed. Therefore, the argument goes, our proposal would not make a significant dent in the amount of long-term unemployment.. In their recent paper Dixon and Rimmer (2001) specifically address this issue. What they find is that the major effect of the policy is to reduce long-term unemployment. This is because the major determinant of the size of the stock of long-term unemployment is the flow of the short-term unemployed into long-term unemployment. Their modelling concludes that it is this flow on which the policy has a major impact. Nevertheless, specific policies should accompany the wage tax trade-off, to address the needs of those already in long-term unemployment. This is where labour market programs (one of the other features of the five economists plan) become very important. Criticism 8: The Policy will Increase Inequality The effect on income distribution was discussed in section on “The Tax Credit Proposal” above. It was found that even without the employment effects, the policy redistributed income away from the top three income deciles to deciles 2 to 7. If the effect on unemployment discussed in this paper, were included in the distributional analysis it would further reduce inequality.. There are of course winners and losers. Nevile (2001) expresses concern for the losers, the most obvious of which are low wage earners in high-income families who would have been employed anyway. It has to be conceded that it would be very hard to substantially reduce unemployment without some losers, and the fact that they tend to be in high-income families could be seen as an advantage for this policy. Criticism 9: The Budgetary Cost of the Policy is too High and the same Level of Expenditure could be used more Efficiently to Reduce Unemployment using other Methods Lambert’s costing of the tax credit outlined in the section on ‘The Tax Credit Proposal’ above suggests that it would cost about $1 billion in the first year, $2 billion in the second year and $3 billion in the third year, assuming no effect on employment. To this has to be added the effect on income tax receipts of lower real wages than would otherwise have been received, estimated by Lambert to be about $1.4 billion in lower tax receipts after three years.. 16.
(19) However, this is subject to ‘claw-back’ due to the output and employment effects of the policy. The two studies that have modelled the effects on output and employment and in turn on the government’s budget (Richardson 1999 and Dixon and Rimmer 2000) found that the policy pays for itself in the long run because of the effect on output and employment and, in turn, on tax receipts and unemployment benefits. In their simulations Dixon and Rimmer do not allow the policy to cause the ratio of the public sector deficit to GDP to deviate from its base vase scenario. They do this by allowing a uniform shift in the income tax rate applying to labour and capital income. In the absence of tax-generating changes in activity, the tax credits of $3billion would be paid for by an increase in income tax rates of 0.6 percentage points. However, in the simulations the policy produces a considerable increase in tax generating activity, more than sufficient to pay for the tax credits without increases in tax rates. To quote Dixon and Rimmer (2000), “$3 billion of annual tax credits buys an increase in economic activity which delivers extra tax revenues well in excess of $3 billion. This is in tension with earlier analyses of wage-tax bargains. For example, Corden and Dixon (1980) found that a wagetax bargain for Australia which had a significant effect on employment would involve a substantial move towards deficit in the government accounts. In the Corden-Dixon analysis the tax credits (or tax cuts) applied to the entire workforce and were sufficient to ensure that no worker suffered a cut in his or her real aftertax wage rate.” Dixon and Rimmer (2000) In the five economists wage tax trade-off, the wage restraint is delivered in a more cost effective way, with the tax credits going just to low-wage earners in low income families. Richardson’s analysis produces similar findings. “Based upon comments in his recently published letter to the Prime Minister, it seems Employment Minister, Peter Reith has reservations about the costeffectiveness of tax credits. However, modelling using the Access Economics Model revealed that, contrary to those concerns, tax credits would not place a heavy burden on the budget. The extra growth in jobs would add to tax collections, as well as saving on unemployment benefits and labour market programs. At the same time lower inflation would save the Government money (because much spending is indexed to prices and wages, such as the pension). In fact, Access modelling commissioned for this conference estimates that, 10 years down the track, the policy package would be boosting the federal budget bottom line, rather than drawing on it.” (Richardson, 1999, p45) Dixon and Rimmer (2000) went further in their analysis of the cost effectiveness of the policy, by comparing it with an equivalent expenditure on cutting payroll tax. Using the Monash model they analyse a cut in payroll tax in two circumstances. In one there is a compensating tax increase (either consumption tax or income tax) in the other it is uncompensated. In the former case there is a negligible effect on employment. In the latter employment is found to increase by about 0.5 per cent.. 17.
(20) Another possible use of the budget that we propose should be devoted to tax cuts could be on labour market programs. Dockery and Webster (2001) have written a good paper on this topic for the present conference. The preponderance of evidence appears to be that labour market programs (whether they be wage subsidies, employment creation, training programs or work experience), cannot be expected to significantly reduce the aggregate unemployment rate. Rather, they can be used to enhance the employment prospects of one group relative to another. It is for this reason that they have been increasingly focussed on disadvantaged job seekers. Thus using the same expenditure on labour market programs for the long-term unemployed might improve the prospects of employment of the current long-term unemployed, but would do little to reduce the likelihood that the amount of long term unemployment would be reduced significantly, because this is substantially determined by the flow of short-term unemployed into long-term unemployment. As noted in Criticism 6, Dixon and Rimmer (2001) have found that the five economists’ wage-tax trade-off proposal has its biggest impact on the stock of long-term unemployment, because of its effect on the flow of short-term unemployed into long-term unemployment. This leads to the idea that the wage-tax trade off, which could make a substantial dent in the aggregate unemployment rate and the rate of long-term unemployment, might be complemented with further investment in labour market programs to assist those who are currently long-term unemployed. Figures provided by Beth Webster suggest that if $1 billion was spent on labour market programs, with half the participants in wage subsidies and half the participants in job creation programs of the type implemented under Working Nation, this could provide for about 67,000 participants in each type of program, (with about two thirds of the cost going on job creation programs). Of the about 134,000 participants some 12,000 would retain jobs after the program ended with many displacing those who would otherwise have held jobs. The number retaining jobs could be increased if a larger proportion of the funding went on wage subsidies, but the job creation programs have more beneficial effects for the more seriously disadvantaged. Equally, Webster has pointed out that this spending could be allocated to increasing government spending on say education or health. Thus $1billion spent on health or education services could generate about 23,000 jobs. Thus $3 billion would create about 69,000 jobs. But of course the $3 billion has to be found from somewhere, which could lead to a compensating reduction in employment of a similar order of magnitude, depending upon how it was financed. Further if it were financed by tax increases this could lead to increased wage demands to maintain real before tax wages. To make a direct comparison on using labour market programs, or increasing spending on education and health, with the wage-tax trade-off we would need to simulate these alternative policies on a model like the Access Economic Model or the Monash Model, imposing some comparable budgetary rules to those used in evaluating the wage-tax trade off. However, it seems that the displacement effects of such policies would not make them as attractive as the wage tax-trade-off as a policy to reduce aggregate unemployment, but there may be some distributional reasons for pursuing such policies to some extent.. 18.
(21) The secret of the cost effectiveness of the wage tax trade-off appears to be that it reduces labour costs substantially without the full reduction in labour costs having to be funded out of the government’s budget. This in turn produces a stimulus to output and employment that generates additional tax revenue that pays for the cost of the policy. While many workers end up with slightly lower after tax real wages than they would have without the policy, (especially those in higher income households who do not receive the tax credits) there are many more people earning wages and real incomes per capita are boosted. This would be accompanied by a redistribution of income away from the top three deciles of the income distribution towards those in the second to seventh income deciles. Criticism 10: The Institutional Structures would not Support such a Policy If the Government were attracted by this or similar propositions it is not clear that the institutional framework exists for it to pursue such a policy. Isaac (1999) has argued, for example, that it may not be consistent with the Workplace Relations Act for the Australian Industrial Relations Commission to allow award wages to fall too much behind wages in enterprise bargains. One option would be for the Act to be amended to allow this to happen.. However, it is arguable that the kind of analysis and assessment of the economic and social effect of changes to minimum wages and to taxes and transfers, that is undertaken by the Low Pay Commission is the UK, is what is needed in the relevant wage setting institution and this is probably outside of the area of expertise of the Industrial Relations Commission whose membership does not include the kind of labour market research experts that are in the Low Pay Commission. The expertise in the Industrial Relations Commission is much more in the field of industrial relations law, arbitration and conciliation than in labour economics. Also, the adversarial nature of the proceedings of the Industrial Relations Commission is not really suited to the kind of extensive deliberations and analytical approach of the Low Pay Commission, who set about answering specific questions put to it by the Government, and involved employer representatives, employee representatives and academics in the process. The use of experts and the consensus approach appears to be more suited to the task. Furthermore, as various options for reforming the income support system are canvassed and analysed, their interaction with the minimum wage system needs to be considered as recommended by the McClure Report (Reference Group on Welfare Reform, 2000). There may also be implications for the operation of the wage system of such reforms. In other words it is becoming increasingly clear that the setting of award wages and the setting of taxes and transfers should be looked at together and our current institutional structure does not encourage this. Perhaps the establishment of an agency similar in scope and purpose to that of the Low Pay Commission might make this more possible.. 6. Conclusion In 1998 the Five Economists letter to the Prime Minister stimulated a lot of discussion and debate, which is still ongoing. The Federal Government and the Opposition have taken a considerable interest in the ideas put forward. Further, the Business Council of Australia has endorsed the basic ideas its ‘New Directions’ paper on Rebuilding the Safety Net. There has also been a developing literature on the five economists plan in academia.. 19.
(22) This paper has focussed on the most controversial and debated part of the letter, the use of earned income tax credits in a wage tax trade-off. A range of estimates of the likely employment effect of the wage restraint involved have been produced and the factors that might lead to higher or lower estimates discussed. It has been argued that the weight of evidence is in favour of this policy as an efficient generator of jobs to reduce unemployment and joblessness. The distributional and labour supply effects of the tax credit have been discussed. It has been argued that the ‘beneficial’ distributional effect on low wage earners in low-income families is the central purpose of the policy (as a superior equity device to raising minimum award wages), but that it is likely to have some beneficial labour supply effects on jobless households. It is conceded that there would also be some labour supply reductions, especially in two earner families, but that these effects are likely to be small. The dominant labour market effect of the policy, would be the effect of the reduced growth in labour costs on labour demand, partly through substitution effects and partly through output effects, which would also result in higher economic growth. A range of criticisms that have been made of the proposal have been examined. It is argued that having given due consideration to these criticisms, the plan remains robust. Reasons have been outlined why much of the criticism lacks substance. The major challenge for the policy idea, which has been put forward as a criticism, is that it may be difficult to persuade a government to implement it and that our labour market institutions may not be very conducive to the implementation of the proposal. Given the force of the ideas, however, and the continuing severity of the problem if unemployment and jobless families despite a decade of substantial economic growth, it is a policy that a government still might pull out of its bottom draw sometime over the next few years. Even if it is not implemented in the precise form proposed, there is a growing realisation that rises in minimum award wages are not a good device for helping low income families and that alternative approaches may be necessary. If alternative approaches are adopted this should take the pressure off the award wages safety net and make it easier to implement the kind of reforms to the wage setting system supported in the recent OECD report on Australian labour market policy (OECD, 2001). This in turn should make it easier for us to get unemployment and joblessness down while still addressing the wellbeing of low wage earners in low income families, through the tax-transfer system.. Appendix 1 The Lambert Earned Income Tax Credit Proposal (Adapted from Lambert 2000) A. Family Assistance under ANTS The general outcomes from the family assistance reforms contained in the ANTS policy were:. • an increase in maximum payment levels • a simplification of the types of family assistance and their income tests • a relaxation of the targeting of family assistance to both lower and higher income families as well as single earner families.. 20.
(23) The government achieved these outcomes through the introduction of FTB Parts A and B, with more generous income tests (higher thresholds and lower withdrawal rates) than the payments they replaced. FTB Part A is family assistance for those single and dual earner families and cash transfer families who have dependent children. It replaces: • family allowance • minimum family allowance • family tax assistance/payment Part A. FTB Part A has four rates of assistance – a maximum benefit for FTB children aged 0-12 years of $3,029.50 per annum8, a maximum benefit for FTB children aged 13–15 years of $3,839.80 per annum, a minimum benefit of $974.55 for FTB children aged 0-17 years, and a minimum benefit of $1,306.50 for FTB children aged 18-24 years. FTB Part A recipients may also be eligible for rent assistance. There is also a large family supplement of $208.52 for fourth and subsequent children. There are two income tests for FTB Part A. The tighter of the two tests applies to maximum FTB A (including any rent assistance) and has an income test threshold of $28,200 and a taper of 30%. The other test applies to minimum FTB A (including any large family supplement) and has an income test threshold of $73,000 and a taper of 30 per cent. The threshold is increased by $3,000 for each FTB child other than the first. If a family is over the higher threshold, then their FTB entitlement is determined by the higher income test. If it is below the higher threshold then the tighter income test is applied but entitlement cannot fall below minimum FTB A. FTB Part B is family assistance for single earner families with dependent children and replaces: • • • • •. dependent spouse rebate basic parenting payment family tax payment/assistance part B sole parent rebate guardian allowance. FTB Part B has two rates - $2,602.45 per annum if there is a FTB child under 5 years and $1,814.05 per annum if there is only a FTB child aged 5 to 18 years. The income test threshold is $1,616 per annum with a taper of 30 per cent. There is no income test on the primary earner. The FTB income tests are applied to current adjusted family taxable income, defined as the sum of : • • • • •. taxable income adjusted fringe benefits target foreign income net rental property losses tax free pension or benefit. 8 The payment rates and income test thresholds given in this appendix were those published on the Centrelink website at the time the New Tax System was introduced i.e. 1/7/2000.. 21.
(24) less deductible child maintenance expenditure for the year. FTB Parts A and B are reconciled at the end of each financial year (in a similar way to income tax ) and appropriate adjustments are made. B. Earnings Credit and FTB Part A The Earnings Credit The earnings credit was assigned a maximum value of $30 per week in 2000. This credit grew from the first dollar of wage and salary income to the maximum at $28,200 (the threshold of the lower income test for FTB Part A as of 1 July 2000) an accumulation rate of 30 * 52 / 28,200 = 5.5%. While accumulated on an individual basis the earnings credit was income tested on an income unit basis consistent with the income testing of family assistance.. Eligibility for the earnings credit was based solely on the receipt of wage and salary income by an individual. The linking of the earnings credit to FTB Part A means that it is more tightly tested (on an income unit basis) for those without dependent children who are not eligible for family assistance. There is therefore an element of horizontal equity in this approach. The earnings credit is incorporated into FTB Part A in a simple manner. The first step is to calculate the gross earnings credit (GEC) of all those in the income unit with wage and salary income – the GEC for each is simply the product of wage and salary income and the accumulation rate, with a cap set at the maximum rate of earnings credit. These GEC are all summed to give total gross earnings credit (TGEC). Any GEC for other single income units considered dependent on the parental income is also added to TGEC. TGEC is then added to any FTB Part A gross entitlement that the income unit has. The tighter of the two FTB Part A income tests is then applied. Thus the threshold at July 2000 is $28,200 per annum. The withdrawal rate is 30 per cent. The income test is based on adjusted taxable income of the reference person (and spouse if there is one). In the case of single income units and married couples without dependants there would be no entitlement to any FTB Part A so the TGEC will be reduced as soon as adjusted taxable income exceeds the income test free area. In the case of those with dependent children who are eligible for FTB Part A, TGEC will not be reduced until all FTB Part A above the base rate (or minimum) has been reduced to zero – the tighter income test cannot reduce FTB Part A below the minimum. This means that the larger the family, or the older the children (higher rates of FTB Part A are paid for children 13 to 15), or if an income unit is eligible for rent assistance, the higher will be the level of income at which the TGEC starts to reduce. To give an example using payment rates as of July 2000 – if a family has 2 dependent children aged 9 and 13, then their gross maximum FTB Part A entitlement is $6,869.30 and their minimum is $1,949.10. The point at which their TGEC begins to reduce is: Income test threshold + (max FTB A – min FTB A ) / withdrawal rate $28,200 + ($6,869.30 – $1,949.10) / 0.3 = $44,600.67 If their combined wage and salary income was $50,000 then the TGEC would be $50,000 * .05 = $2,7509 The cut-out point10 for this level of earnings credit would be $44,600.67+ $2,750 / 0.3 = $53,767.34 9. This assumes neither had wage and salary income above $31,150. The level of adjusted taxable income at which all entitlement to earnings credit ceases.. 10. 22.
(25) Assuming their adjusted taxable income was $50,000 their net earnings credit entitlement would be: $2,750 – ($50,000 – $44,600.67) * 0.3 = $1130.20 per annum (around $22 a week) Those with an earnings credit entitlement could receive it in the same way as FTB i.e. either as a cash transfer or as a reduction in income tax. As with FTB, a reconciliation with the financial year outcome for adjusted taxable income could be done at the end of each financial year, with a refund or liability issued as appropriate. Also, those who are on pension or allowance do not have an income test applied to FTB – the same would apply to TGEC.. Appendix 2 The Effect of the Tax Credit on the Hours/Income Trade-Off: Some Hypothetical Examples. The following graphs are produced by the Melbourne Institute Tax and Transfer Simulator and represent the effect of a tax credit like that outlined in Appendix 1. The accumulation rate for the tax credit is 5.5 per cent and its is capped at $30 a week Figure 1 shows the ‘head of household’s income schedule with a spouse not working and a wage of $25 per hour. Figure 3, is for similar household but with a wage of $11 an hour. The corresponding effective marginal tax rate schedules are shown in figures 2 and 4 For the $25 an hour worker, earnings are boosted by the tax credit right up to about 39 hours of work, and effective marginal tax rates are lower up until 22 hours a week, then they are the same, and then they are higher over the range of 34 hours to 39 hours while the tax credit is still being withdrawn, in an income range in which the more than minimum rate of Family Tax Benefit Part A would already have been withdrawn before the tax credit was introduced. Figure 3 shows that for a minimum wage worker whose earning are boosted over the whole range of hours observed in the figure, and effective marginal tax rates are lower right up to about 49 hours a week and will be the same for a few hours after that, before they become higher. Figure 5 is for a working spouse of an $11 an hour full-time worker, whose hours are assumed to be invariant. The tax credit would boost their earning potential over their entire hours range, but increase their effective marginal tax rate above around 37 hours a week, (Figure 6). Net Incomes and Effective Marginal Tax Rates (EMTR’s) for couple with 2 dependents, 1 aged 9 years, 1 aged 13 years – no rent assistance.. 23.
(26) Figure A1 Income Schedule of Reference Person in Household: Gross Wage of $25 an hour, Spouse not Working. Figure A2. Figure A3 Income Schedule of Reference Person in Household: Gross Wage of $11 an Hour, Spouse Not Working. 24.
(27) Figure A4. Figure A5 Spouse’s Income Schedule: Gross Wage $11 an hour, Head of Household Working 40 hours with Gross Wage of $11 an hour. Figure A6. 25.
(28) Appendix 3 Assumptions of Scenarios in Table 1. This scenario models a wages outcome with no flow-on effect from award increases and no change in award coverage. The sub-scenarios (on an annual basis) are: 1.1 1.2 1.3 1.4 1.5 1.6 1.7 1.9 1.10 1.11. no award increase, 3.5% increase in other wages no award increase, 4.5% increase in other wages 2.5% increase in award, 3.5% in other wages 2.5% increase in award, 4.5% in other wages 3.5% increase in award, 3.5% in other wages 3.5% increase in award, 4.5% in other wages absolute award increase ª 4% of minimum, 3.5% in other wages absolute award increase ª 4% of minimum, 4.5% in other wages absolute award increase ª 5% of minimum, 3.5% in other wages absolute award increase ª 5% of minimum, 4.5% in other wages.. Sub-scenarios 1.1 and 1.2 also modelled the tax credit described above and in more detail in Lambert (2000).. References Apps, P. (2001), ‘Why an Earned Income Tax Credit Program is a Mistake for Australia’, Centre for Economic Policy Research Discussion Paper No. 431. Blundell, R., Duncan, A., McCrae, J. and Meghir, C. (2000), ‘The Labour Market Impact of the Working Families’ Tax Credit’, Fiscal Studies, 21, 75-100 Business Council of Australia (1999), ‘Rebuilding the Safety Net’, New Directions Business Council of Australia Discussion Paper No. 1. Business Council of Australia (2000), Rebuilding the Safety Net: Proceedings of a Conference, 29 April 1999. Belchamber, G. (1999), ‘Will Lowering Wages Reduce Unemployment?’, CEDA Bulletin, July, 16-19. Borland (1999a), ‘Will Lowering Wages Reduce Unemployment?’, CEDA Bulletin, July, 16-18. Borland, J. (1999b), ‘Earnings Inequality in Australia: Changes, Causes and Consequences’, Economic Record, 75, 177-202. Brown (1988), ‘Minimum Wage Laws; Are They Overrated?’, Journal of Economic Perspectives, Summer, No.3, 133-145. Brown, C., Gilroy, C. and Kohen A. (1982), ‘The Effect of the Minimum Wage on Employment and Unemployment’, Journal of Economic Literature, June, XX, 487528. Card, D. and Krueger, A. (1994), ‘Minimum Wages and Employment: A case study of the fast-food industry in New Jersey and Pennsylvania’, American Economic Review, 84, 772-93. Card, D. and Krueger, A. (1995), Myth and Measurement: The New Economics of the Minimum Wage, Princeton University Press, Princeton. Dawkins, P. (1999), ‘A Plan to Cut Unemployment in Australia: An Elaboration on the ‘Five Economists’ Letter to the Prime Minister, 28th October 1998’, MercerMelbourne Quarterly Bulletin of Economic Trends, 1, 48-57.. 26.
Figure


+2

Related documents
An analysis of the economic contribution of the software industry examined the effect of software activity on the Lebanese economy by measuring it in terms of output and value
The purpose of this study was to evaluate the diagnostic utility of real-time elastography (RTE) in differentiat- ing between reactive and metastatic cervical lymph nodes (LN)
assumptions, formulas, etc. so that a reviewer could replicate the calculations based on the data provided. All assumptions and estimates must be clearly identified. As noted in
ephemera joins the discussion on critical organization studies in a field of engagement already drawn out by AOM, APROS, BAM, CMS, EGOS, SCOS, Organization, Organization Studies,
National Conference on Technical Vocational Education, Training and Skills Development: A Roadmap for Empowerment (Dec. 2008): Ministry of Human Resource Development, Department
Sublinear-time and sublinear-space algorithms; Error-correcting codes and lattices; Computational complexity; Learning
Second , ‘hybrid’ constellations of private sector lobbyists and public agencies – such as Paris Europlace and Frankfurt Main Finance – seek to d eploy Brexit as a
Seed production and recruitment of the different kind of forests (primary forests and harvested stands) are related to regional climate factors and their variations can be
