UCLA
UCLA Electronic Theses and Dissertations
Title
Essays on Economic Development
Permalink https://escholarship.org/uc/item/3jm2c83n Author wu, nan Publication Date 2020 Peer reviewed|Thesis/dissertation
UNIVERSITY OF CALIFORNIA Los Angeles
Essays on Economic Development
A dissertation submitted in partial satisfaction of the requirements for the degree Doctor of Philosophy in Economics
by
Nan Wu
c
Copyright by Nan Wu
ABSTRACT OF THE DISSERTATION
Essays on Economic Development
by
Nan Wu
Doctor of Philosophy in Economics University of California, Los Angeles, 2020
Professor Lee Ohanian, Chair
My thesis consists of three chapters on economic development. Chapter 1:
The research on the catch-up process of a developing economy focuses on the role of foreign technology transfer and the importance of domestic technology transfer lacks study. We study the trends of expenditures on innovation, foreign technology transfer, and domestic technology transfer. During the transition period of China from 1998 to 2007, the expenditures on innovation and domestic technology transfer of Chinese firms in the manufacturing sector grow two times faster than the expenditure on foreign tech-nology transfer.Furthermore, the estimated productivity at the firm level shows the rapid productivity growth is accompanied by a decreasing productivity dispersion. The produc-tivity dispersion has decreased by 39% in the same period. I document several empirical facts at the level of industry. First, the innovation is positively correlated with the relative productivity. Second,the expenditure on domestic technology transfer increases in the rel-ative productivity and the growth rate of relrel-ative productivity is positively correlated to the expenditure on domestic technology transfer.
Chapter 2:
I develop a theory in which firms endogenously choose one of three mutually exclusive methods to increase productivity: innovation, foreign technology transfer, and domestic technology transfer. Domestic technology transfer offers firms with low productivity a chance to become highly productive by meeting highly productive domestic peers. Domestic technology transfer leads to faster growth of productivity and greater number
of firms with high productivity. The productivity growth in China makes more Chinese firms choose to innovate or learn from domestic peers in a dynamic environment. Thus, the expenditures on innovation and domestic technology transfer increase faster. In our model, firms with low productivity adopt foreign or domestic technology and grow faster than highly productive firms. This results in the decreasing productivity observed in the data. We use the simulated method of moments to estimate key parameter values of the transition model. Our model fits data well. After checking the model fit, we conduct two experiments to answer the two questions mentioned at the beginning of our talk. In one experiment, domestic technology transfer is not allowed, and I find that the domestic technology transfer contributes 30% of productivity growth and 31% of relative innovation expenditure growth. In the other experiment, we improve the domestic intellectual property and the policy changes significantly reduce both productivity growth and expenditure on innovation.
Chapter 3:
Our economic geography model features cross-country productivity, human capital, amenity and population differences, international trade, migration cost, and heteroge-neous working and entrepreneurial skills. We compare welfare under baseline parameter-ization with a migration autarky counterfactual and the welfare gains of the US native residents from migration reform. The gains from migration are substantial, as high as trade gains, and natives in countries that received a lot of migration are much better off, at about 5% to 15% . Both the native entrepreneurs and workers benefit from migration while the entrepreneurs tend to gain twice as large as the workers. The welfare of the US native entrepreneurs and workers can increase by 5.1% and 1.6% by optimizing migration frictions and the population of the US increases by 14.7% under optimization.
The dissertation of Nan Wu is approved.
Nico Voigtlaender Francois Geerolf
Gary Hansen
Lee Ohanian, Committee Chair
University of California, Los Angeles
To my parents,
TABLE OF CONTENTS
1 The transition of Chinese Manufacturing in Technology Development 1
1.1 Introduction . . . 1
1.2 Empirical Facts . . . 5
1.3 Conclusions . . . 8
2 The Contributions of Domestic Technology Transfer to Innovation and Productivity Growth . . . 10
2.1 The Transition Dynamic Model . . . 10
2.2 Structural Estimation and Experiments . . . 20
2.3 Conclusion . . . 27
3 Immigration and Gains from Openness . . . 29
3.1 Introduction . . . 29
3.2 Model . . . 32
3.3 Calibration . . . 38
3.4 Counterfactuals . . . 43
3.4.1 Effects of immigration to the US . . . 43
3.4.2 Immigration and Trade Autarky to Baseline Parameterization . . 45
3.4.3 Optimal Immigration Frictions of the US . . . 46
3.5 Conclusion . . . 48
4 Appendix 1 . . . 49
4.1 Appendix A.Theoretical proofs . . . 49
5 Appendix 2 . . . 60
LIST OF FIGURES
1.1 Expenditure on Technology Transfer and Innovation . . . 6
1.2 Distance to Domestic Frontier and Relative Productivity . . . 7
2.1 gains after technology development . . . 17
2.2 Transition in the Model Economy . . . 22
2.3 Effects of Domestic Technology Transfer . . . 25
2.4 Effects of Stronger IPR Protection . . . 27
3.1 Effects of immigration to the US . . . 44
3.2 Immigration and Trade Autarky . . . 45
LIST OF TABLES
1.1 Domestic Technology Expenditure . . . 8
2.1 Parameter Values and Targets . . . 21
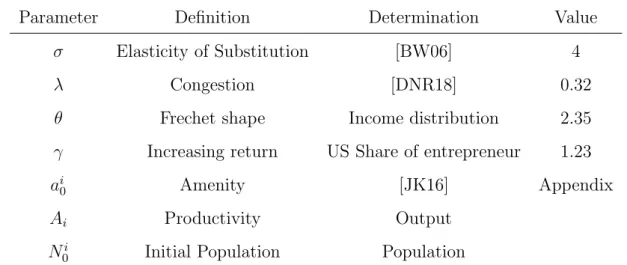
3.1 Baseline Parameter Values and Variable Normalization . . . 40
3.2 Estimation Results of Trade Costs . . . 41
3.3 Calibration Results of Migration, Amenity, and Productivity . . . 42
4.1 Changes in Productivity . . . 55
4.2 Distance to Frontier . . . 56
4.3 Distance to Frontier across Industries . . . 58
4.4 Moments in the data and model . . . 59
5.1 Average Share of Immigrants by Occupation and Origin Country, 1980-2015 61 5.2 Average Relative Income of Immigrants by Occupation and Origin Country, 1980-2015 . . . 61
ACKNOWLEDGMENTS
I would first like to thank my committee chair, Prof. Lee Ohanian, who has given me invaluable guidance and support. Without his help and encouragement, this dissertation would not have been possible.
I would also like to extend my sincere gratitude to my committee members, Prof. Gary Hansen, Prof. Francois Geerolf and Prof. Nico Voigtlaender, for their advice and assistance.
Last but not least, I would like to express my appreciation to all my classmates and friends at UCLA, for they have made my PhD study truly joyful and memorable.
VITA
2009 – 2013 B.S. (Economics), Zhejiang University
2009 – 2013 Honor Degreee (Undergraduate of Public Administration),Chu Kochen Honors College, Zhejiang University
2013 – 2020 (Expected Graduation: 2020) PhD student (Economics), UCLA.
2015 – 2018 Teaching Assistant, Economics Department, UCLA. Taught intermediate macroeconomics/microeconomics/economic growth.
CHAPTER 1
The transition of Chinese Manufacturing in
Technology Development
1.1
Introduction
In the past decades, China’s economy and real per capita income grew at a high rate. Some economists argue that the future growth in China relies on innovation and tech-nology upgrading[WXZ17]. The literature discusses how expenditure on innovation rises with the boom of patent applications and patents granted[WXZ17, XZ15].Another strand of literature, which focuses on the transition from imitation to innovation, emphasizes the tradeoff between imitating foreign firms (foreign technology transfer) and innovation (R&D)[Ace03a, MB95].This reveals the force behind productivity growth and innovation expenditure increase in the transition of a developing country. However, recent work on the tradeoff between imitation and innovation shows both learning from other domes-tic firms (domesdomes-tic technology transfer) and innovation are vital to the economy growth in the long run. Motivated by the literature, this paper explores how domestic tech-nology transfer affects productivity growth and innovation expenditure increases in the transition.
To answer the question, we have constructed a dynamic model in which domestic firms are heterogeneous in productivity and adopt different ways to improve productiv-ity. They can attempt to use technology employed by other foreign and domestic firms or increase productivity by innovation (R&D). The decision of a firm on productivity depends on relative domestic productivity to foreign productivity and the relative pro-ductivity of the domestic firm to other domestic firms. Domestic firms tend to imitate foreign technology when relative domestic productivity is low. Otherwise, domestic firms are less willing to pay for foreign technology. Whether to imitate technology used by other
domestic firms depends on how far the firm is behind other domestic firms in productiv-ity. In our model, the highly productive firms innovate and transfer technology to other domestic firms. These firms cannot get more productive technology from other domestic and foreign firms and have to rely on innovation to improve productivity. Firms with low productivity tend to adopt technology from other domestic firms, and middle firms prefer technology transfer from foreign firms. Compared with foreign technology trans-fer, adopting domestic technology induces lower costs but improvement of technology depends on the average domestic productivity. Unproductive firms could obtain technol-ogy improvement from other domestic firms and benefit from the lower costs. However, middle firms are not very likely to meet more productive domestic firms and increase their productivity. As a consequence, they would rather spend more and obtain greater technology from foreign firms.
Our paper emphasizes two channels through which domestic technology transfer can affect innovation in the transition. The first and direct channel is that domestic technol-ogy transfer encourages firms to do more innovation as a subsidy. We assume the firm that adopts domestic technology meets another domestic firm after a random search and pays a share of surplus generated by the transfer as a result of Nash bargaining. Due to the random search, heterogeneous firms that transfer technology would meet firms with the same expected productivity. Thus the payment received by a firm transferring tech-nology is proportional to its own productivity. To some extent, transferring techtech-nology to less productive firms provides extra incentives to innovative firms and encourages them to spend more on innovation.
The other channel works indirectly. Domestic technology transfer offers a probability for a unproductive firm to gain a large increase in productivity and to become a highly productive firm. The greater the share of productive firms due to domestic technology transfer, the greater the share of innovative firms in the future and thus the more firms spend on innovation. The literature on imitation and innovation in the long run steady state shows that imitation is a alternative way to improve productivity other than inno-vation and that the existence of imitation can help long run growth but discourage firms to innovate[BPT17]. However, domestic technology transfer in our paper is different from imitation in the literature in two aspects. First, domestic technology transfer provides
extra incentives for innovation. Second, adopting domestic technology does not crowd out innovation during the transition. In our model, unproductive middle firms would choose between adopting domestic technology and foreign technology while productive middle firms decide whether to innovate or adopt foreign technology. Thus only foreign technology transfer is able to crowd out innovation during the transition.
The paper is part of the literature on the tradeoff between innovation and the transfer of foreign technology in developing countries[AAZ06, CCG14, MB95, Ace03b, BPT14].In the literature, [MB95] were the first to discuss the mechanism by which a poor country chooses to copy foreign technology rather than innovation. The cost of copying foreign cost gradually rises as the poor country catches up with the foreign country. [BPT14] explore the catch-up of poor country and how the cost of technology diffusion determines convergence and fall-back of the poor country in the long run. [Ace03b] and [AAZ06] focus on the firm strategy of innovation and imitation as the economy approaches the world technology frontier and whether the economy can converge with the frontier. In [Ace03b], the key factor that determines convergence is outsourcing of production, while [AAZ06] show how the tradeoff between the skill of a manager and capital plays a vital role. Our paper’s contribution to the literature is twofold. First, we model heterogeneous firms in the transition. Firms in our economy adopt different strategies of development during the same period. Second, we focus on the interaction between domestic technology imitation and innovation although the tradeoff between foreign technology imitation and innovation is important as well. [CCG14] is the only paper that incorporates the three strategies discussed in our paper. However, the transfer of foreign technology in their paper is limited to foreign directed investment firms, and the rest can either innovate or imitate other firms. The other difference is that the firm that adopts technology in our model will apply the technology to a different variety while the firm in their paper will steal the market owned by the firm it imitates.
Our paper also relates to another strand of literature that explores the role of do-mestic imitation in growth [ABL08, LM14, Lut07, KLZ16, PT14, BPT17, KSS18]. In the literature, domestic imitation contributes to the long run growth of the economy and the growth effect of imitation depends on the support and tail thickness of productivity distribution. Following the tradition of the literature, we model the domestic technology
transfer as the result of a random search . Domestic technology transfer is featured with payment from the imitator to the imitatee, while imitation in the literature is free. Moti-vated by [ACG16], the payment in transfer is determined by Nash Bargaining. [BPT17] and [KSS18] provide analysis on the interaction between imitation and innovation with discrete and continuous productivity distribution. Our paper incorporates foreign tech-nology adoption other than domestic techtech-nology transfer , and innovation and adopting foreign technology is taken as an important source of growth for developing countries such as China[WXZ17]. We apply the theory to the case of the Chinese transition economy and quantify the effect of domestic technology transfer on growth and innovation. [KSS18] provides a model incorporating domestic imitation and innovation of Chinese firms. But they emphasize the distortion on innovation faced by Chinese firms and explain why innovation investments are less productive in China.
The main contribution of the paper is to estimate the importance of domestic tech-nology transfer to innovation and productivity growth based on the theory: we use a Simulated Method of Moments approach to estimate a dynamic transition equilibrium model that incorporates the interactions between domestic technology transfer and inno-vation.We estimate the model using data of Chinese firms in manufacturing from 1998 to 2007 and targeting aggregate expenditure on innovation, domestic and foreign technology transfer and productivity distribution. According to the Chinese Statistics Yearbook of Science and Technology, the expenditure of Chinese manufacturing firms on domestic technology transfer and innovation rose dramatically over the past ten years. Domestic technology transfer payments increased from 1.82 billion Yuan to 12.96 billion Yuan, and innovation expenditure surged from 19.71 billion Yuan to 211.25 billion Yuan. Compared with the trend of expenditure on foreign technology transfer, which only went up from 21.48 to 45.25 billion, relative domestic technology payment surged from 8.5% to 28.5% and innovation from 91% to 466%. The transition during this period also features increas-ing average productivity and decreasincreas-ing distance to frontier. The average productivity of manufacturing in China relative to the US surged from 4.6% to 12.4% . And the distance to frontier within industry, which measures the log difference between the most and least productive firms within the same industry, dropped from 3.92 to 3.53.
average productivity of manufacturing in China relative to the US surged to 10.68%, and relative innovation expenditure increased to 239%. In other words, the model accounts for 79.8% of productivity growth and 46.4% of innovation expenditure increase. The first experiment is conducted to figure out the importance of domestic technology transfer to productivity growth and innovation increase. In the first experiment, we increase the cost of domestic technology transfer such that no firms adopt domestic technology, which results in reductions of productivity growth and innovation increase by 57% and 64% , respectively. The second experiment examines the effects of intellectual property rights(IPR) protection on growth and innovation in transition. Increasing the strength of IPR protection would result in greater bargaining power of the imitatee in our model. When we increase the share of surplus gained by the imitatee from 0.6% to 1.2%, the growth of productivity decreases by 35% and expenditure on innovation by 48% in the period.
1.2
Empirical Facts
Since the reform in 1978, the Chinese economy has experienced a great transition. [Zhu12] argues 1998-2007 is an important phase during the transition. In 2007, China’s govern-ment started to legalize the developgovern-ment of private enterprises. Between 1998 and 2007, the average annual total factor productivity growth rates of the state and non-state sec-tors were 5.50 percent and 3.67 percent, respectively. The manufacturing sector grows even faster during the same period. [BVZ12] estimate that, for the manufacturing sector, the total factor productivity growth rate is 13.4 percent a year.
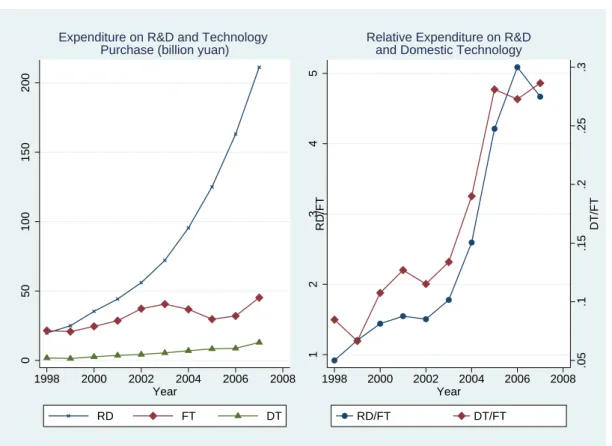
Our paper focuses on the manufacturing sector between 1998 and 2007. Adopting for-eign technology, domestic technology transfer, and innovation are three ways for Chinese manufacturing firms to improve their productivity. Using industry level data from the Chinese Science and Technology Yearbook, we find Chinese firms spend most on adopting foreign technology in 1998 while the expenditure on innovation becomes the greatest in 2007 (Figure 1). The spending on domestic technology transfer and innovation is 8.5%, and 91% of this on foreign technology transfer in 1991. During the ten years, expendi-tures on domestic technology and innovation grow rapidly and the growth rate of foreign
technology expenditure is moderate. In the year 2007, the ratios of expenditures on do-mestic technology transfer and innovation to foreign technology transfer increase to 0.29 and 4.66 respectively.
Figure 1.1: Expenditure on Technology Transfer and Innovation
0 50 100 150 200 1998 2000 2002 2004 2006 2008 Year RD FT DT
Expenditure on R&D and Technology Purchase (billion yuan)
.05 .1 .15 .2 .25 .3 DT/FT 1 2 3 4 5 RD/FT 1998 2000 2002 2004 2006 2008 Year RD/FT DT/FT
Relative Expenditure on R&D and Domestic Technology
Notes: The first graph shows the trends of expenditures on innovation, and foreign and domestic technology. The second graph shows the relative expenditure on R&D and domestic transfer. The relative expenditure is defined as the expenditure divided by the expenditure on foreign technology transfer.The left axis in the second graph shows value for relative R&D expenditure and the right shows value for relative domestic technology transfer expenditure. Source: Chinese Science and Technology Yearbook
Another important trend is the distance to frontier of productivity distribution. Using the Annual Survey of Above Scale Industrial Firms from 1998-2007, we calculate firm productivity according to [BVZ12] and [HK09]. The distance to frontier in an industry is defined as the productivity log difference between the 90th and 10th percentile firms in the industry. The average distance to frontier of manufacturing, which is weighted by value added, dropped from 3.92 to 3.53 in the period. This fact means the annual
growth rate of the 10th percentile firm is approximately 4% greater than that of 90th percentile firm on average. Consistent with [Zhu12] and [BVZ12], we observe the rapid growth of relative productivity of Chinese manufacturing. The average growth rate of Chinese manufacturing productivity relative to the US is as high as 12.7% . This results in relative productivity increase from 4.6% to 12.4% in ten years.
Figure 1.2: Distance to Domestic Frontier and Relative Productivity
.04 .06 .08 .1 .12 Relative TFP 3.5 3.6 3.7 3.8 3.9 Domestic Distance 1998 2000 2002 2004 2006 Year ln(p90/p10) TFP relative to US
Notes: The left axis shows values for the distance to frontier and the right shows values for relative productivity. The decreasing trend of distance to frontier is robust for other measures such as simple average and other sample such as a sample without SOE. Source: Annual Survey of Above Scale Industrial Firms and NBER-CES Manufacturing Industry Database
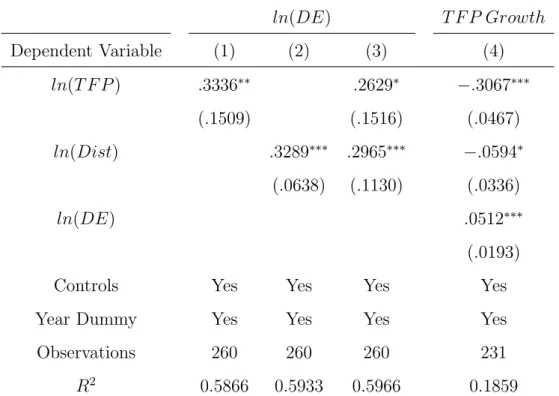
Controlling value added, exporting share of products, capital per worker, number of firms, and year dummy, we find one percent point increases of relative productivity and distance to frontier are associated with a 0.26 and 0.29 percent point domestic technology transfer payment (Table 2). We explore the correlation between domestic technology transfer and relative productivity growth rate as well. The correlation coefficient is 0.05
Table 1.1: Domestic Technology Expenditure ln(DE) T F P Growth Dependent Variable (1) (2) (3) (4) ln(T F P) .3336∗∗ .2629∗ −.3067∗∗∗ (.1509) (.1516) (.0467) ln(Dist) .3289∗∗∗ .2965∗∗∗ −.0594∗ (.0638) (.1130) (.0336) ln(DE) .0512∗∗∗ (.0193)
Controls Yes Yes Yes Yes
Year Dummy Yes Yes Yes Yes
Observations 260 260 260 231
R2 0.5866 0.5933 0.5966 0.1859
Notes: The dependent variables are the log of domestic expenditure for column (1) (2) (3) and the productivity growth rate for column (4). Productivity is the relative productivity of the Chinese manufacturing industry to the US.Distrepresents the distance to frontier in the industry. ln(.) indicates the variable is the log value of the variable in the brackets. Robust standard errors are in brackets.
∗ ∗ ∗Significant at the 1 percent level. ∗∗Significant at the 5 percent level. ∗Significant at the 10 percent level
and significant at the1 percent confidence level.
1.3
Conclusions
This chapter investigates the empirical facts on the transition of China from 1998 to 2007. It shows Chinese firms changed their ways to develop productivity during the transition and they spent more on innovation and domestic technology transfer compared with foreign technology transfer. The industry level evidence indicates the expenditure on domestic technology transfer is positively correlated with the growth rate of productivity in the industry and the growth productivity would increase the expenditure on innovation
CHAPTER 2
The Contributions of Domestic Technology Transfer
to Innovation and Productivity Growth
2.1
The Transition Dynamic Model
In this section, we develop a theory of transition economy that is consistent with previous evidence and featured with the endogenous choice of innovation and technology transfer.
A. Demography and Preference
The model economy is a small open economy, and the interest rate isR. Time is discrete and infinite,t= 1,2,3.... The economy is populated by overlapping generations of agents who live for two periods. In the first period, the agents own one unit of labor and earn a wage as workers. They save or borrow money to consume at the end of the period. In the second period, the agents become old and lose their ability to work. But they inherit the firm from their parents. They claim the profits from the firm and consume the saving and income in the second period. Preferences of agents are the following time separable utility function. Ut= c1− 1 θ 1,t −1 1− 1 θ +δc 1−1 θ 2,t −1 1− 1 θ (2.1) s.t. c1,t+ c2,t R =wt+ π1,t+1 R
,where β is the discount factor and θ is the intertemporal elasticity of substitution in consumption. The agent born at time t consumes c1,t and c2,t in the first and second
periods of his life, wt is his wage earning in period t ,and π1,t+1is the firm profit that he
B. Production
There are two sectors in production: the intermediate sector and the final sector. The final sector consists of competitive firms. These firms use intermediate goods, and labor to produce final goods, and the production technology is
Yt= 1 1−αL α f t Z 1 0 qαjtkjt1−αdj (2.2)
, where Yt is the output of final goods. Lf t is the labor used to produce final goods. The
intermediate good is continuous and indexed by j ∈ [0,1], qjt represents the quality of
intermediate j in period t, and kjt represents the quantity. In the final good production
function, σ < 1. The marginal return of intermediate goods in production is decreasing in quantities. The final firm tends to use various intermediate goods as inputs in the production.
Final firms maximize profits by choosing an optimal amount of labor and varieties of intermediate goods. Given the production technology of the final sector, the problem is
max kjt,Lf t 1 1−αL α f t Z 1 0 qαjtkjt1−αdj− Z 1 0 pjtkjtdj−wtLf t (2.3)
, where pjt is the price of intermediate good j and wt is the wage rate of workers in
the labor market. We derive the inverse demand functions for intermediate goods and labor from first order conditions,
pjt =Lαf tq α jtk α−1 jt (2.4) wt= α 1−αL α−1 f t Z 1 0 qjtαkjt1−αdj (2.5)
The final firms produce more final goods using the intermediate good with higher qual-ity and thus the price of the intermediate good with greater qualqual-ity is higher. The qualqual-ity of intermediate goods also affects the wage rate of the economy. The wage rate increases in intermediate good quality because labor and intermediate goods are complementary in production.
The firms in the intermediate sector are monopolistic, and the only input of interme-diate goods is labor. The production technology of the intermeinterme-diate firm is
kjt = ¯qljt (2.6)
, where ¯qt =
R1
0 qjtdj is the average quality of intermediate goods in the sector. In
other words, the quantity of intermediate good production is independent of its quality, but the firm’s profits increase in its quality. We calculate productivity using the value of output in the empirical section, and the measured productivity is equivalent to quality in our model. Workers in the labor market are employed either by intermediate or by final sector. In the production sectors,
(1)the profits of the intermediate firms are linear in their productivity;
(2)the wage rate is proportional to the average productivity of the intermediate sector; (2)the share of labor employed by the intermediate sector is invariant over time
Proof. Appendix
B. Productivity of the Intermediate Firms
The intermediate Firms are heterogeneous in productivity, and the productivity isqt. In
period t, the productivity distribution is Gt(qt) and the support is qt ∈ [qtM,∞). We
assume foreign firms are homogeneous in productivity and their productivity is ¯A, which is constant over time. We have derived that the profits of the intermediate firms are linear in their productivity. The domestic firm owners make an optimal decision on productivity to maximize the firm profits. We assume that the measure of intermediate firms is 1 and each old agent owns one firm. When the old agent dies, the firm is inherited by a young agent. For simplicity, we assume the old receives no compensation from giving the firm to the young. Therefore, the old does not consider the profits of the firm in the future when he makes decisions on technology development. When the firm is taken over by the young, the productivity of the firm does not change.
We focus on innovation and technology adoption and ignore the selection in the tran-sition. In other words, we do not consider firm entry and exit. The reason our model does not incorporate the explicit firm entry and exit is that the firm selection is a form of
imitation [Lut07] . In our model, the least productive firms adopt technology from other domestic firms , and their productivity increases to the level of the firm they meet. The process is similar to that in which the least productive firms exit and new firms enter with productivity drawn from the productivity distribution of incumbent firm. The literature on innovation and imitation also does not model the entry and exit [BPT17, KSS18].
We assume firm innovation, foreign and domestic technology transfer are mutually exclusive. Firm owners choose one of the three ways to maximize the profit of the current period
πt(qt−1) = max{πtR(qt−1), πtF(qt−1), πtD(qt−1)} (2.7)
, where qt−1 is the productivity of the firm at the beginning of period t. The
profits from innovation, and foreign and domestic technology transfer are denoted as
πR
t (qt−1), πFt (qt−1),and
πDt (qt−1)
, respectively.
If the firm owner decides to innovate, he faces the following problem,
πRt (qt−1) = max γt π
∗
(1 +γt)qt−1−(χRγtψqt−1+ηRqt−1) +τD((1 +γt)qt−1, θD) (2.8)
, where γt is the growth rate of productivity in period t and productivity at the end
of period t is (1 +γt)qt−1. The profits of the firm by innovation are determined by three
components: profit from sales, cost of innovation, and gain from transferring technology.
π∗(1 +γt)qt−1 represents the profits from sales andπ∗ is the constant coefficient. The cost
of innovation has two parts: the variable cost ,χRγψ
tqt−1 , and the fixed cost,ηRqt−1. The
variable innovation cost increases in the growth rate of productivity andηRqt−1 is linear in
the productivity. χRgoverns the variable cost of innovation and affects the average growth
rate of innovative firms. ψ is the convexity of innovation cost with respect to the growth rate and affects the changes in the innovation growth rate over time and the distribution of innovation growth rate. ηR is the cost parameter of fixed cost and determines the share of firms choosing innovation. At last, τD((1 +γ
t)qt−1, θD) represents the gain from
If the firm adopts foreign technology, the owner will decide the amount of foreign technology to purchase, πFt (qt−1) = max λt π ∗ (qt−1+λtA¯)−χFλβtA¯−τ˜F(θ F ) +τD(qt−1+λtA, θ¯ D) (2.9)
, where λtA¯ represents the amount of foreign technology that the firm decides to
adopt and ¯Ais the level of foreign technology. At the end of the period, the productivity increases toqt−1+λtA¯. The variable cost of adopting foreign technology ,χFλ
β
tA¯, increases
in how much the domestic firm learns from foreign firms. The domestic firm need to make a payment to foreign firms as well, and the payment is denoted by ˜τF(θF). The domestic
firm that adopts foreign technology can transfer its technology to these firms that adopt domestic technology and gain the revenue, τD(qt−1 +λtA, θ¯ D) .
The last way that domestic firms can develop their productivity is through domestic technology transfer. The problem of domestic technology transfer is
πDt (qt−1) =
Z
(π∗q−τ˜D(q, qt−1, θD))dGt(q|q∈ΦR∪ΦF)−ηDqt−1 (2.10)
The timing of innovation and technology adoption is important. At the beginning of period t, the firm decides to innovate or adopt technology. It takes one period for the firm to innovate or digest the foreign technology. However, the domestic firm (imitator) needs one period to randomly search other domestic firms (imitatee) and meet the firm and purchase technology at the end of the period. Since the domestic technology transfer occurs at the end of the period, imitatees have increased their productivity through innovation and foreign technology transfer and the productivity distribution is denoted by Gt(q|q ∈ ΦR∪ΦF) , ,where ΦR and ΦF are the sets of firms doing innovation and
adopting foreign technology. When the imitator meets an imitatee with productivity q, the imitator’s productivity jumps to q and the imitator pays ˜τD(q, q
t−1, θD) . To search
the imitatee, the imitator bears the search cost, ηDqt−1. The search cost is linear in
the firm’s productivity, which is the same as in [BPT17]. One important assumption we make here is that the imitator will not meet other imitators.This assumption yields a clean truncation of the distribution, with no mass of firms perpetually left behind. [PT14] have the same assumption on imitation.
Different from pure imitation, the imitatee has IPR on their technology and can pre-vent others from learning their technology. We assume the payment of technology transfer is the result of Nash Bargaining. The bargaining powers of the domestic imitator against a foreign and domestic imitatee are θF and θD, respectively. Thus the domestic
imita-tor keeps the share ,θF(θD), of surplus generated by the foreign (domestic) technology
transfer, and the rest of the surplus is the payment of technology transfer. The matching function between imitators and imitatees is
H =M(sDt , sRt +sFt ) = (sDt )µ(sRt +sFt )1−µ (2.11)
We assume the probability that the imitator finds an imitatee is always 1 and thus
µ = 1. Then the measure of imitators that an imitatee can meet is H sR t+sFt = sDt sR t+sFt . If sDt sR t+sFt
> 1, this means that the imitatee sells its technology to several imitators. If
sDt sR
t+sFt
<1, some imitatees at the end of the period may fail to meet any imitator.
The payment of a imitator, qt−1 ,that adopt technology from a domestic firm, q , is
τ(q, qt−1, θD) = (1−θD)π∗(q−qt−1) (2.12)
We derive the expression of payment received by domestic firms,
τD(q, θD) = s D t sR t +sFt (1−θD)π∗(q−Ej(qj|GDt−1)) (2.13) , where sD
t ,sFt , and sRt are shares of firms that adopt domestic and foreign technology
and conduct innovation and sDt +sFt +sRt = 1. GDt−1 is the productivity distribution of imitator firms at the beginning of period t. At the end of the period, the imitatee firm meets heterogeneous imitator firms.The measure of imitators is sDt
sR
t+sFt , and their expected
productivity is Ej(qj|GDt−1). On average the productivity of an imitator jumps from
Ej(qj|GDt−1) to q and the difference q−Ej(qj|GDt−1) represents the surplus of technology
transfer.
The payment that a domestic firm makes to the foreign firm for technology transfer has the following expression,
˜ τF = (1−θF)(π∗ λtA¯+ sDt sR t +sFt (1−θD)π∗λtA¯) (2.14)
The productivity increase from the foreign technology transfer is λtA¯. The imitator
gains additional output λtA¯ and the domestic imitator’s payment sD t sR t+sFt (1−θD)π∗λ tA¯.
The foreign firm shares both the additional output and the domestic imitator’s payment.
C. Equilibrium during Transition
When adopting technology from foreign firms, the domestic firm bears the cost of digest-ing foreign technology and the cost increases in the amount of foreign technology they adopt. When the firms spend money on innovation, the innovation expenditure increases in the growth rate of firms as well. Therefore, the firm owners make decisions on the optimal rates of both innovation and foreign technology adoption. Plugging equation 2.12 into equation 2.8 and equation 2.14 into equation 2.9, we can derive optimal rates from the first order conditions. There exists the optimal growth rate of the innovative firm and the optimal rate of foreign technology adoption,
γt∗ = ((1 + s D t sR t +sFt (1−θD)) π ∗ ψχR) 1 ψ−1 (2.15) λ∗t = ((1 + s D t sR t +sFt (1−θD))π ∗θF βχF ) 1 β−1 (2.16)
Proof. See Appendix
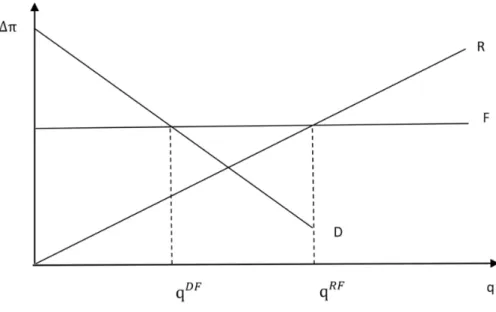
Other than the optimal rates, we find the way that firms choose to develop productiv-ity depends on the productivproductiv-ity of the firm. Given several regularity conditions, there exist two thresholds in the productivity distribution qtRF−1 and qDFt−1 in period t such that
(1)firms innovate if their productivity q > qRF t−1;
(2)firms adopt foreign technology if their productivity q∈[qDF t−1, qRFt−1];
(3)firms adopt domestic technology if their productivity q < qtDF−1
, where qRF
t−1 and qtDF−1 are determined by
πDt (qtDF−1) = πFt (qDFt−1) (2.17)
Proof. See Appendix
Figure
Figure 2.1: gains after technology development
Notes: This figure shows the gains, of firms that develop productivity through innovation, foreign and domestic technology transfer, ∆π, against firm productivityq. The three lines
R,F, and D represent the profit gains from innovation,foreign and domestic technology transfer, respectively.
Given the thresholds in the productivity distribution, we have the shares of firms innovating and adopting technology in period t,
sRt = 1−Gt−1(qRFt−1) (2.19)
sFt =Gt−1(qtRF−1)−Gt−1(qtDF−1) (2.20)
sDt =Gt−1(qDFt−1) (2.21)
The distribution of productivity evolves as domestic firms develop their productivity. We assume the support of the initial productivity is [q0M,∞). During the transition, the
lower bound of distribution support is
qtM =qtDF−1+λtA¯ (2.22)
As we have shown in proposition 2.1, the firms whose productivity is less than qDF t−1
choose to search other domestic firms and copy their technology. At the end of period t, the least productive firms that adopt foreign technology increase their productivity from
qDFt−1 to qtDF−1 +λtA¯. These firms are the least productive firms that domestic imitator
firms can meet. Thus the minimum productivity of all firms at the end of period t is
qDFt−1 +λtA¯. The productivity distribution has the following evolution,
gt(q) = 1 1−Gt−1(qDFt−1) 1 1+γtgt−1( q 1+γt) q > q u t 1 1−Gt−1(qDFt−1) gt−1(q−λtA¯) q < qlt 1 1+γtgt−1( q 1+γt)+gt−1(q−λtA¯) 1−Gt−1(qt−DF1) ql t < q < qtuand qRFt−1 < λtA¯ γt (2.23) , where ql
t and qtu are minimum and maximum between qtRF−1(1 +γt) and qtRF−1+λtA¯.
The firms with productivity qtRF−1 gain the same profits from adopting foreign technol-ogy. However, the productivity of these firms would be qRF
t−1 +λtA¯if they adopt foreign
technology and qtRF−1(1 +γt) if they innovate. Because time is discrete in our model, it
is possible that these firms whose productivity is less thanqRF
t−1 adopt foreign technology
and end up with productivity higher than those innovative firms.
The first line of the productivity evolution equation describes the tail of productivity distribution. Two types of firms make up of the tail firms at the end of period: the productive firms that choose innovation and the firms that adopt domestic technology and meet the first type of firms. For the first type of firm with productivity qat the end of the period, their productivity is 1+qγt in the last period and the density of these firms is reduced to 1+1γtgt−1(1+qγt). The second type of firm increases the density of productivity
distribution and the density of the second type of firm is linear in the density of the first type of firms, sDt 1−sD t 1 1+γtgt−1( q 1+γt).
The second line is the expression of the productivity density function of less productive firms. The firms described by this line consist of two types of firms as well. The first type of firms is the firm that adopts foreign technology and the second type is the domestic
imitator that meets them. The density of the first type is gt−1(q−λtA¯), and the second
type contributes the same multiplier 1−Gt−1
1(qt−DF1)
.
The third line provides the density function for the case in which the innovative firms grow faster than those firms purchasing foreign technology. And the density in the overlapping area of support is the sum of densities in the first and second lines. Given an initial distribution G0(q) , the value of ¯A and the sequence {Rt}t≥0, the transition
equilibrium is a sequence of firm-specific variables{pjt, kjt, qjt+1}j∈[0,1],t≥0 and a sequence
of aggregate variables {wt, Lf t, sDt , sFt , sDt , qtDF, qtRF, Gt}t≥ such that
(1) firm owners decide optimal price and quantity{pjt, kjt}t≥0 to maximize the
inter-mediate firm’s profits;
(2) labor wage{wt}t≥0 clears labor market,L(t) +
R
ljtdj = 1;
(3) firm owners choose the optimal way to increase {qjt}j∈[0,1],t≥0 to {qjt+1}j∈[0,1],t≥0
in order to maximize the firm owner’s income;
(4) the productivity distribution{Gt(q)}t≥0 evolves as equations 2.22 and 2.23;
(5) the shares of firms adopting technology and innovating{sDt , sFt , sDt }t≥0 are defined
by equations 2.19,2.21, and 2.20;
(6) two thresholds in the productivity distribution {qtDF, qtRF} are determined by the indifference equations 2.17 and 2.18. We observe the surge of expenditure on innova-tion, and foreign and domestic technology transfer during the transiinnova-tion, The aggregate expenditures on innovation, and the aggregate foreign and domestic technology transfer payments in our model are
TtR= (1 ψγt+η R ) Z ∞ qRF t−1 qdGt−1(q) (2.24) TtF = (1−θF)(λtA¯+ sD t sR t +sFt (1−θD)λA¯)sFt (2.25) TtD = (1−θD) Z qDFt−1 qMt−1 Z ∞ qt−DF1+λtA¯ (q−q0)dGt−1(q)dGt−1(q0) (2.26) Innovation expenditure TR
t includes both variable and fixed costs of innovation. The
innovation expenditure of a firm depends on its productivity. Therefore, the aggregate expenditure is the integral of firm expenditure over innovative firms. The aggregate
foreign technology transfer payment is the product of firm payment and the measure of firms adopting foreign technology. The costs of adopting domestic technology consist of search cost and transfer payment. The empirical part corresponds to the transfer payment. We aggregate firm transfer payment over the support of domestic imitators and imitatees with heterogeneous productivity.
The transition is featured with the rapid growth of productivity and decreasing tance to frontier within the domestic industry. In the model, the productivity and dis-tance to frontier are measured by
T F Pt = Z ∞ qM t qdGt(q) (2.27) Crt = qtM qM t−1 −γt (2.28)
The final goods production function is linear in the average productivity of inter-mediate firms and thus the expression 2.27 measures the average productivity of both intermediate and final sectors. The expression 2.28 reflects how fast the firms at the lower bound catch up with the frontier firms. The frontier firms always choose to innovate, and the growth rate is γt.
2.2
Structural Estimation and Experiments
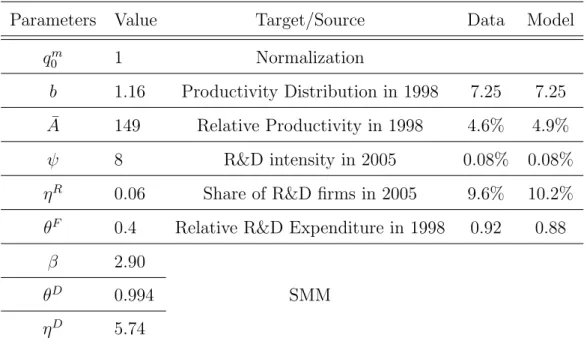
In this section, we estimate the model laid out in section 3. The estimation focuses on matching empirical moments during 1998-2006, which is covered by the dataset we have. Some parameters are calibrated and the rest are estimated by the Simulated Method of Moments [Blo09]. The results are summarized in Table ??.
The parameters we calibrate include the initial distribution G0, the foreign firm
productivity, ¯A, innovation cost ηR,ψ and the bargaining power against foreign firms,
θF.
We assume the initial distribution is a Pareto distribution, P(qM
0 , b), in whichq0M
de-termines the average productivity of firms andb determines the shape of the productivity tail. We normalize the value of qM
0 to 1. The year 1998 is set as the initial period. In
Parameters Value Target/Source Data Model qm 0 1 Normalization b 1.16 Productivity Distribution in 1998 7.25 7.25 ¯ A 149 Relative Productivity in 1998 4.6% 4.9% ψ 8 R&D intensity in 2005 0.08% 0.08%
ηR 0.06 Share of R&D firms in 2005 9.6% 10.2%
θF 0.4 Relative R&D Expenditure in 1998 0.92 0.88
β 2.90
θD 0.994 SMM
ηD 5.74
Table 2.1: Parameter Values and Targets
industries is 7.25. We let b = 1.16 such that the ratio of the Pareto distribution equals the value in 1998. Foreign firm productivity, ¯A , is set so that the relative productivity of Chinese firms in 1998 is 4.6% of that of US firms. This yields ¯A= 149.
The parameters that are related to innovation cost, ηR and ψ, are set to match two empirical moments: (1) the share of firms innovating and (2) the innovation expenditure intensity in the Annual Survey of Above Scale Industrial Firms 2005. The innovation expenditure intensity is the innovation expenditure divided by total sales. ηRgoverns the
fixed cost of innovation, and ψ measures the curvature of variable cost. There are 9.6% of firms doing innovation in 2005 and the average intensity is 0.08%. We let ηR = 0.06
andψ = 8 such that the share of innovative firms is 10.2% and the innovation intensity is 0.08% in 2005. The parameter θF measures the bargaining power of domestic imitators,
and the domestic imitator can grab more surplus generated by foreign technology transfer if the parameter is larger. The target of this parameter is the ratio of innovation expen-diture over foreign technology transfer payment in 1998. We set the parameter θF = 0.4
such that the ratio is 0.88, slightly lower than the ratio in the data (0.92).
We have the remaining three parameters ω = {θD, ηD, β} to be estimated. The
vector of moments y ={Crt,(T D t TF
t )}t=1998−2006 includes the catch-up rates and the ratios
minimize the objective function
ˆ
ω= arg min
ω∈Ω[Λ(ω)−Λ(y)]W[Λ(ω)−Λ(y)]
0
,where W is a weighted diagonal matrix and the diagonal elements are Wii = Λi(1y)2. Λ(ω)−Λ(y) represents the differences between moments in the data and moments in our model.
Figure 2.2: Transition in the Model Economy
1998 2000 2002 2004 2006
3.6 3.7 3.8 3.9
Panel A. Distance to Frontier
Model Data 1998 2000 2002 2004 2006 0.06 0.08 0.1 0.12 Panel B. Productivity 1998 2000 2002 2004 2006 1 2 3 4 5
Panel C. Innovation Expenditure
1998 2000 2002 2004 2006
0.1 0.2 0.3 0.4
Panel D. Domestic Transfer Payment
Notes: The figure shows the transition of key variables during the transition in the model economy. The solid and dashed lines refer to variables in the model economy and data.
The dynamics of the transition in our model economy are illustrated in Figure 5. Panels A-D display various macroeconomic trends of the model against the data. The values of moments in the data and these generated by the model are available in Appendix B.2.
First of all, the estimated model economy generates almost the same speed catch-up rate as its empirical counterpart (Panel A). The catch-up rate is determined by three factors: the innovation growth rate, the amount of foreign technology transfer, and the
share of domestic imitators. The growth of innovative tail firms increases the distance to frontier, while the adoption of foreign and domestic technology decrease it. During the transition of our model economy, the growth rate of innovative firms is stable (6.7 percent). The amount of foreign technology transfer is stable as well, but the effect of foreign technology on the distance to frontier is decreasing over time because the productivity of bottom firms grows rapidly. However, the share of domestic imitator rises (7.24% to 12.73% ), which compensates for the reduced effect of foreign technology. Therefore, the distance to frontier in our model economy exhibits a high decreasing rate during the transition period.
The other trend is on the growth of relative domestic transfer payment (Panel D). The relative domestic transfer payment is the domestic technology payment divided by the payment of foreign technology transfer. The trend in our model economy has a slight U shape because of the growing productivity. In the first half of the period, the bottom firms grow faster than the tail firms and more and more firms prefer to adopt foreign technology. In the second half of the period, adopting foreign technology is no longer as profitable as before because of the faster productivity growth of both bottom and tail firms.
Third, the average productivity trend during the transition tracks remarkably well with the growth rate of Chinese manufacturing productivity (Panel B). Recall that we do not target the moments of productivity when we estimate the parameters. The relative productivity in our model accounts for 79.8% of productivity growth. The productivity relative to the US increases from 4.87% to 11.13%, and the productivity in our data surges from 4.57% to 12.41%. The contribution of adopting foreign technology to productivity is decreasing and the contribution of domestic technology is growing. Thus the growth of productivity in our model keeps a high rate in the transition. Last, our model generates a sizable increase in relative innovation expenditure growth. The relative innovation expenditure to foreign technology adoption payment is 91.76% in 1998 and 466.85% in 2007. In our model, the relative innovation expenditure grows from 90.94% to 265.69% (Panel C). The growth in our model accounts for 46.4% of the empirical counterpart.
B. Experiments
We have two experiments in the section. The first experiment changes the fixed cost parameter of domestic technology adoption,ηD. We first increase the value of the fixed
cost from 5.74 to 5.78 to figure out the changes caused by the greater cost of adopting domestic technology. The increased cost of domestic technology transfer leads to a smaller catch-up rate. We find the catch-up rate in the first half of the period is not affected very much, but the effects due to the change become significant in the second half of the period. The foreign and domestic technology transfers are two forces that drive the bottom firms to catch up with the frontier. In the first half of the period, the force of adopting foreign technology dominates the force of domestic technology transfer. The greater cost in the experiment discourages firms from adopting domestic technology. Instead, these firms turn to adopting foreign technology, which enhances the catch-up rate to some extent. However, the force from adopting domestic technology dominates the other force in the second half of the period, and the catch-up rate of the bottom firms is reduced much more than before.
The increase in fixed cost decreases the growth of productivity and innovation expen-diture as well. The greater cost of adopting domestic technology makes more firms turn to adopting foreign technology and thus firms with low productivity are less likely to be productive. This diminishes the growth of productivity in the period. Because the only most productive firms innovate and the mobility of firms with low productivity is harmed by greater cost, less firms spend money on innovation and the growth of innovation ex-penditure is slowed. In a dynamic environment, a thinner tail of productivity distribution further reduces the technology transfer from productive firms to less productive firms in the domestic industry. This explains why the differences in productivity and innovation expenditure between the baseline model and the experiment become greater over time.
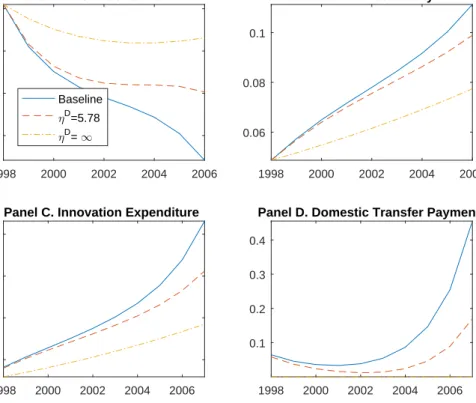
Figure 2.3: Effects of Domestic Technology Transfer 1998 2000 2002 2004 2006 3.6 3.7 3.8 3.9
Panel A. Distance to Frontier
Baseline ηD=5.78 ηD= ∞ 1998 2000 2002 2004 2006 0.06 0.08 0.1 Panel B. Productivity 1998 2000 2002 2004 2006 1 1.5 2 2.5
Panel C. Innovation Expenditure
1998 2000 2002 2004 2006
0.1 0.2 0.3 0.4
Panel D. Domestic Transfer Payment
Notes: The figure shows the effects of domestic technology transfer on the distance to frontier, and relative productivity, relative expenditure on foreign and domestic technol-ogy transfer.
We increase the cost of adopting domestic technology to infinity such that we can quantify the contributions of adopting domestic technology to the growth of productivity and innovation (Figure 2.3). Clearly, the relative expenditure on domestic technology transfer is zero in Panel D. The differences between the baseline model (solid line) and the experiment with infinity cost of adopting domestic technology (dashed-dot line) indicate that the domestic technology transfer contributes to 57% of the productivity growth and 64% of the innovation expenditure increase.
The other experiment we conduct is to test whether stronger IPR protection helps the growth. [CCG14] finds a positive correlation between the strength of IPR protection and relative productivity and they argue the optimal strength of the IPR protection depends on the stage of development. At the early stage of development, the country has weak protection to facilitate technology imitation. And the country imposes strong protection
to encourage innovation. In our model, the bargaining power of the imitator in domestic technology transfer, θD, determines the profits that the imitatees obtain from selling
technology. When the bargaining power of imitator goes up, the profit of the imitatee decreases. Therefore, we decreases the value of θD in our second experiment to figure
out the consequences of stronger IPR protection on productivity growth and innovation expenditure.
Stronger IPR protection has several effects on the technology development of firms. First, it discourages firms from adopting domestic technology, so these firms turn to adopting foreign technology, thus reducing the share of firms adopting domestic technol-ogy. Second, stronger IPR protection leads to greater profits from selling technology to a certain imitator. But it also decreases the measure of imitators that an imitatee can meet because of fewer domestic imitator and more firms adopting foreign technology. Third, the change of IPR protection also induces a change in the share of innovative firms. Be-cause the experiment affects the optimal growth rate of innovation and the optimal rate of foreign technology adoption, the returns to these two ways of developing technology are different and the shares of the two types of firms are changed.
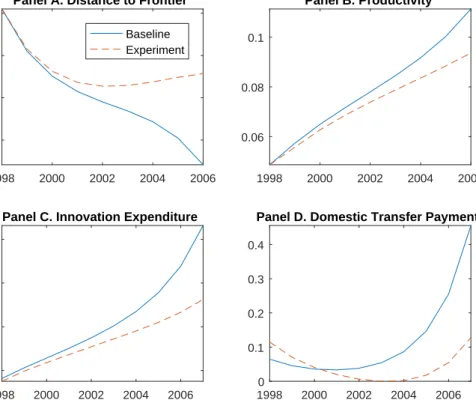
In the experiment, we change the share of profits obtained by the imitatee from 0.6% to 1.2% (Figure 2.4). We find that the effects on the optimal rates of innovation and foreign technology transfer are trivial. Because the share obtained by the imitatee is so low, it changes the optimal decisions of imitatees by less 1 percent. Therefore, the catch-up rate slows down in the second half of the transition for the same reason as in the first experiment (Panel A). In the transition, stronger IPR protection decreases the share of firms adopting domestic technology and productivity growth rate. Productivity growth has decreased by 35% in the year of 2006 (Panel B). Due to the slowdown of productivity growth, fewer firms choose to do innovation and the innovation expenditure drops by 46% (Panel C). Relative domestic transfer expenditure shows a different trend compared with that in the first experiment. Due to greater IPR protection, domestic imitator has to pay more at the beginning of the transition. However, there would be fewer domestic imitators and the technology that domestic imitators can purchase would be less advanced compared with the case of the baseline model. That is why domestic transfer payment is less than that in the baseline model after 2001(Panel D).
Figure 2.4: Effects of Stronger IPR Protection 1998 2000 2002 2004 2006 3.6 3.7 3.8 3.9
Panel A. Distance to Frontier
Baseline Experiment 1998 2000 2002 2004 2006 0.06 0.08 0.1 Panel B. Productivity 1998 2000 2002 2004 2006 1 1.5 2 2.5
Panel C. Innovation Expenditure
1998 2000 2002 2004 2006 0 0.1 0.2 0.3 0.4
Panel D. Domestic Transfer Payment
Notes: The figure shows the effects of stronger IPR protection on the distance to fron-tier, and relative productivity, relative expenditure on foreign and domestic technology transfer.
2.3
Conclusion
In this paper, we construct a dynamic transition model featureing an endogenous choice between innovation and technology adoption. We model the technology transfer payment as the result of Nash Bargaining. The cost of domestic technology adoption and the bar-gaining power of the domestic imitator affect productivity growth and expenditure on innovation in the transition. The theory is based on the significantly positive correlation between innovation expenditure and relative productivity. The expenditure on domestic technology increases in both distance to domestic technology frontier and relative pro-ductivity level. Expenditure on domestic technology is positively correlated with the productivity growth rate in the industry. The empirical evidence on the level of industry supports the theory as well. Our model is consistent with the trends of productivity
growth, decreasing dispersion of the productivity distribution, and rising expenditures on innovation and domestic technology transfer. The estimated baseline model is shown to match with the data very well.
We impose several simplifications on the model for the sake of tractability, and we may relax the simplifications in future research. First, we assume overlapping genera-tion agents who live only for two periods and simplify the dynamic problem to a static problem. Compared with the length of the period we study, this assumption may not be adequate in the quantitative exercise. The other simplification is the market structure and demand function for the intermediate goods. That China joined in the WTO is an important event in the period we study, and the accession to WTO expands the market for productive exporters and induces greater competition, which may encourage these productive firms to spend more on innovation. Our model does not take the change of market into consideration and thus the relative innovation expenditure in our model does not match the data very well after 2002.
Despite our model having the limitations above, we believe our paper casts some light on the catch-up of developing countries. The literature emphasizes the role of for-eign technology transfer in the developing country. We realize the importance of domestic technology transfer among domestic firms, although most domestic firms have much lower productivity than the world frontier. In this paper we tell a story including both the tra-ditional mechanism and the new mechanism involving the domestic technology transfer. We find domestic technology transfer contributes most to productivity growth and the rise of innovation expenditure. The economic transition for developing countries would be facilitated if policymakers take the mechanism into consideration.
CHAPTER 3
Immigration and Gains from Openness
3.1
Introduction
The United States is the largest immigrant country of the world. Over last three decades, immigrants fraction of the total employment in the United States has risen 6.9% to 17.2%. During the same period, immigrant entrepreneurs who receive great attentions account for a much larger share of the total entrepreneur population, from 7.2% to 20.8%. Although immigrant entrepreneurs are frequently discussed , most work doesn’t involve quantitative examination on their effects. Some papers are descriptive [Fai12, FL15, Hun11, KK16]. Some researchers focus specially on high-tech sector [Sax00, WSR07]. We quantify how immigration to the United States and the rest countries of the world affects the welfare of the US natives and people in the rest of the world. We further explore the interaction between immigration and international trade.
In this paper, we construct a general equilibrium multi-country model of immigration and trade in which the agents endogenously decide whether to be entrepreneurs or workers and make decisions on the places they live in. The agents have heterogeneous abilities in working and entrepreneurship in different countries. The immigrants face country-specific immigration frictions. These frictions reduce the welfare of the immigrants but do not affect the productivity and the income of the immigrants.
immigration affects the native entrepreneurs and workers in the destination country. The immigrant entrepreneurs establish more firms and create job opportunities, which benefits workers but induces stronger competition with existing native entrepreneurs. Workers are heterogeneous in skill and perfect substitutes no matter they are natives or immigrants.Thus, immigrant workers reduce relatively working income and crowd out native workers. Instead of being unemployment workers crowded out run their own
busi-ness. The crowd-out loss is mitigated because of alternative occupational choice. immi-grants increase the varieties of destination economy by running business or crowding out would-be native workers to produce new products. The native entrepreneurs and work-ers benefit equally from the increases number of varieties. The other occupation-neutral effect of immigration on the natives is congestion. Following fixed amenity framework [HMR08, RS08, AA14], we assume the increase of population causes congestion external-ity. One interpretation of congestion externality is that individuals demand for housing with fixed supply and the inflow of immigrants increases local housing price.
The immigration affects the origin countries of immigrants as well. The immigrant entrepreneurs produce different varieties in the destination country and sell them to the markets of the destination and origin countries and the rest of the world under monopolistic competition [Mel03]. An immigrant entrepreneur could be more productive after moving to the destination country , which lowers the cost of the variety. However, the price of the variety faced by people living in his origin country includes the international trade cost between the origin and the destination countries. The welfare of people living in the origin country relies on the change of the immigrant entrepreneur’s productivity and the international trade cost.
We contribute to the literature on estimating welfare impacts of migration. The lit-erature focuses on labor productivity differences across countries and gains generated by labor moving to more productive countries [KV07, KV09, BJ12, DW02, Ken13]. With-out considering congestion effect, they find huge welfare gains of the world economy but immigration reduces welfare of native individuals who are workers in the destination country. Two exceptions that emphasize the endogenous variety are [IP09] and [GLO14]. In their papers, immigrants are only working labors. More firms enter the market due to labor increase and provide more varieties. For [IP09], workers are heterogeneous in skills and employed in different sectors. Depending on skills of immigrants, workers in differ-ent sectors receive differdiffer-ent shocks. However, production technology doesn’t change with inflow of people and firms in the same sector are homogeneous. In [GLO14], firm pro-ductivity is Pareto distributed and those entrants after the inflow of labor have relatively lower productivity. My paper differs from the literature and it is possible that immi-grant entrepreneurs improve average productivity of destination if they are of high
en-trepreneurship, which echoes recent report on successful immigrant entrepreneurs such as Arianna Huffington, Elon Musk, and Sergey Brin. Whether the immigrant entrepreneurs could increase the productivity of the destination country depends on the immigration friction between the origin and the destination countries. The productivity of the immi-grant entrepreneurs would be high enough to increase the productivity if the immiimmi-grant entrepreneurs face high friction.
To quantify the welfare effects of immigration to the United States, one counterfactual experiment is conducted in which the United States closes it border while international immigration still exists among other countries. Provided the current skill and occupation composition of immigrants in the United States, native entrepreneurs welfare is improved by 3.95% and native workers are worse off moderately by 0.98%. The immigration of the United States also contributes to world welfare by 0.43%. We further compare the worldwide international immigration and trade autarky with the baseline model, and figure out the welfare effects of the international immigration and trade. The welfare gains from immigration is substantial and as high as the gains from international trade. The gains of different countries range from 5% to 15% and the entrepreneurs gain more than workers in most countries.
Second, we explore marginal contribution of immigrants to the United States by ori-gin country and the optimal scheme for immigration frictions. immigrants in the United States come from all over the world and face immigration country-dependent frictions. For example, the United States immigration system sets a per country limit. No more than 7 percent of the visas may be issued to natives of any one independent country in a fiscal year. Empirical evidence shows great variances in their shares of the United States population (quantity) and relative incomes (quality) as worker and entrepreneur. For example, Mexican immigrants account for 3.38% of workers and 5.19% of entrepreneurs while the average population of Mexico over 1980 to 2015 is 98.10 millions. On contrary, immigrants from China and India accounts for less than one percent of workers and en-trepreneurs. In terms of income, Mexican immigrants only receive about half income as their American cohorts, while Indian earn 43% more income as workers and 46% as en-trepreneurs than American natives (Appendix 5). We measure the marginal contribution of immigrants by origin country to the United States as the increase of average welfare
of the US natives for a marginal increase of immigrant population from the origin coun-try. We assume the US government can change country-specific immigration frictions and implement an optimal scheme to maximize the welfare of the US natives. Under the optimal scheme, the welfare of native entrepreneurs and workers increase by 5.06% and 1.65% relative to those in our baseline parameterization and the total population in the US increases by 14.7%.
The rest of the chapter is organized as follows. Section 2 presents the multi-country model. Section 3 provides the calibration and parameter values. Section 4 shows the results of experiments. Section 5 concludes.
3.2
Model
Our framework extends the model of trade in [Mel03] to incorporate occupation and im-migration decisions. Our model is a monopolistic model with a continuum of endogenous tradable varieties . Following [GLO14], individuals choose one country to live in and make occupational choice between entrepreneur and worker.
A. Preferences and Welfare
The world consists of I countries indexed by i, j = 1, ..., I with N0
i units of population.
Individuals in different economies have identical preferences. Individuals consume final good Qi. The final good Qi represents a CES aggregator over a continuum of varieties
from domestic and foreign producers,
Qi = ( X j Z Ωj qji(ωj) σ−1 σ dωj) σ σ−1 (3.1)
,where qji(ωj) is the consumption of variety ωj ∈Ωj produced in country j . σ > 1 is
an elasticity of substitution between any two goods. Given the aggregate consumption, the demand for each variety of goods ,qji, and expenditure, rji, are
qji =Qi( pji Pi )−σ rji =PiQi( pji Pi )1−σ (3.2) ,wherePi = [ P j R
pi(ωj)1−σdωj]1/(1−σ) is the overall price index in country i. The
Welfare in country i depends on utility derived from consumptionQi and amenity a0i
which is one unique characteristics of the country. Thus the welfare of a native individual with income yi is Ui(yi) = a0i (Ni)λ Qi = a0i (Ni)λ yi Pi (3.3)
,whereNi is the population of country iincluding immigrants from the rest of world and
λ captures the congestion effect of population. A key implication of this assumption is that preferences exhibit love of variety: given one’s income and goods, the individual’s utility increases when the set of goods Ωj increases. Thus, immigrant entrepreneurs affect
the equilibrium set of varieties and have a welfare effect through this channel.
B. Production
There is a continuum of firms run by entrepreneurs, and each chooses to produce a different variety ω ∈ Ω. Production requires only labor which is inelastically supplied by workers. Firm production technology is a product of firm specific and sector pro-ductivity. The output exhibits increasing return to scale with respect to labor used:
qi(ω) = Aφ(ω)lγi, γ > 1, whereA and φ(ω) represent sector and firm specific
productiv-ity. A firm with productivityφ in countryimaximizes its profits by making decisions on sales in every market,
πi(φ) = max pij X pijqij −wili (3.4) s.t. X j τijqij =Aiφlγi qij =RjPjσ−1p −σ ij
,where τij is iceberg trade cost of variety exporting to country j and qij is the quantity
of the variety. Varieties are tradable but the final goods are not. Trade is subject to the iceberg costs: τij ≥ 1 units of any variety must be shipped from country i for one unit
to arrive in country j. We assume τii = 1 for all I countries and the triangle inequality
holds: τij ≤τikτkj for alli, j, k ∈I. We exclude multinational production and thus labor
used in production only consists of immigrant and native residents. First order condition reveals the pricing rule of a firm over markets in different countries, pij =τijpii. Given