Persistent link:
http://hdl.handle.net/2345/bc-ir:107100
This work is posted on
eScholarship@BC
,
Boston College University Libraries.
Boston College Electronic Thesis or Dissertation, 2016
Copyright is held by the author. This work is licensed under a Creative Commons Attribution-NonCommercial-NoDerivatives 4.0 International License (http://
creativecommons.org/licenses/by-nc-nd/4.0).
The Effect of a Data-Based Instructional
Program on Teacher Practices: The
Roles of Instructional Leadership, School
Culture, and Teacher Characteristics
Boston College
Lynch School of Education
Department of
Educational Research, Measurement, and Evaluation
THE EFFECT OF A DATA-BASED INSTRUCTIONAL PROGRAM
ON TEACHER PRACTICES:
THE ROLES OF INSTRUCTIONAL LEADERSHIP, SCHOOL
CULTURE, AND TEACHER CHARACTERISTICS
Dissertation by
BETH A. MORTON
submitted in partial fulfillment of the requirements for the degree of
Doctor of Philosophy
© Copyright by Beth A. Morton 2016
ABSTRACT
THE EFFECT OF A DATA-BASED INSTRUCTIONAL PROGRAM ON TEACHER PRACTICES:
THE ROLES OF INSTRUCTIONAL LEADERSHIP, SCHOOL CULTURE, AND TEACHER CHARACTERISTICS
Beth A. Morton Henry I. Braun, Chair
Data-based instructional programs, including interim assessments, are a common tool for improving teaching and learning. However, few studies have rigorously
examined whether they achieve those ends and contributors to their effectiveness. This study conducts a secondary analysis of data from a matched-pair school-randomized evaluation of the Achievement Network (ANet). Year-two teacher surveys (n=616) and interviews from a subset of ANet school leaders and teachers (n=40) are used to examine the impact of ANet on teachers’ data-based instructional practices and the mediating roles of instructional leadership, professional and achievement cultures, and teacher attitudes and confidence.
Survey results showed an impact of ANet on the frequency with which teachers’ reviewed and used data, but not their instructional planning or differentiation. Consistent with the program model, ANet had a modest impact on school-mean teacher ratings of their leaders’ instructional leadership abilities and school culture, but no impact on individual teachers’ attitudes toward assessment or confidence with data-based
instructional practices. Therefore, it was not surprising that these school and teacher characteristics only partially accounted for ANet’s impact on teachers’ data practices.
Interview findings were consistent. Teachers described numerous opportunities to review students’ ANet assessment results and examples of how they used these data (e.g., to pinpoint skills on which their students struggled). However, there were fewer examples of strategies such as differentiated instruction. Interview findings also suggested some ways leadership, culture, and teacher characteristics influenced ANet teachers’ practices. Leaders’ roles seemed as much about holding teachers accountable for implementation as offering instructional support and, while teachers had opportunities to collaborate, a few schools’ implementation efforts were likely hampered by poor collegial trust. Teacher confidence and attitudes varied, but improved over the two years; the latter following from a perceived connection between ANet practices and better student performance. However, some teachers were concerned with the assessments being too difficult for their students or poorly aligned with the curriculum, resulting in data that were not always instructionally useful.
i
ACKNOWLEDGEMENTS
There are many people to whom I owe thanks for supporting me during the dissertation process. First, I would like to thank my committee members who were always willing offer advice on whatever issue had me stuck at the moment. This
dissertation is better thanks to the valuable methodological and substantive expertise of Dr. Lauren Saenz and Dr. Vincent Cho. I also owe tremendous thanks to Dr. Henry Braun, my committee Chair. His thoughtful feedback ensured that my dissertation would not only have a high level of technical rigor, but make a real contribution to the field.
I would also like to extend my gratitude to Dr. Marty West and Corinne Herlihy at the Center for Education Policy Research at Harvard University. This dissertation would not have been possible, nor would it have had such insight, without the opportunity to be part of the evaluation team. Marty, I sincerely appreciate all of your advice and for being an unofficial and invaluable advisor. I also owe thanks to Marty, Corinne, Dr. Barb
Gilbert, and Hilary Bresnahan for their feedback and guidance on my qualitative analysis. Most importantly of all, this dissertation would not have been possible without the support of my family and friends. I would especially like to thank my parents who, as teachers, influenced my choice to pursue a career in education research in the first place. To my mother, thank you for being my resident expert and sounding board for many education related questions. Special thanks are owed to my extended family and friends for their frequent words of encouragement that often came via social media when I was at my peak of procrastination. Finally, thank you to my best writing partner, Sophie.
TABLE OF CONTENTS
ACKNOWLEDGEMENTS ... I
LIST OF TABLES ... VII
LIST OF FIGURES ... IX
LIST OF EXHIBITS ... X
CHAPTER ONE: INTRODUCTION ... 1
THE PROBLEM ... 3
THE ACHIEVEMENT NETWORK ... 6
The i3 Evaluation ... 6
The Intervention ... 7
PURPOSE OF THE STUDY ... 13
Research Questions ... 14
Conceptualizing the Measures ... 16
OVERVIEW OF THE METHODS ... 18
Scale Validation ... 18
Quantitative Analysis ... 19
Qualitative Analysis ... 20
SIGNIFICANCE OF THE STUDY ... 21
CHAPTER TWO: LITERATURE REVIEW ... 23
DEFINING INSTRUCTIONAL DATA USE ... 24
EDUCATIONAL DATA USE IN CONTEXT ... 25
Origins of & Influences on Data Use in Education ... 27
COMPONENTS OF DATA-BASED INSTRUCTIONAL PROGRAMS ... 32
Interim Assessments ... 32
Other Program Components ... 34
RESEARCH ON INTERIM ASSESSMENTS AND OTHER DATA-BASED INSTRUCTIONAL PROGRAMS ... 39
Quasi-Experimental and Experimental Evaluations of Data Use ... 39
iii
School Culture & Instructional Leadership ... 57
Teacher Characteristics: Confidence & Attitudes ... 66
CONCLUSION ... 72
CHAPTER THREE: METHODOLOGY ... 74
MIXED METHODS FRAMEWORK ... 75
EVALUATION DESIGN ... 76
School Recruitment ... 77
School Sample ... 79
DATA COLLECTION & SAMPLES ... 86
Quantitative Data ... 86 Quantitative Sample ... 88 Qualitative Data ... 97 Qualitative Sample ... 98 MIXED-METHODS ANALYSES ... 101 Scale Validation ... 102 Quantitative Analysis ... 105 Qualitative Analysis ... 119
Meta-Analysis & Meta-Inference Validation ... 125
CHAPTER FOUR: QUANTITATIVE ANALYSES & RESULTS ... 127
MISSING DATA ANALYSIS ... 127
Missing Data at Level Two (Schools) ... 127
Missing Data at Level One (Teachers) ... 128
YEAR-TWO TEACHER SAMPLE CHARACTERISTICS ... 130
YEAR-TWO SURVEY SCALE CHARACTERISTICS ... 133
Instructional Leadership (School Level) ... 133
Professional Culture (School Level) ... 134
Achievement Culture (School Level) ... 136
Attitudes Toward Data and Assessment (Teacher Level) ... 136
Confidence in Data Use and Instructional Practices (Teacher Level) ... 137
Instructional Practices (Teacher Level) ... 139
MEASURE VALIDATION ... 142
RESULTS: MAIN RESEARCH QUESTIONS ... 144
Research Question One: Teacher Practice Impact Models ... 147
Research Question Two: School and Teacher Mediator Impact Models ... 155
Research Question Three: Teacher Practice Mediation Models ... 165
Research Question Four: Exploratory Pre-Conditions Model ... 177
SUMMARY ... 180
CHAPTER FIVE: QUALITATIVE ANALYSES & RESULTS ... 184
ANET TEACHERS’ DATA-BASED PRACTICES ... 185
Data Practices... 186
Instructional Planning & Practices... 187
Summary ... 196
ANET TEACHERS’ PERCEPTIONS OF INSTRUCTIONAL LEADERSHIP & SCHOOL CULTURE ... 197
Leadership ... 197
Professional Culture ... 202
Achievement Culture ... 204
Summary ... 205
ANET TEACHERS’ ATTITUDES AND CONFIDENCE RELATED TO DATA-BASED INSTRUCTION ... 207
Attitudes ... 207
Confidence & Skill ... 208
Summary ... 209
ANET TEACHERS’ FEEDBACK ON THE INTERVENTION ... 210
ANet Coaches ... 211
ANet Website & Resources ... 212
ANet Assessments ... 213
v
ANET SCHOOL LEADERS’ PERCEPTIONS OF INSTRUCTIONAL LEADERSHIP
& SCHOOL CULTURE ... 220
Leadership ... 221
Culture... 227
Summary ... 229
ANET SCHOOL LEADERS’ FEEDBACK ON THE INTERVENTION ... 230
ANet Coaches ... 231
ANet Assessments ... 232
Summary ... 235
ANET SCHOOL LEADERS’ PERCEPTIONS OF TEACHERS’ ATTITUDES & CONFIDENCE... 236
ANET SCHOOL LEADERS’ PERCEPTIONS OF TEACHERS’ PRACTICES ... 237
Data Review and Use ... 238
Instructional Planning & Practices... 238
Summary ... 240
QUALITATIVE RESULTS SUMMARY ... 241
CHAPTER SIX: SUMMARY & CONCLUSIONS ... 247
SUMMARY OF KEY FINDINGS ... 248
Research Question One ... 248
Research Question Two ... 251
Research Question Three ... 253
Research Question Four ... 262
Subgroup Variation and Replicability ... 263
VALIDATION OF RESULTS ... 265 Quantitative Results ... 265 Qualitative Results ... 267 LIMITATIONS ... 267 Design ... 268 Data ... 272
Design ... 276
Data ... 278
CONCLUSIONS ... 280
REFERENCES ... 289
APPENDIX A: SAMPLE COMPARISONS ... 310
APPENDIX B: ADDITIONAL MODELS ... 315
RESEARCH QUESTION ONE: TEACHER PRACTICE IMPACT MODELS WITH BASELINE COVARIATE ... 315
RESEARCH QUESTION TWO: WEIGHTED SCHOOL MEDIATOR IMPACT MODELS ... 318
RESEARCH QUESTION THREE: TEACHER PRACTICE MEDIATION MODELS BY SCHOOL READINESS ... 320
APPENDIX C: ACHIEVEMENT NETWORK READINESS SCREENER ... 325
vii
LIST OF TABLES
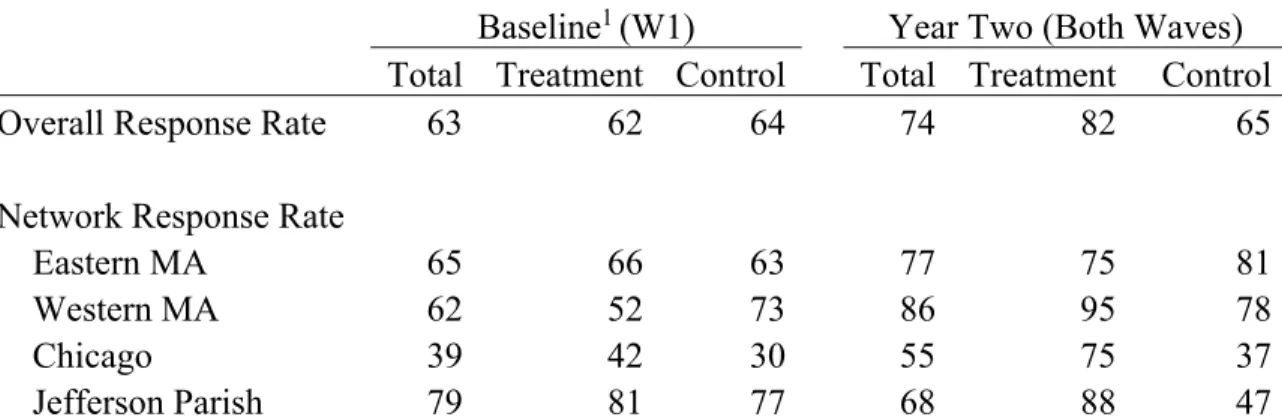
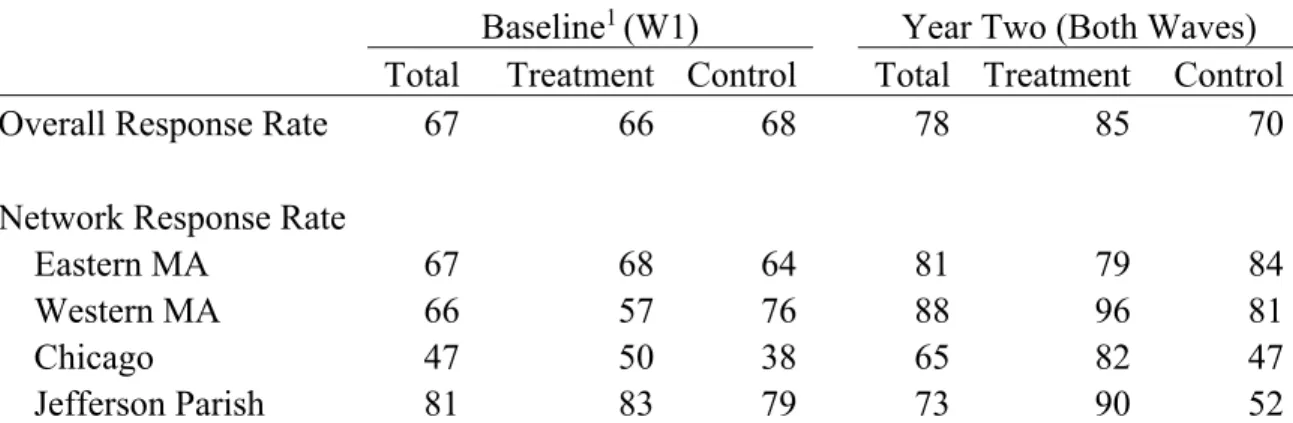
Table 3.1. School Leader Survey Response Rates (Percentages), by Survey Year and
Treatment Assignment ... 89
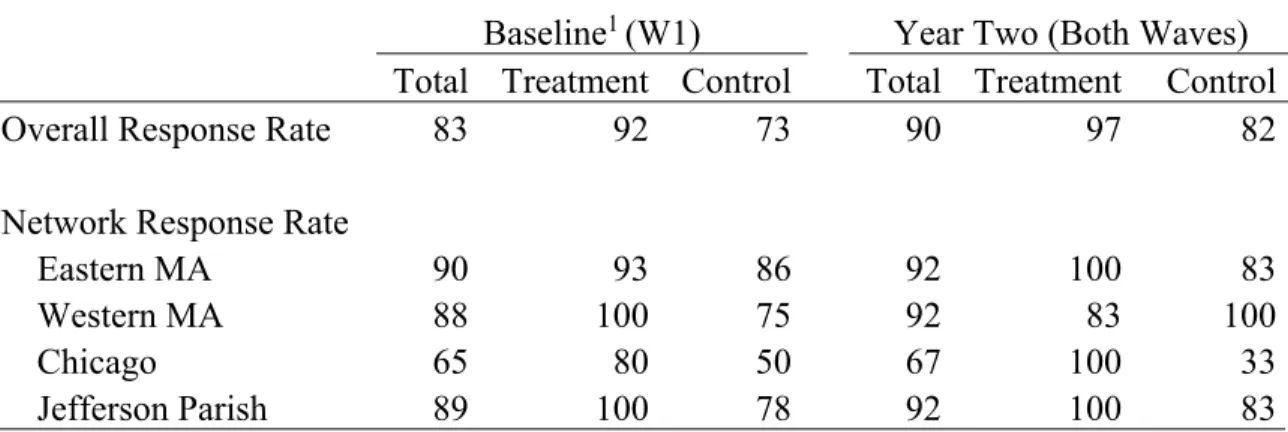
Table 3.2. Unadjusted, In-Scope Teacher Survey Response Rates (Percentages), by Survey Year and Treatment Assignment ... 93
Table 3.3. Adjusted, In-Scope Teacher Survey Response Rates (Percentages), by Survey Year and Treatment Assignment ... 94
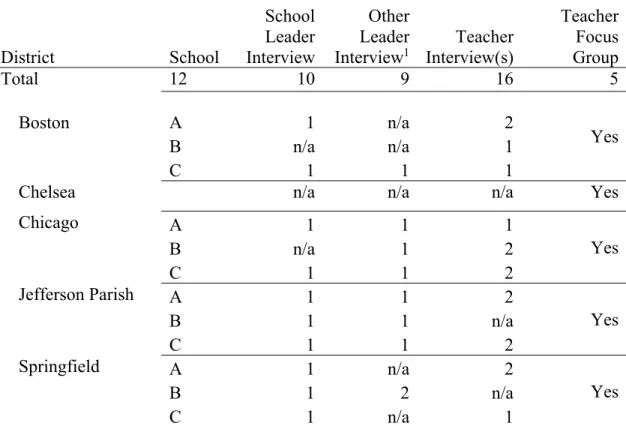
Table 3.4. Type and Number of Year-Two Qualitative Data Points, by District ... 100
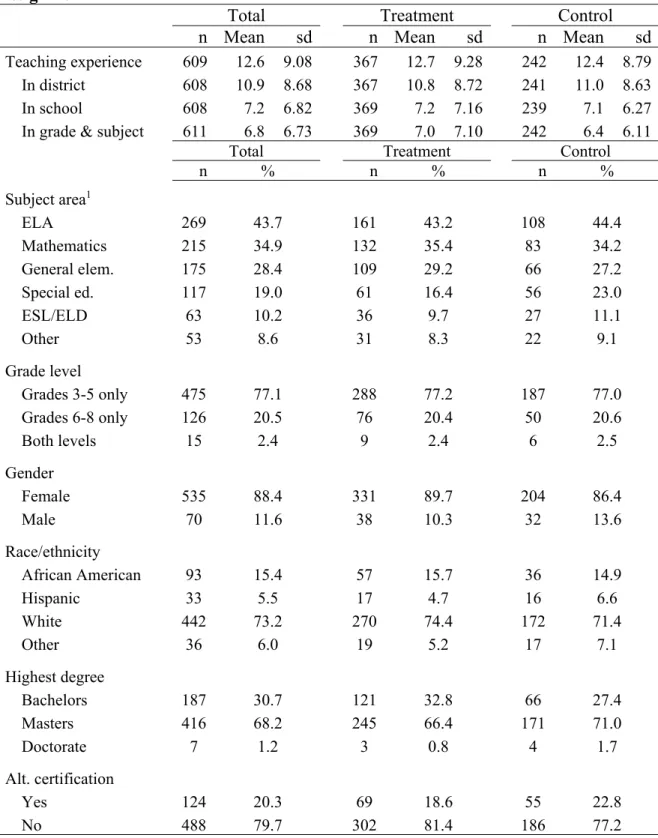
Table 4.1. Year-Two Teacher Descriptive Statistics, Overall and by Treatment Assignment ... 131
Table 4.2. Descriptive Statistics and Reliability for Each Scale or Index ... 141
Table 4.3. Corrected Pairwise Correlations Among School-Level Scales ... 143
Table 4.4. Corrected Pairwise Correlations Among Teacher-Level Scales ... 143
Table 4.5. Intraclass Correlations for Each Teacher Practice Outcome: Unconditional and Conditional on Treatment Assignment ... 145
Table 4.6. Variance Components for Each Teacher Practice Outcome, by Model ... 146
Table 4.7. Teacher Practice Impact Results ... 148
Table 4.8. Teacher Practice Impact Results with Treatment by District Interaction ... 152
Table 4.9. School Mediator Impact Results ... 158
Table 4.10. Teacher Mediator Impact Results ... 160
Table 4.11. Teacher Mediator Impact Results with Treatment by District Interaction .. 162
Table 4.12. Estimates from the Regression of Each Teacher Practice Outcome on Each Hypothesized School- and Teacher-Level Mediator ... 166
Table 4.13. Teacher Practice Mediation Results ... 170
Table 4.14. Teacher Practice Mediation Results with Treatment by District Interaction175 Table 4.15. Teacher Practice Impact Results by Baseline School Readiness Rating ... 179
Table A.1. Baseline Comparison of School Characteristics for Schools that Attritted Prior to Year One and Schools that Remain in Year-Two Sample, by Full Sample and Treatment Sample ... 312
Table A.2. Year-One Comparison of Teachers Survey Scales and Student Achievement Scores for Schools that Attritted After Year One and Schools that Remain in Year-Two
Sample, by Full Sample and Treatment Sample ... 313
Table B.1. Teacher Practice Impact Results with Baseline Covariate ... 317
Table B.2. School Mediator Impact Results, Unweighted and Inverse Variance Weighted ... 319
Table B.3. Teacher Practice Mediation Results for Higher Readiness Schools ... 321
ix
LIST OF FIGURES
Figure 2.1. Tiers of Assessment ... 32
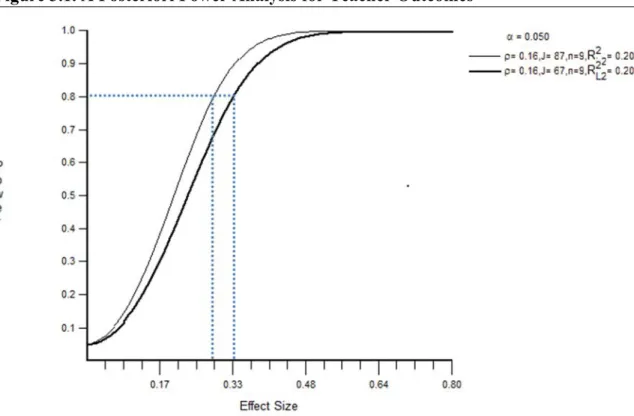
Figure 3.1. A Posteriori Power Analysis for Teacher Outcomes ... 85
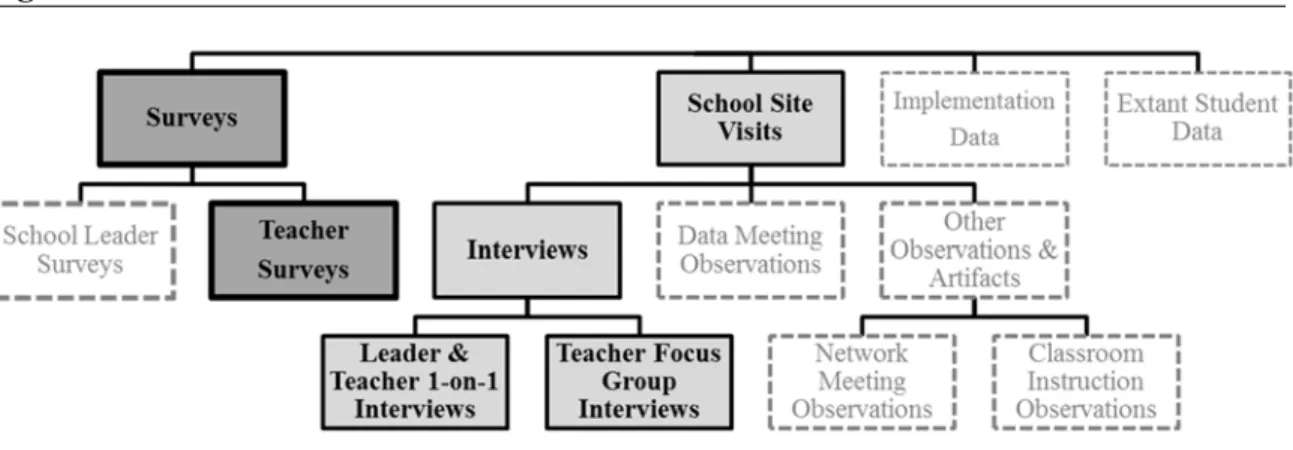
Figure 3.2. Dissertation Data Sources ... 86
Figure 3.3. Direct Effect ... 114
Figure 3.4. Mediation Effect ... 115
Figure 4.1. Interaction Between District and Treatment Assignment, by Teacher Practice Outcome ... 154
Figure 4.2. Interaction Between District and Treatment Assignment, by Hypothesized Teacher Mediator ... 164
Figure 4.3. Interaction Between District and Treatment Assignment for School and Teacher Meditator Models with Data Review as Outcome ... 176
Figure 4.4. Estimates of the Impact of ANet on Each Teacher Practice Outcome, by School Readiness Group ... 180
LIST OF EXHIBITS
Exhibit 1.1. The Achievement Network Logic Model ... 11
Exhibit 2.1. Summary of Quasi-Experimental and Experimental Studies of Data-Based Instructional Interventions ... 47
Exhibit 3.1. Summary of Variables Used in the Quantitative Models ... 107
Exhibit 3.2. Qualitative Codes ... 122
Exhibit 4.1. Year-Two Teacher-Reported Instructional Leaders’ Abilities Items ... 134
Exhibit 4.2. Year-Two Teacher-Reported Common Planning Time Discussion Items . 135 Exhibit 4.3. Year-Two Teacher-Reported General Collegiality Items ... 135
Exhibit 4.4. Year-Two Teacher-Reported Achievement Culture Items ... 136
Exhibit 4.5. Year-Two Teacher-Reported Assessment/Data Attitudes Items ... 137
Exhibit 4.6. Year-Two Teacher-Reported Data Use Confidence Items ... 138
Exhibit 4.7. Year-Two Teacher-Reported Instructional Planning Confidence Items ... 138
Exhibit 4.8. Year-Two Teacher-Reported Data Review Items ... 139
Exhibit 4.9. Year-Two Teacher-Reported Data Use Items ... 139
Exhibit 4.10. Year-Two Teacher-Reported Instructional Planning Items ... 140
Exhibit 4.11. Year-Two Teacher-Reported Instructional Differentiation Items ... 140
Exhibit C.1. Scoring Rubric for Baseline Screener of School Readiness ... 326
1
CHAPTER ONE:INTRODUCTION
Efforts to promote the use of student assessment data to inform teachers’ instructional decisions are widespread. These efforts are not unique to the classroom; they are part of a larger movement toward using data to improve educational decision making at all levels of the system. The trend stems from a focus on accountability-driven strategies to improve student achievement in American schools (Dembosky, Pane, Barney, & Christina, 2005; Marsh, Pane, & Hamilton, 2006; Christman, et al., 2009; Bulkley, Oláh, & Blanc, 2010; Faria, et al., 2012; Hargreaves & Braun, 2013); an imperative both in terms of improving education quality and closing achievement gaps. However, the strategies that emphasize teachers’ use of student data to achieve these ends have attracted some criticism. Specifically, the implementation of these data-driven strategies is occurring despite limited empirical knowledge of whether and how they contribute to changing teacher practices and improving student outcomes (Carlson, Borman, & Robinson, 2011; Cordray, Pion, Brandt, Molefe, & Toby, 2012;
Konstantopoulos, Miller, & van der Ploeg, 2013).
One strategy to improve teaching and learning is the administration of interim assessments – assessments given at regular intervals during instruction to gauge students’ progress toward mastering content standards and to inform educators’ instructional decisions at the classroom, school, or district level (Perie, Marion, & Gong, 2009). Despite a common purpose, interim assessment programs may differ in the types of products and supports that are provided to educators. Some program providers supply only the assessments, where others offer complementary services such as training or
professional development, coaching in data use and instructional strategies, and supplemental materials such as sample lesson plans or curriculum alignment guides.
The Achievement Network (ANet), a Boston-based organization, provides all of these services as part of their “data-based instructional program.” In 2010, ANet was awarded a U. S. Department of Education Investing in Innovations (i3) development grant to subsidize the expansion of its program, as well as to inform program developers and the wider education community on effective data-based instructional practices. To achieve the latter, ANet partnered with the Center for Education Policy Research (CEPR) at Harvard University which conducted an independent evaluation of the program.
This dissertation draws on data from the i3 evaluation of ANet’s data-based instructional program to examine how instructional leadership, school culture, and teacher characteristics are related to the use of interim assessment data and instructional practices. Leadership refers specifically to the subset of practices performed by
instructional leaders that support the improvement of teaching and learning. The aspects of school culture that are the focus of this dissertation include teacher professional culture and the presence of a culture of achievement. Also of interest are the roles played by individual teacher attitudes toward, and confidence in, using interim assessment data and various instructional planning strategies. As chapter two illustrates, each of these is frequently cited as potential mediators of instructional data use in observational research.
3 THE PROBLEM
The use of data to improve outcomes is a growing trend in many industries, including business, health care, and government. Advances in technology have improved the collection and analysis of data, as well accountability and transparency within these sectors (Howard, 2012). With the current strong focus on accountability, it is not
surprising that this trend has extended to the U.S. education system. Fueled by mandates such as No Child Left Behind and programs like Race to the Top, data are an integral component of monitoring progress in our current education accountability systems (Wayman, 2005; Halverson, Grigg, Prichett, & Thomas, 2007; Mandinach & Honey, 2008; Mandinach, 2012). Data influence decision-making at all levels of education: from system-level decisions about funding and resources, to classroom decisions about
instruction and student placement.
In classrooms, teachers have long used the results of class assignments,
homework, and informal assessments to judge their students’ understanding of topics and make adjustments to their teaching. However, the increased focus on data-driven
decisions and accountability for student achievement has formalized the use of external, standardized assessment programs. Many schools are adopting interim assessment programs that include a series of periodic assessments – often in mathematics and English-language arts – that are aligned to content standards and paired with training for school leaders and teachers. The intention is to build educators’ capacity to use data to improve instruction.
Despite their prevalence, the evidence of whether and how interim assessment programs and related data-driven practices impact teacher practices and student outcomes is relatively sparse. Few studies have utilized designs that are strong enough to make causal linkages between interim assessment programs and changes in teacher instruction and student achievement. Two quasi-experimental studies found no evidence of a relationship between interim assessment practices and student outcomes (Henderson, Petrosino, Guckenburg, & Hamilton, 2007; 2008; Quint, Sepanik, & Smith, 2008).
Findings from studies of interim assessment programs that employed stronger empirical designs have been mixed. Some have found an effect on certain teacher outcomes, but no overall effect on student outcomes (Cordray, Pion, Brandt, Molefe, & Toby, 2012; Randel et al., 2011; Cavalluzzo, et al., 2014). Others found positive and/or negative effects on achievement in certain grades and subjects (Konstantopoulos, Miller, & van der Ploeg, 2013; Carlson, Borman, & Robinson, 2011; Konstantopoulos, Miller, van der Ploeg, & Li, 2014, 2016). However, these experimental studies failed to collect (or report) data on implementation fidelity or contextual conditions that would improve our understanding of the mediating mechanisms by which interim assessment programs and related data-driven practices impacted, or failed to impact, teacher practice and student achievement.
The presence of an interim assessment program is unlikely to impact student outcomes on its own; conditions that facilitate analyzing, interpreting, and using data are likely necessary. Many observational studies have hypothesized that the factors
5
professional support (i.e., professional development and coaching) as well as
characteristics of schools, leaders, and teachers. While prior research on effective data use supports makes note of “best practices,” there is little evidence of a causal connection between various types of support and effective instructional data use practices or higher student achievement. Observational evidence suggests that the frequency of coaching around data use is associated with teachers’ self-reported changes in instructional practice, their likelihood of attributing instructional changes to coaching, and small increases in student reading and math achievement (Marsh, McCombs, & Martorell, 2010). Numerous other descriptive studies indicate a relationship between characteristics of school culture, leadership, and teachers and the use of student assessment data for instructional purposes (e.g., Dembosky, et al., 2005; Marsh, Pane, & Hamilton, 2006; Christman, et al., 2009; Goertz, Oláh, & Riggan, 2009a; Faria, et al., 2012; Datnow & Park, 2014).
In summary, the field lacks evidence linking interim assessment programs, teachers’ data use and instructional practices, and student achievement. Specifically, it remains unclear what school conditions and teacher characteristics mediate the impact of interim assessment programs on teaching and learning. The adoption of data-based instructional strategies is outpacing evidence that shows whether and how they impact teacher and student outcomes.
THE ACHIEVEMENT NETWORK
The Achievement Network (ANet) is a Boston-based non-profit that provides its data-based instructional program to schools that serve high-need students in grades 3-8. Its mission is to help teachers use interim assessment data to identify and close
achievement gaps. ANet was founded in 2005 when it began working with a small group of charter schools in Boston. By the start of the 2015-16 school year, the program was serving over 500 schools in ten geographic networks across the United States
(Achievement Network website, 2015).
The i3 Evaluation
Combining interim assessments aligned to content standards with data tools and analysis protocols, coaching, and networking opportunities, ANet’s data-based
instructional model is an example of a comprehensive, data-driven instructional initiative in use in schools nationwide. In 2010, CEPR began a five-year, i3-funded evaluation which utilized a matched-pair school-randomized design to examine the effect of ANet on student achievement in mathematics and English language arts in grades three through eight. The evaluators utilized a mix of survey-based quantitative data and school site visit-based qualitative data to examine the intermediate effects on leader and teacher practices and school outcomes. Surveys were administered to all eligible school leaders
7
and teachers in both treatment and control schools; whereas, qualitative site visits were
conducted in a subset of treatment schools in each of four geographic school networks.1
Schools were recruited from five mid- to large-size urban districts: Boston (MA), Chelsea (MA), Springfield (MA), Jefferson Parish (LA), and Chicago (IL). Individual elementary and middle schools in these districts were invited to apply to receive ANet services at a rate that was subsidized by the i3 grant. All schools were screened on criteria thought to facilitate successful implementation of the program: e.g., leadership capacity and support, and school priorities for a standards-based curriculum and time for teacher collaboration. Although the racial and ethnic composition of the students enrolled in these schools varied across districts, all of the schools served high proportions of students eligible for a subsidized lunch and who were not performing at proficient levels on state math and reading assessments.
The Intervention
As part of the evaluation design process, the i3 program officers asked each grantee to develop a logic model for its program. The concept of a logic model originates from program theory evaluation; a type of evaluation that is focused on testing “an explicit theory or model of how the program causes the intended or observed outcomes” (Rogers, Petrosino, Huebner, & Hacsi, 2000, p. 5). In this way, logic models are useful
1 The schools in the sample represent five school districts, but are part of four geographic “networks”:
Boston and Chelsea are part of the Eastern Massachusetts network, Springfield participates in the Western Massachusetts network, Jefferson Parish is a part of the Louisiana network, and Chicago schools are part of the Illinois network. Networks consist of i3 and non-i3 schools; not all of the ANet-partnered schools in each network participated in the study.
tools for evaluation because they make manifest program theory (Bickman, 2000). A logic model represents a hypothesis for program processes; i.e., how the program inputs are expected to influence the intended outcomes (McLauglin & Jordan, 1999).
The ANet data-based instructional program is a whole-school – and increasingly whole-district – reform model designed to embed data-driven decision-making in school leaders’ and teachers’ everyday practice. Their logic model specifies the hypothesized pathways by which program inputs support more effective use of interim assessment data and increase student achievement (Achievement Network, 2012). It is important to note that the logic model for ANet is not fixed, but is based on a program theory of action that is continually evolving from the lessons learned by the organization. The ANet program model presented here reflects the organization’s thinking at the start of year two of implementation; the year in which analyses in this study are focused.
The ANet logic model includes: the inputs or resources provided as part of the
program, the activities that are necessary to achieve the intended outcomes, and the
expected outcomes of the program (categories adapted from McLauglin & Jordan, 1999).
Specifically, the logic model first documents the inputs of this program: 1) quarterly
interim assessments, 2) logistical support, 3) professional development, and 4) school
networking opportunities (exhibit 1.1). It also summarizes the activities (actions and
structures) by which these four inputs are hypothesized to lead to outcomes of improved
student achievement.
Prior to the school year, ANet works with districts and schools to develop interim assessments that are aligned with their curriculum and curricular scope and sequence.
9
ANet also sets a schedule for assessment administration and regular coach visits at key points in data cycle such as planning and data review. Coaches work to build school leaders’ capacity to support teachers’ data-based instructional practices. After the interim assessments are administered and student results are returned, schools hold data
meetings. In these meetings, teachers analyze their students’ data and plan instruction to meet identified learning gaps. The ANet coach is present to support this work, but the intention is that it is led by school leaders and data leadership team members. Initially, meetings are scheduled for a three-hour block – typically at the end of the school day. Over time, however, data meetings may change format; for example, they may take place during grade-level common planning time. Elements of the program logic model are detailed below as they are intended to be implemented. Appendix D provides a glossary of key ANet terms.
Intervention Inputs. The core inputs are quarterly standards-aligned assessments
in English Language Arts and mathematics in grades 3 through 8 that are administered at
regular intervals during the school year (Aligned Assessments).2 Within 48 hours of
sending completed assessments to ANet, school leaders and teachers receive students’ results via an online platform called MyANet. Reports provide aggregate results at the network, school, grade, and classroom level, and teachers receive student-level results that detail strengths and misunderstandings at the item and standard level. The MyANet online platform also provides teachers with resources on planning and instructional tools
2 Over the course of the evaluation, the program’s interim assessments shifted from aligning with state
content standards to Common Core State Standards, as appropriate within each state. However, the evaluation did not validate this through an alignment study.
such as schedules of standards to be covered on future interim assessments,
misconception guides, templates for planning their reteaching, and a quiz building tool (Logistical Support).
Considered to be the program’s chief “value-add” over other programs, ANet data coaches visit schools an average of 19 times per school year at key points in the data cycle (e.g., pre-assessment planning, when results are released, and after reteaching has occurred). The total number of visits may be higher or lower depending on individual school needs. Most school visits involve coaches and school leaders, and focus on supporting leaders’ data-based work with teachers. During group data meetings, coaches meet with teachers, supported by a school-based data leadership team, to coach them on how to analyze the data for patterns in responses, use the data to draw conclusions about their students’ performance on particular standards, skills, or subskills, and develop reteaching plans to address identified learning gaps (Training and Coaching).
Another of the more unique aspects of ANet is the geographically connected networks of participating schools. ANet reports show schools’ performance on the interim assessments relative to other schools in the network. The school data teams are invited to participate in two annual meetings of schools in their network. These network events are an opportunity for professional development, but they also provide the opportunity to learn and share successful practices (Network Activities).
11
Exhibit 1.1. The Achievement Network Logic Model
Leader Actions. With these inputs in place, the ANet model is focused on
building leadership capacity in five key areas. First, school leaders are supported by ANet coaches in making data use a priority and engaging directly in data work in their schools. Leaders are expected to build a positive school-wide culture of achievement, manage the implementation of the data cycle, develop teachers’ data-driven skills and practices, and reflect on student and school progress, taking action where needed. ANet’s approach to coaching aims to build leader capacity; the intent is that desired actions are modeled by the ANet coach, eventually becoming the practice of the school leader and data
leadership team.
School Structures. ANet also works with school leaders to put structures in place
that facilitate program implementation. School leaders establish a data leadership team, typically including themselves, an assistant principal, and grade-level or content-area instructional leaders. With help from their ANet coach, the data leadership team is expected to lead and support teachers’ data-based practices. School schedules are arranged to include time for activities such as teacher collaboration around data, and planning for and carrying out reteaching. Leaders also ensure that the assessment cycle is aligned to curricular resources and planning. Finally, they must maintain an accurate student data system that supports the adoption of the assessment cycle.
Teacher Actions. Leaders and ANet coaches support teachers in using data to
gauge student progress and adjust teaching. Teachers are expected to use backward planning to align their instruction to state content and performance standards. The goal is to develop a planning cycle that focuses on instructional alignment and rigor. Teachers
13
are also expected to analyze assessment results to determine students’ progress toward standards and to use this information to develop and implement reteaching plans that address students’ gaps in knowledge. Once they have implemented these reteaching plans, teachers are encouraged to reassess and reflect on their impact on student learning.
Student Actions and Outcomes. Through the sharing of interim assessment
results, it is expected that students will exhibit greater motivation to learn, as well as the ability to articulate their own performance goals and plans to achieve them. The primary outcome of interest for the i3 evaluation was higher state summative assessment scores in math and reading. However, it is expected that any short-term impacts on test scores will translate into improvements in longer-term student outcomes, such as high school
graduation and post-secondary success.
PURPOSE OF THE STUDY
This study draws on an existing dataset from the larger i3 evaluation of the Achievement Network’s data-based instructional program to examine whether and how the program impacts teacher practices. The purpose of this study is to explore the process of instructional data use, conditions that may mediate this process, and the relationship between these potential mediators and teacher practices. The process of instructional data use by teachers is said to be under-conceptualized, taking place within a black box (Black & Wiliam, 1998; Little, 2012; Spillane, 2012). Opening the black box is key to
understanding the impact of data-based instructional programs on teachers and students, and improving the effectiveness of these programs.
Research Questions
The conceptual framework for this study builds on the program processes
described by the logic model. The study’s purpose to explore this conceptual framework; specifically, the potentially mediating roles of school culture, instructional leadership, and teacher characteristics in the relationship between the implementation of a data-based instructional program and teachers’ data use and instructional practices. The research questions are:
1. Are teachers’ data use and instructional practices different in ANet (treatment)
schools from those in control schools?
2. Are levels of school culture, instructional leadership, and teachers’ attitudes
towards and confidence with data-based practices (hypothesized mediators) different in ANet (treatment) schools from those in control schools?
3. Do the hypothesized mediators account for differences in ANet and
control-school teachers’ data use and instructional practices?
4. Does the effect of ANet on teachers’ data use and instructional practices vary by
schools’ baseline implementation “readiness” ratings?
The first two research questions exploit the randomized design to examine the effect of ANet on school culture, instructional leadership, teacher characteristics, and teacher practices. These questions focus on whether ANet has an effect on the proposed mediators and teacher practice outcomes highlighted after adjusting for various observed school and teacher characteristics. It is important to note that the counterfactual is not the
15
absence of data-based instructional practices. Since all control schools were known to have interim assessments in some grades and subjects, as well as varying types of support, any differences that are found would represent the unique effects of ANet over other data-based practices.
The third and fourth research questions move beyond the more evaluative question of whether the program has the intended effect on teachers’ data-based
instructional practices. They offer insight into the “black box” by providing evidence of whether and how school leadership and culture, and teacher characteristics facilitate (or possibly inhibit) the relationship between a data-based instructional program and teacher practices. Specifically, research question three examines whether certain school-level conditions – considered important both by ANet and the larger field – and teacher characteristics predict or explain teachers’ data-based instructional practices.
Research question four examines whether baseline school characteristics moderate the effect of ANet on teachers’ data use and instructional practices. During recruitment, schools’ “readiness” to implement ANet was assessed on nine categories (see chapter 3, “School Recruitment”) using a survey collected from all schools. The subscores across the most relevant subset of these categories were used to classify schools into “higher” and “lower” categories. Models taking into account the school’s readiness score at baseline provide evidence of whether the ANet program is more or less effective in schools with varying levels of readiness.
Conceptualizing the Measures
The focal measures in this dissertation are not new to the research on interim assessment. However, their definition and operationalization vary widely across studies. Defined briefly in this section, each of these measures is fully explored in chapter two, including a discussion of relevant prior research.
Instructional leadership is primarily concerned with the role of the principal or
other school leaders in defining and managing the school’s mission and goals; managing instruction through supervision, coordinating the curriculum, and monitoring student progress; promoting a positive learning climate by protecting instructional time and professional development; maintaining visibility; enforcing academic standards; and providing incentives to students and teachers (Hallinger & Murphy, 1985). In this study, instructional leaders are hypothesized to play a key role in teachers’ adoption of data-based instructional practices.
School culture is an important factor in the adoption of new programs. It has been characterized by “a set of beliefs, values, and assumptions that participants share.” (Page, 1987, p. 82) This dissertation focuses on two aspects of school culture: teacher
professional culture and the presence of a culture of achievement. First, the beliefs,
values, and habits of communities of teachers can be said to constitute their professional
culture or a school’s culture of teaching (Hargreaves, 1994). A school’s culture of
teaching facilitates the transmission of norms through shared discussions of teaching practices, occasions to observe one another’s work, and collaborations around planning, selecting, or designing teaching materials (Hargreaves & Dawe, 1990). Distinct from
17
teacher professional culture, a school’sachievement culturerelates to its focus on clear
goals, high academic standards and expectations for student performance, as well as frequent monitoring of teacher efficacy and student progress toward meeting these goals (Purkey & Smith, 1983; Zigarelli, 1996).
This study also examines the roles played by teachers’ attitudes or beliefs, and
confidence around instructional data use and the adoption of data-based instructional
practices. Prior research has examined educators’ perceptions of data as a valid, reliable and useful tool for improving instructional practice. Data quality issues and perceived barriers, such as the time commitment required for analyzing and using assessment results to inform instruction, have also been explored in the research (Luo, 2008;
Wayman, Cho, Jimerson, & Spikes, 2012). Teachers’ skills and facility with assessment and assessment data are often labeled pedagogical data literacy (Mandinach, Gummer, & Muller, 2011; Mandinach & Gummer, 2013). Pedagogical data literacy is a skill set that combines teachers’ knowledge and use of assessment data with their content area
expertise to inform and improve their teaching practice. Although this study lacks a direct
measure of teachers’ data literacy, respondents’ confidence in data use and instructional
planning are hypothesized to be related to data literacy.
Data-based instructional practice, or instructional data use, is regarded as the process of reflecting on student data as a way to improve teaching and learning through specific goals and actions (Halverson, Grigg, Prichett, & Thomas, 2007). Importantly, this definition highlights two separate practices. First, it encompasses analytic activities such as reviewing and analyzing interim assessment results to identify gaps in students’
knowledge (e.g., data review and data use). From that follows an instructional response: identifying and implementing appropriate instructional interventions to address students’
learning gaps (e.g., instructional planning and instructional differentiation). Each of
these practices were shown to be positively related to students’ math and reading achievement in the larger i3 evaluation (West, Morton, & Herlihy, 2016).
OVERVIEW OF THE METHODS
This study utilizes quantitative and qualitative data from the larger i3 evaluation for a secondary mixed methods analysis of the ANet program on teachers’ data use and instructional practices. Given the nature of the research questions, this study relies predominantly on year-two survey data. The year-two data are used because of the expectation that an intensive program, such as ANet, would take at least two years to be fully implemented. Due to high levels of school leader survey nonresponse (discussed in chapter three), the primary data source for the quantitative analyses in this study is the year-two teacher surveys (n = 616). The quantitative results for each of the research questions are supported by an analysis of qualitative site visit interview data. This mixed methods approach to data analysis provides a depth of understanding that could not be achieved by quantitative analysis alone (Sammons, 2010).
Scale Validation
This study was conducted in parallel with the larger evaluation on which I was the lead analyst (under the direction of the Principal Investigator). Because of my interest in
19
exploring the relationships between measures of school culture, instructional leadership, and teacher characteristics, and teachers’ data-based instructional practices, I had the opportunity to use data from baseline and year-one surveys to improve upon the
measurement of these focal constructs in the year‐two survey. Although the dissertation
does not include a complete discussion of the survey revision work, chapter four reviews the characteristics of the revised year-two scales that measure instructional leadership, school culture, teachers’ attitudes towards and confidence with various data-based practices, and the frequency of teachers’ data use and instructional practices. Details are provided on the items within each scale, the overall scale reliabilities, and their
validation.
Quantitative Analysis
Given the nested design of the study, the analysis of survey data to estimate the effects of ANet uses multilevel regression modeling (MLM). Failure to model the nesting of teachers within schools can lead to violations of the assumptions of homoscedasticity and independence appropriate to the use of ordinary least squares (OLS) regression, increasing the likelihood of type I errors. Multilevel modeling addresses the issue of correlated errors by modeling the relationship at the various levels of the data (e.g., school and teacher) instead of constraining the model to a single level (as in OLS). The estimation procedures used in multilevel modeling generate standard errors that are not inflated due to nesting (Bickel, 2007).
Qualitative Analysis
After completing the quantitative analyses, all leader and teacher interview transcripts were fully coded and analyzed. A first round of coding identified portions of leader and teacher interviews that address the focal measures and research questions in this study (Leech & Onwuegbuzie, 2008; Saldaña, 2009; Hesse-Biber, 2010). The second round of coding entailed both finer-grained coding and analysis. Coding was informed by a conceptual framework developed from the ANet logic model and prior research.
Operationally, the second round of coding utilized a constant comparative approach to extract themes and provide explanations for the quantitative results (Leech &
Onwuegbuzie, 2008).
The mixing of analytic strategies is meant to take advantage of the strengths of both methods (Teddlie & Tashakkori, 2003; Johnson & Onwuegbuzie, 2004) and maximize the likelihood of collecting evidence of the relationship between school culture, teacher characteristics, and teachers’ instructional practices. The “mixing of methods” takes place at the interpretation stage. Given the causal nature of research questions, the results from the quantitative analyses take precedence. The qualitative results serve to explain the quantitative findings and provide explanatory context. In particular, they: 1) provide context for the impacts, or the lack thereof, on the teacher practices and key mediators in this study, 2) explore the validity of the conceptual framework and causal linkages (Yin, 2009), and 3) offer evidence of why ANet may be more effective at changing teachers practices in some contexts than others.
21 SIGNIFICANCE OF THE STUDY
A very considerable amount of time and resources are spent each year on data-based instructional strategies, including interim assessments (Lazarin, 2014; Hart, et al., 2015). In fact, evidence suggests that district-mandated tests – such as interim
assessments – make up a larger proportion of testing time than state tests, especially in urban districts (Lazarin, 2014). This is despite the fact that empirically sound research on the impacts of these practices is sparse and results are varied. Given the recent call by the Obama administration to reduce time spent on testing in American schools and a
provision to allow states to set limits on time spent on testing as part of the Every Student
Succeeds Act (ESSA), evidence of the quality of interim assessments and their utility in improving teaching and learning may become more important than ever (U.S. Dept. of Education, Fact Sheet, 2015; ESSA, 2015).
This study addresses two main problems in the current research on interim assessment and data-driven instruction. First, it fills an empirical need for research on interim assessment programs and data-driven instructional practices that combines empirically sound research designs with rich process and outcome data. This design allows for the study to explore the data-based instructional process and address major gaps in our current understanding of whether and how data-based initiatives have an impact on teachers’ practices. In particular, the study explores the oft-cited, but not well-understood roles played by certain school conditions and teacher characteristics. The combination of quantitative and qualitative evidence, collected as part of a randomized
evaluation, provides a unique opportunity to address the empirical and substantive gaps in prior research on teachers’ data-based instructional practices.
To make findings more useable, some have suggested that researchers align their work with the current challenges that administrators are facing (Honig & Coburn, 2007). In terms of its practical importance, the hope is that the results of this study will provide district- and school-level practitioners and policymakers looking to implement data-based instructional strategies with useable insights on where and how to focus their energies in order to foster change without unintended, negative consequences for teachers and students. In the longer term, the results have the potential to inform the development of interim assessment programs; specifically, implementation and training targeted to the conditions in schools and characteristics of educators that support the adoption of effective data-based instructional practices.
23
CHAPTER TWO:LITERATURE REVIEW
The use of student data has become widespread despite a limited body of
evidence linking specific programs, conditions, or practices to improvements in teaching and learning. This dissertation explores the impact of the Achievement Network’s (ANet) data-based instructional program on teachers’ data use and instructional practices. On a broader level, it also explores the process of instructional data use and how the adoption of data-based instructional practices is related to instructional leadership, school culture, and teacher characteristics.
This chapter provides a review of relevant prior research and a summary of the contribution of this study to the field. It begins by defining the concept of instructional data use, the key outcome of interest in this study. Next, the context for instructional data use is set within a discussion of current accountability systems in education. Components of data-based instructional programs are briefly discussed, though the formal review of prior research begins with a reflection on recent quasi-experimental and experimental studies of the data-based instructional programs most like the ANet. Although the outcomes of these studies are most often student achievement, the variation in results is an argument for exploring intermediate impacts such as teachers’ instructional data use and the conditions that may affect these practices. Consequently, research on the potential mediators of instructional data use that are central to this study, namely instructional leadership, school culture, and teacher attitudes toward and confidence using data, are explored in the final section.
DEFINING INSTRUCTIONAL DATA USE
Some suggest that programs such as ANet can contribute to student learning by supporting a system of organizational learning or continuous improvement (Bulkley, Oláh, & Blanc, 2010; Halverson, 2010). Models of continuous improvement of
instruction typically include the steps of: 1) planning or goal setting based on standards, 2) providing instruction, 3) assessment of learning, 4) analysis and use of assessment results, 5) planning and reteaching, and 6) reassessment (Deming, 1993; Datnow, Park, &
Wohlstetter, 2007; Flumerfelt & Green, 2013).1 Embedded in this cycle is instructional
data use which comprises two distinct, but related practices which are the focus of this dissertation: (1) data analysis and use and (2) instructional planning and remediation. It involves using student assessment results to identify areas of student need and improve teaching and learning by implementing appropriate instructional actions or responses (Faria, et al., 2012). In the larger i3 evaluation, the frequency with which teachers reviewed and used student data, used various instructional planning strategies, and used instructional differentiation were each positively related to students’ math and reading achievement scores (West, Morton, & Herlihy, 2016).
Reflecting on student data consists of a variety of tasks such as reviewing and making sense of data, alone or collaboratively, with the purpose of informing
instructional actions (Faria, et al., 2012). Data review and reflection requires skills such as knowing and being able to navigate data reports, accessing and synthesizing available
25
forms of student data, understanding which data are appropriate to answer particular instructional questions or guide instructional decisions, reviewing and analyzing student data to identify the instructional needs of specific students or groups of students (e.g., gaps in learning, misconceptions), and communicating accurate results and inferences to team teachers, school leaders, or other stakeholders (Faria, et al., 2012; Mandinach, 2012).
Instructional actions refer to the way teachers respond to the “knowledge and information generated by their review of student data” (Faria, et al., 2012, p. 14) including judgments about (1) the use of instructional time; (2) allocating additional instruction for individuals or groups students who are struggling with particular topics; (3) addressing students’ weaknesses with instructional interventions; (4) gauging overall instructional effectiveness of classroom lessons, and (5) refining instructional methods by selecting instructional approaches that address the situation identified through the data (Hamilton et al., 2009). Examples include establishing or adjusting student groupings, changing the curricular scope, sequence, or pacing, altering instructional strategies or materials, adjusting or reteaching particular lessons to address students’ skills gaps, and providing supplemental resources to targeted students (Heritage, Kim, Vendlinski, & Herman, 2009; Coburn & Turner, 2011; Faria, et al., 2012).
EDUCATIONAL DATA USE IN CONTEXT
While the focus of this dissertation is on classroom-level use of interim
data-driven decision making (DDDM) in public education. The phrase is used to describe decision-making processes at all levels of the education system that are informed by various sources of data. DDDM involves the systematic and ongoing collection, analysis, interpretation, and use of educational data for various ends such as improving instruction, better allocating resources (i.e., material and human capital), and informing policies (Mandinach, 2012). Since DDDM can be used at every level and in every role, it
incorporates a variety of educational data from student assessments and demographics, to administrative, financial, personnel, and multiple other data sources (Mandinach, 2012).
Despite its growing prevalence, data use in education is not a new practice and has its roots in the growth of measurement and accountability for student achievement (Dembosky, et al., 2005; Marsh, Pane, & Hamilton, 2006; Christman, et al., 2009; Bulkley, Oláh, & Blanc, 2010; Faria, et al., 2012). However, recent trends in
accountability policies have provided the impetus for a more formal process of data use, including a more systematic use of external, standardized assessments as a key source of data on student learning. Data use and accountability have become “inextricably” linked (Mandinach & Honey, 2008, p. 2).
There has been criticism over the phrase “data-driven” and some of the practices falling under this umbrella, criticism that highlights the range of these practice.
Specifically, critics of the term contend that to be data-driven both oversimplifies the process and implies one in which data drive the focus of education reform at the macro level and the focus of instruction at the micro level (Shirley & Hargreaves, 2006). Instead, some experts in the field propose that the process should be “evidence
27
informed”: the collection of evidence that informs educational decisions (Shirley &
Hargreaves, 2006; Hargreaves & Braun, 2013). Furthermore, others contend that
although student data are a useful tool, the process should be combined with and guided by values and professional judgment (Hertiage & Yeagley 2005; Shirley & Hargreaves, 2006; Knapp, Copland, & Swinnerton, 2007; Wayman, Snodgrass Rangel, Jimerson, & Cho, 2010; Wayman, Jimerson, & Cho, 2012; Hargreaves & Braun, 2013; Hargreaves, Morton, Braun, & Gurn, 2014). The fact that this argument is part of the conversation on interim assessment programs illustrates the range of philosophies on which these
programs are based: from programmed and prescribed, to adaptable and open to professional judgment.
It is not the purpose of the dissertation or literature review to evaluate where ANet or other data-based instructional programs fall on this range of data-driven or evidence-informed. Throughout this chapter, the terms data-driven or data-based are used to encompass the range of practices and programs related to instructional data use; from the provision of periodic interim or benchmark assessments, to more comprehensive systems that include tools (e.g., protocols and data systems), professional development and support, and new technology (e.g., data dashboards). Whenever possible, characteristics of the programs examined in prior research are described.
Origins of & Influences on Data Use in Education
Utilizing data has become a key practice in almost any industry that values productivity and continuous improvement: public sectors like health care and
government, or private sector business and finance. In setting the context for instructional data use in education, one could argue its evolution has not only been influenced by the advent of high-stakes educational accountability systems, but also by the increasing role of the business sector in educational management (Marsh, Pane, & Hamilton, 2006; Young & Kim, 2010). The private sector has long promoted management systems that monitor productivity, improve performance, and evaluate systems at all levels (Stecher, Kirby, Barney, Pearson, & Chow, 2004). Data have become an important component of these systems; see, for example, the booming industry around “big data.” Successful businesses are said to empower their employees and one way this can be achieved is by providing real-time, relevant data that allow them to take ownership over decision making (Stecher, et al., 2008; Hargreaves, Morton, Braun, & Gurn, 2014). Given evidence of the success of these practices in other industries (Manyika, et al., 2011), policymakers and reformers have advocated for education to adopt similar processes (Tyack, 1995; Stecher, et al., 2008).
Though the influence of the business sector has had an impact, the proliferation of data use in education has had as much to do with test-based accountability policies that are meant to increase student achievement relative to specific content standards. These accountability systems rely heavily on student assessments which have provided a constant stream of achievement data. From the 1970s through the 1990s assessments were used to monitor whether Title I funds were improving the educational outcomes of disadvantaged students, maintain minimum competency for graduation or grade
29
promotion, and ensure schools were achieving high levels of performance to improve global competitiveness (Linn, 2000).
The modern era of test-based accountability was ushered in when the penultimate
reauthorization of the Elementary and Secondary Education Act, the No Child Left
Behind Act (2002) (NCLB), was passed in 2001. NCLB maintained a focus on standards and test-based accountability by setting annual achievement goals aiming, ultimately, at proficiency for all students. Whether schools met these goals was determined by annual testing in English language arts (ELA), math, and science. Schools and districts that failed to meet annual targets (i.e., Annual Yearly Progress) were initially subject to sanctions ranging from providing supplemental services to students, to school
restructuring. NCLB was scheduled for reauthorization in 2007. While the U.S. House and Senate debated proposals for reauthorization, states were granted waivers by the federal Department of Education from some portions of the bill’s original requirements in an effort to avoid further sanctions (U.S. Dept. of Education, ESEA flexibility website, 2014).2
In its signature educational reform effort, the Obama administration earmarked grant funding through Race to the Top (RttT) to encourage education reform through improvements in four key interrelated areas: standards and assessment; data systems, collection, and use; teacher effectiveness; and turning around low-performing schools (U.S. Dept. of Education, RttT Executive Summary, 2009). RttT also included a $350
2 President Obama signed the newest iteration of the bill, called the Every Student Succeeds Act, on
December 10, 2015. The new law upholds the testing requirements of NCLB, but allows states more flexibility to set annual accountability targets which are reviewed by the U.S. Department of Education.
million assessment program competition that funded two multi-state consortia to design assessment systems that include a combination of features such as diagnostic, interim, and summative assessments that are, in some cases, administered in a computer-adaptive format (SMARTER Balanced Consortium website, 2014; PARCC Consortium website, 2014). According to the Department of Education, the intention was to
develop assessments that are valid, support and inform instruction, provide accurate information about what students know and can do, and measure student achievement against standards designed to ensure that all students gain the knowledge and skills needed to succeed in college and the workplace. These assessments are intended to play a critical role in educational systems; provide administrators, educators, parents, and students with the data and information needed to continuously improve teaching and learning…. (U.S. Dept. of Education, RttT Assessment Program website, 2014)
The effectiveness of current accountability systems rests on a theory of action that posits that student achievement will be positively impacted by a system that holds
teachers and school leaders accountable to raising student achievement, as measured by student assessments, and through a series of sanctions and incentives (Hamilton, Stecher, & Klein, 2002). The problem is that an accountability system based on summative assessments that measure achievement against a proficiency benchmark cannot provide school leaders and teachers with timely data at the level of detail necessary to draw inferences about student learning, make “actionable” decisions, and adjust instruction as necessary (Mandinach & Jackson, 2012, p. 16). In fact, some argue that such a system actually has limited educational value (Bennett & Gitomer, 2008) and that improvements in teaching and learning will only be realized by “aligning curriculum, instruction, and
31
for educators to analyze data with colleagues in the light of curricular objectives.” (Bulkley, Oláh, & Blanc, 2010, p. 115).
In its 2001 report “Knowing What Students Know,” the National Research Council (NRC) made several recommendations on student assessment. To be
instructionally useful to classroom teachers, they contend that assessment systems should include classroom assessments that are integrated with instruction and make students’ cognitive processes evident; e.g., teachers should be able to infer from students’ assessment results both the strategies students used, as well as their thought processes. Tasks should be developed with consideration to the skills students need to answer an item correctly, the context in which it is presented, and whether it requires transfer of knowledge from other contexts. To increase the likelihood of student learning, results should be timely and teachers should be adequately trained in both theory and practice to use this information (NRC, 2001).
The two consortia’s assessment systems were designed to address the limitations
of the current accountability system by shifting from assessment of learning to a system
that attempt to include assessment for learning (Pellegrino, 2006; Bennett & Gitomer,
2008; Mandinach & Jackson, 2012) which allows teachers to use the results in some of the ways recommended by the NRC. In a system of assessment for learning, assessments do not merely check on learning summatively, they provide on-going evidence of what students have and have not mastered (see also, Stiggins, 2005). While districts and schools awaited the roll-out of these new assessment systems, many turned to interim assessment programs to improve teaching and learning (Herman & Baker, 2005).
COMPONENTS OF DATA-BASED INSTRUCTIONAL PROGRAMS
This section provides a typology for three types of student assessments. Their purposes, characteristics, and summaries of the research on their utility for informing teaching and learning are discussed. The research reviewed in this chapter focuses mainly on efforts to implement interim assessments and other data-based programs. However, to promote the use of student assessment data for instructional decision making, several programs also include related supports such as professional development, coaching, and guides and resources. The research on these supports is reviewed in brief.
Interim Assessments
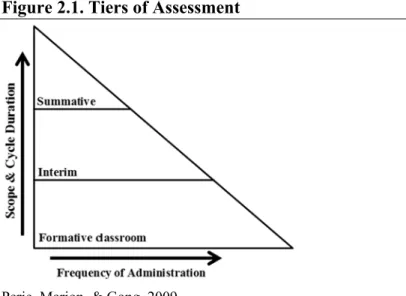
Perie, Marion, and Gong (2009) provide a useful framework for distinguishing among assessment types, and for defining and evaluating interim assessment programs, specifically. They organize assessments into three main categories: summative, interim, and formative. Two criteria are used to distinguish among assessment types: (1) the scope (e.g., coverage, purpose), and (2) the frequency of administration (figure 2.1).
33
Summative assessments are the broadest in curricular scope, but the least frequent in administration. As part of an accountability system, the results are used to inform policy, and to determine rewards and sanctions at the classroom (i.e., teacher), school, and district levels (Perie, Marion, & Gong, 2009). However, summative assessments have limited instructional use. Results are received too late, too infrequently, and are typically not granular enough to provide teachers with the type of data needed to inform their instruction (Dembosky, et al., 2005; Stecher & Hamilton, 2006; Marsh, Pane, & Hamilton, 2006; Supovitz, 2009).
At the other end of the spectrum are formative assessments, the narrowest type in terms of scope. Formative assessments can vary widely, but they are characterized by a short assessment cycle (i.e., frequent assessments) and are often embedded within the current lesson or unit of instruction (Perie, Marion, & Gong, 2009). Their purpose is to inform teachers of students’ mastery of skills related to only one or several content standards; diagnosing student learning, gaps in understanding, and often misconceptions (Perie, Marion, & Gong, 2009). However, they are typically not standardized for
comparison across classrooms, grades, or schools.
One of the key inputs of the ANet program is interim assessments which fall between formative and summative assessments on the continuum. These assessments are also referred to as benchmark, predictive, diagnostic, or, in some cases, even formative assessments. Interim assessments that serve an instructional purpose tend to be most similar to formative assessments, but with a longer assessment cycle and greater coverage of content standards. They are “administered during instruction to evaluate students’
knowledge and skills relative to a specific set of academic goals in order to inform policymaker or educator decisions at the classroom, school, or district level” (Perie, Marion, & Gong, 2009, p. 6). These assessments are often standardized for comparison across schools and built around a bank of items aligned to standards and curriculum. Results are reported quickly and often disaggregated by student and standard. When part of an assessment system, the assessments are often paired with support for interpreting the results and making decisions about instructional interventions.
Other Program Components
Prior research contends that the effectiveness of educational reforms in general, and interim assessment programs in particular, is dependent on leaders and teachers having the necessary skills and knowledge to properly implement such programs (Borko, Mayfield, Marion, Flexer, & Cumbo, 1997; Christman, et al., 2009; Blanc, et al., 2010). Furthermore,
“[w]hile Benchmarks may be helpful, they are not in themselves sufficient to bring about increases in achievement without a community of school leaders and faculty who are willing and able to be both teachers and
learners.”(Christman et al., 2009, p. 44)
Data-based instructional programs vary widely in respect to the types of support and resources offered to teachers. In her review of data-based interventions, Marsh (2012) found evidence that multiple, linked supports may be necessary to support effective data use: e.g., data systems or tools that are supported through professional development. Unfortunately, the existing research on these supports tends to be observational and