Design of Electrotactile Stimulation to Represent
Distribution of Force Vectors
Katsunari Sato1 and Susumu Tachi2 1The University of Tokyo, 2Keio University
ABSTRACT
Transmission of the distribution of force vectors on a fingertip improves the stability of a given operation in a tele-operation system. As such, we seek the representation of the distribution of force vectors via an electrotactile display. The electrotactile display directly activates nerve fibers connected to mechanoreceptors, thereby representing a tactile sensation. The system has a simple structure, is easily controlled and, it has seen a number of different applications. However, the majority of the conventional electrotactile displays only present a symbolic sensation of contact. In this paper, we propose the design of electrotactile stimulation for the distribution of force vectors, on the basis of the concept of “tactile primary colors”. Considering that a selective stimulation of mechanoreceptors enables the representation of the distribution of force vectors, we evaluate the proposed design in terms of the distribution, magnitude, and direction of a force vector. The results demonstrate that the proposed design is a viable approach to representing the distribution of force vectors.
KEYWORDS: Electrotactile display, tactile primary colors, distribution of force vectors.
INDEX TERMS: H.5.2 [INFORMATION INTERFACES AND PRESENTATION]: User Interfaces—Haptic I/O; H.1.2 [MODELS AND PRINCIPLES] User/Machine Systems—Human information processing
1 INTRODUCTION
Transmission of haptic information between tele-operation systems is essential for the manipulation of remote objects. In particular, we believe that the distribution of three-dimensional force vectors (the force that is applied both perpendicular and in parallel to the skin surface) upon a fingertip is essential for dexterous operation. By determining the spatial distribution, magnitude, and direction of motion of an object from this information, the operator is able to firmly grasp the object and successfully manipulate it. For example, force vectors can indicate whether the grasping force is sufficient. They can also improve the operator’s perception of the object by allowing him or her to identify its shape and to determine its hardness.
To transmit data regarding the distribution of force vectors, we first require a sensor for their measurement, as well as a display to represent the values. To date, many studies have been conducted
on both haptic sensors and associated displays. Recently, a finger-shaped sensor that allows for the measurement of force vector distribution has been developed [6] [20]. However, a haptic display that is capable of representing this information has yet to be developed because of the difficulty associated with its implementation.
Many types of haptic displays have been developed in the past [2]. One such type is the mechanical haptic display, which represents skin deformations by way mechanical actuators. Actuation of the pins in an up-and-down motion simulates the distribution of pressure [9] [13] [14] [16]. If we employ an actuator having three degrees of freedom (DOF) for the movement of each pin, it might be possible to represent the distribution of force vectors, though it is very difficult to form and control a dense array of small actuators. In contrast, some displays can capable of representing forces applied perpendicular or in parallel to the skin surface at a given point [7] [22] [25]. However, it is also difficult for these displays to represent the distribution of the force due to the size of the actuator. Another type of haptic display, the electrotactile display, uses electrical stimulation to fire nerve fibers that are connected to mechanoreceptors, simulating a tactile sensation. This form of display is small, has high spatial resolution, and can be controlled easily as it does not employ mechanical actuators. However, the majority of electrotactile displays show only symbolic contact information in the form of on-off signals [4] [15] [18]. Recently, a few studies have attempted to implement a method for simulating the degree of pressure that has been applied perpendicular [19] [26] or in parallel [5] to the skin’s surface. A three-dimensional tactile sensation, however, has yet to be implemented using the electrotactile display.
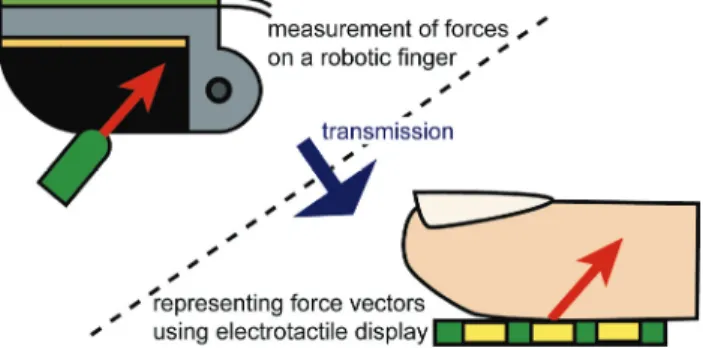
We therefore propose a design employing electrotactile stimulation that is capable of representing the distribution of force vectors (Fig. 1). To achieve this, we develop the design based on the concept of “tactile primary colors.” Kajimoto et al. [10] proposed that the electrotactile display is capable of simulating a natural tactile sensation via the selective stimulation of each mechanoreceptor. Furthermore, they showed that the selective
1) 7-3-1, Hongo, Bunkyo-ku, Tokyo, 113-8656, Japan, Email: {Katsunari_Sato }@ipc.i.u-tokyo.ac.jp
2) 4-1-1 Hiyoshi, Kohoku-ku, Yokohama-city, Kanagawa, 223-8526, Japan. Email: [email protected]
Figure 1. Representing the distribution of force vectors on a fingertip using the electrotactile display.
IEEE Haptics Symposium 2010
25 - 26 March, Waltham, Massachusetts, USA 978-1-4244-6820-1/10/$26.00 ©2010 IEEE
stimulation of two types of mechanoreceptors could be used to produce a sensation of vibration or pressure. Our design is predicated on the fact that it is possible for the distribution of force vectors to be simulated via different combinations of these selective stimuli.
In this study, we aim to transmit the spatial distribution, magnitude, and direction of a force vector. In this paper, we introduce the theories of electrotactile stimulation and tactile primary colors. We then formulate the design of electrotactile stimulation on the basis of the concept of tactile primary colors. Finally, we assess the viability of the proposed design with respect to representing the distribution of force vectors.
2 CONVENTIONAL STUDY OF ELECTROTACTILE STIMULATION In this chapter, we introduce a conventional study of the electrotactile stimulus. We describe the theory and application of the electrotactile display and subsequently, introduce the concept of “tactile primary colors.”
2.1 Theory and Applications
The electrotactile display operates by activating the nerve fibers that are connected to mechanoreceptors, thereby producing a tactile sensation. The electrodes are placed on the skin surface and a flow of electrical currents is applied to the skin. It is possible to apply a consistent stimulation to the nerve fibers bearing the electrodes by using two coaxial electrodes. Furthermore, arranging the pin-electrodes into a matrix pattern, the electrotactile display is capable of producing two-dimensional patterns [4].
The electrotactile display has a simple structure and is therefore easily controlled. Because of these advantages, the electrotactile display can be used not only in the contest of physiological studies, but also in the context of technological applications. For example, Kajimoto et al. [11] developed a haptic augmented reality system, referred to as “SmartTouch.” The SmartTouch enables the user to receive sensory information simulating the touch of a surface via any modality, even for those surfaces that would not be touchable. Methil et al. [15] and Sato et al. [18] mounted the electrotactile display onto the control system of a robotic hand and achieved the transmission of spatially distributed contact information. BrainPort (Wicab, Inc) and AuxDeco (EyePlusPlus, Inc.) are two systems that have been developed that implement a visual-to-tactile conversion system for use by the blind or visually impaired. These systems convert a camera image into patterns of electrotactile stimulation and subsequently deliver them to the tongue or forehead of the user. These applications of the electrotactile display present contact information in two dimensions, but not capable of simulating natural or complex tactile sensation. Recently, Sato et al. [19] and Yoshimoto et al. [26] attempted to simulate the three-dimensional shape and texture of the object, respectively, using an electrotactile display. However, these studies proved incapable of dealing with horizontal forces, i.e., forces applied parallel to the skin surface. 2.2 Tactile Primary Colors
To produce a natural tactile sensation using the electrotactile display, Kajimoto et al. [10] proposed the idea of “tactile primary colors,” an analogy to the three primary colors of vision. The idea behind this approach is to selectively stimulate each type of mechanoreceptor beneath the skin. By combining the selective stimulation of different receptors, natural tactile sensations are perceived by the user. Kajimoto et al. used electrical current issued from surface electrodes to generate an electric field within the skin surface, inducing activity with specific nerve fibers. There are four types of mechanoreceptors under the surface of
human skin: Meissner corpuscles (RA), Merkel cells (SAI), Ruffini endings (SAII), and Pacinian corpuscles (PC). In particular, Kajimoto et al. showed that they were able to selectively stimulate the nerve fibers connected to RA or SAI receptors, which reside at shallow depths within the skin.
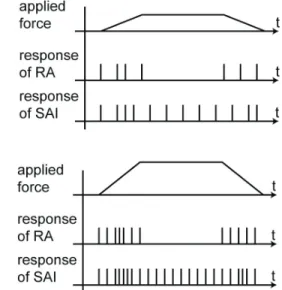
Figure 2 shows the neural responses of RA and SAI receptors when a given force is applied to the skin. From prior physiological studies, it has been revealed that RA receptors are activated when the formation of the skin under pressure varies over time [24]. RA receptors are the most sensitive to 30 Hz vibrations [8]. Furthermore, single-nerve stimulation of RA receptors produces a vibratory sensation [23]. Therefore, RA receptors appear to be critical to the perception of low frequency vibration. In contrast, SAI receptors have been shown to respond to any given deformation of the skin [24]. Specifically, Srinivasan et al. showed that the firing rate of SAI receptors is proportional to strain energy density (SED) [21]. The sensitivity of SAI receptors to vibration is almost constant from 0 to 200 Hz [8]. The single-nerve stimulation of SAI receptors generates a pressure sensation [23]. Therefore, SAI receptors appear to be critical to the perception of pressure.
Kajimoto et al. used two coaxial electrodes for selective stimulation. They found that when a central electrode functions as an anode and electrical current flows from the central electrode, an acute vibratory sensation is elicited. On the contrary, when the central electrode operates as a cathode and current flows to it from the outer electrode, a pressure sensation is elicited. Based on these observations and the aforementioned characteristics of mechanoreceptors, it is reasonable to assume that anodic and cathodic stimuli activate the nerve fibers connected to RA and SAI receptors, respectively. In fact, prior electro-physiological study [17] has provided evidence of this selective stimulation, supporting our interpretation. In addition, mathematical analysis of a nerve-fiber electrical model has revealed that anodic stimuli efficiently activates nerve axons that run orthogonal to the skin surface, while cathodic stimuli activate those that run in parallel. These results agree quite well with the anatomical observation [3]
Figure 2. Neural response of RA and SAI receptors when a force is applied [24]. When a force is applied quickly, the response ratio of RA receptors increases. The response ratio of
SAI receptors increases at a rate corresponding to the magnitude of the force.
that nerves of RA receptors typically run perpendicular to the skin surface, while SAI receptors tend to run in parallel.
Figure 3 summarizes the process of selective stimulation. The anodic stimulation excites vertically oriented nerves, which are mainly connected to RA receptors, and produces a vibratory sensation. On the other hand, the cathodic stimulation excites horizontally oriented nerves, which are mainly connected to SAI receptors, and produces a pressure sensation.
3 ELECTROTACTILE STIMULI TO REPRODUCE DISTRIBUTION OF THREE-DIMENSIONAL FORCE SENSATION
On the basis of the concept of tactile primary colors, we propose a design employing the electrotactile stimulation for the transmission and perception of the distribution of force vectors. 3.1 Electrotactile Display
The electrotactile display we use consists of a number of 32 pin-electrodes that are arranged as a grid, in order to present various spatial distributions of force vectors (Fig. 4). In order to enable the delivery of increased intensities of stimulation, the pin-electrodes are arranged in a hexagonal, close-packed formation. If the distance between pin-electrodes is small, greater voltage is required to deliver a sufficient flow of electrical current around the mechanoreceptors. Therefore, we set the diameter of the pin-electrode to 1.0 mm, and the distance between pin-electrode centers to 2.0 mm, respectively. The 31 pin-electrodes and single surrounding electrode are employed as points of stimulation and ground, respectively. These electrodes are arranged so as to cover the entire surface of an adult’s fingertip.
To simulate the spatial distribution of the sensation, we employed a method of time-division scanning (Fig. 5) [11]. We set one of the pin-electrodes to be an anode (or a cathode) and the surrounding pin-electrodes to act as the ground, for a 20 μs period. The electric current flows from the central pin-electrode to the surrounding pin-electrodes (or vice versa) and stimulates the nerve fibers. After a short period of time (100 μs), we apply stimulation via the pin adjacent to the central pin. This 100 μs interval is essential to achieve complete discharge of the pin-electrode while still preventing the intensity of stimulation from being too large. By periodically changing the pin-electrode that is selected for stimulation, we are able to produce electrotactile
stimulation at any point and in any distribution. When the scanning of the 31 pin-electrodes completes, the pole of the electrostimulus is inverted, resulting in an alternation between anodic and cathodic stimuli.
A pattern of stimulation is first generated on a personal computer and then transmitted to the H8 microprocessor. Then, the microprocessor directs the electrical pulse applied via each pin-electrode based on the received pattern of stimulation. The rate of transmission for this process is 30 Hz, with a single transmission containing up to seven anodic and cathodic stimulation patterns. Therefore, the maximum frequency of anodic or cathodic stimulation is 210 Hz. A given stimulation pattern includes details of the pole setting, as well as the intensity and frequency of the electrical current, at each pin-electrode. The range and step size of the intensity of stimulation (i.e. the amplitude of electrical current) are 0.0 – 5.0 mA and 0.02 mA, respectively.
3.2 Design of Electrotactile Stimuli
To reproduce the distribution of force vectors upon the skin surface, we integrate the anodic and cathodic stimuli and apply them to generate neural responses within the RA and SAI receptors. In the following section, we introduce the design of the electrotactile stimulation, providing details regarding its application with the desired spatial distribution, magnitude, and direction.
Figure 3. Selective stimulation of electrotactile display using anodic or cathodic electrodes [11].
Figure 4. Electrodes of electrotactile display.
Figure 5. Time-division scanning for representation of the spatial pattern of stimulation [11]. We shift the timing of pulses of each
electrode to apply the electrotactile stimuli at any given pin-electrode.
3.2.1 Spatial Distribution
The spatial distribution of force vectors is simply replicated via the selection of appropriate points of stimulation. Stimulation from a center pin-electrode can simulate the contact between the center of the fingertip and an object’s edged (Fig. 6a). Stimulation from one of the many pin-electrodes can simulate the contact between an area of the fingertip’s surface and the base of a cylindrical object (Fig. 6b).
It should be noted that conventional study [11] has shown that humans are able to perceive a point of stimulation sufficiently, from an anodic stimulation, though not from a cathodic one. The proposed method utilizes both anodic and cathodic stimuli, thus it is possible that it may fail to properly simulate the spatial distribution of force. In order to assess this, we will evaluate the performance of the proposed method in this respect, in section 4.2. 3.2.2 Magnitude
We simulate the magnitude of the force vector via a combination of vibration and pressure sensations, perceived as variations in the nature of skin deformations and the mere presence of deformation, respectively.
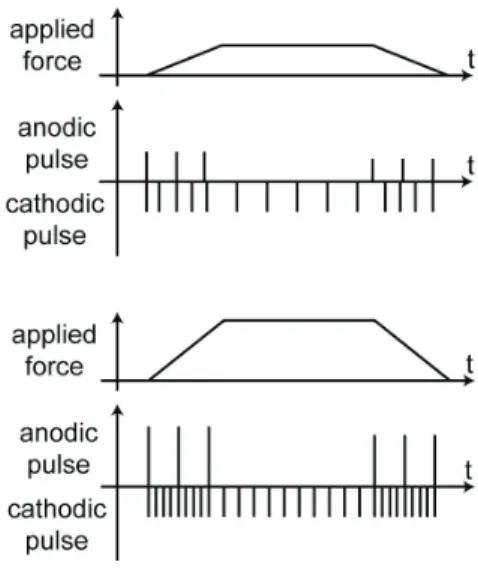
The basic idea of our proposed design is to simulate the neural response of RA and SAI receptors, as shown in Fig. 2, using anodic and cathodic stimuli. Figure 7 shows the design of the electrotactile stimulation that simulates the desired magnitude of force. The frequency of the cathodic stimulation is increased according to the desired magnitude of force and its variation over time. The anodic stimulation is employed when the magnitude of force is changing over time, where the speed of this change is mimicked by variation in the intensity of the anodic stimulation.
It should be noted that we adjust the intensity but not the frequency of the anodic stimulation. While it is possible to change the frequency of stimulation in order to replicate the desired neural response ratio of the mechanoreceptors, however, in the case of the selective stimulation of RA receptors, electrophysiological experiments have shown that the perception of vibration changes with the frequency of stimulation [12]. As such, it is not possible to adjust the frequency of the anodic stimulation to manipulate the perceived magnitude of vibration. It should also be noted, however, that it was observed that the neural response ratio of RA receptors appeared to increase with the intensity of the anodic stimulation. Therefore, we manipulate the intensity of stimulation to mimic changes in the magnitude of force over time.
3.2.3 Direction
When force is applied perpendicular to the surface of the fingertip as a result of contact with a cylindrical object, the skin is deformed symmetrically, conforming to the surface (Fig. 8a). However, when the force is applied both perpendicularly and in parallel to the skin surface, the resulting deformation is not symmetric (Fig. 8b). The concentration of stress on the surface accrues in a manner corresponding to the direction of the force. This concentration of stress appears to result in spatial spread and gradient in the response of mechanoreceptors. Therefore, we suggest that manipulation of the magnitude of stimulation must be performed in accordance with the desired concentration of stress, necessary to reproduce the direction of the force vector. To adjust the magnitude of stimulation, we employ the method described in subsection 3.1.2.
Figure 8 provides an example of the electrotactile stimulation simulating the direction of an applied force. We simulated the skin deformation by employing the two-dimensional finger model, which we developed in a prior study employing finite element method (FEM) [19]. The physical properties of the finger model are summarized in [19]. We applied two deformations to the finger model; one delivering a 1.0 mm displacement, perpendicular to the skin surface, and the other a 1.0 mm and 0.5 mm displacement, perpendicular and in parallel to the skin surface, respectively. The width of the displacement area was 4.0 mm. We simulated the deformation between the epidermis and the dermis, as the RA and SAI receptors lie between these layers of skin. The results of the simulation, and the electrotactile stimulation based on them, are shown in Fig. 8. Referring to the figure, the spatial spread and gradient of the skin deformation can be observed. Based on the observed patterns of skin deformation, it appears that our design achieves the electrotactile stimulation necessary to simulate the desired direction of force.
Our design of the electrotactile stimulation is based on prior physiological studies that only address simple scenarios; force is only applied from objects having simple shapes. To employ these designs in a practical setting, it is first necessary for us to estimate the response of mechanoreceptors when force is applied from contact with an object having a complex shape. We now consider the use of FEM to simulate the SED within the skin surface, as well as the response of the mechanoreceptors, which is necessary Figure 6. Example of the simulation of spatial distribution.
Contact with (a) an edged object and (b) the base of cylindrical object. The dashed line represents contact area of contact with
the object.
Figure 7. Design of anodic and cathodic pulse to simulate the desired magnitude of the force vector.
because of the strong, observed relationship between SED and activity of the mechanoreceptors [21].
4 EXPERIMENT
We now evaluate the ability of our design to simulate the distribution of force vectors resulting from contact with an object surface.
4.1 Participants
The participants, two males and two females, were volunteers aged 20 to 29. Before beginning the experiments, the participants were briefed on their content. The experiment was conducted using the electrotactile display detailed in section 3.1. Each participant was instructed to place the tip of his or her index finger on the electrotactile display. Within the electrotactile display, the threshold amplitude of electrotactile stimulation varied with each participant. In order to address this, pre-testing was performed in order to identify the threshold amplitude for each user. During the course of the actual experiment, single threshold was applied to all pin-electrodes.
In the evaluation of the proposed electrotactile stimulation, the question of “how participants perceive stimulation” is a difficult one, due to the ambiguity of the question. Following the experiment, the qualities of the different stimuli were evaluated qualitatively, by asking the participants to comment on the sensations they experienced with the application of each.
4.2 Two-point Discrimination
First, we assess the spatial resolution of the proposed electrotactile stimulation by employing an experiment incorporating two-point discrimination, in which participants are presented with various single or two-point stimuli. The position of the stimuli was selected from among the five points identified in Fig. 9a. Three distances of two-point stimuli were prepared, as shown in Fig. 9b. Two patterns of stimulation were prepared, for each number and distance of stimulation, in order to mitigate any bias in the effect that might result from the use of a particular stimulation position. The signals of the stimuli over time are depicted in Fig. 9c; rise time, stable time, and fall time were 200 ms, 1000 ms, and 200 ms,
respectively. The frequency of anodic stimulation was 30 Hz. The frequency of cathodic stimulation, which represents the magnitude of static force, was 60 Hz. The strength of the anodic stimulation was determined on the basis of the threshold of the electrotactile stimulation for each participant, identified during pre-testing. Each participant experienced the sensation of simulated touch, delivered by randomly selected stimuli, and was subsequently asked to state the number of stimuli perceived (one or two). Each pattern was applied five times.
Figure 10 shows the result of all participants. The horizontal axis represents the distance between the stimuli and the vertical axis represents the ratio of perceived stimuli reported by the users. Each dot represents the specific results obtained for a given participant, while the bars represent their averages. The error bar represents standard deviation (SD). Participants are able to Figure 8. Example of the simulation of the direction of a force
vector. Middle graphs depict the deformation of the skin simulated using FEM.
Figure 9. (a) Electrodes, (b) stimulation pattern, and (c) signal over time for the two-point discrimination experiment. Note: the
pulse of the anodic and cathodic stimuli is an example of stimulation.
Figure 10. Result of two-point discrimination. 0 mm represents a single-point stimulation.
identify the presence of two electrotactile stimuli more than 75% of the time, when these stimuli were more than 4 mm apart. Employing ANOVA, we determined that significant differences in results are produced by changes in the distances of the stimuli (F(3, 15) = 7.9, p < 0.01). In particular, the results of multiple comparisons demonstrate that there are significant differences between the separations of 0 mm and 4 mm (t(15) = 4.1, p < 0.01) and again between separations of 0 mm and 6 mm (t(14) = 3.8, p < 0.01).
During the experiment, some participants stated that they perceived two different types of single-point stimuli: large and small. In addition, some participants stated that they felt differences in the stimuli, depending on their position.
4.3 Magnitude Discrimination
Next, we examine the effectiveness of the proposed design of electrotactile stimulation in simulating a given magnitude of force. We presented participants with the electrotactile stimulation that simulates contact with a cylindrical object, as shown in Fig. 6b. The performance of our approach to electrotactile stimulation was evaluated with three different magnitudes of force: small, medium, and large. To simulate the magnitude of force, we employed cathodic stimuli with frequencies of 30 Hz, 60 Hz, and 90 Hz. The intensity of anodic stimulation was determined based on the threshold of electrotactile stimuli for each participant, identified during pre-testing, as well as the magnitude of stimulation. The frequency of anodic stimulation was 30 Hz. The resulting signal of stimulation over time is shown in Fig. 9c. The interval between the applications of stimuli was 500 ms. Participants were asked to touch two stimuli, selected at random, and to subsequently state which stimulus was perceived to be of greater magnitude. Each possible combination of stimuli was evaluated 10 times.
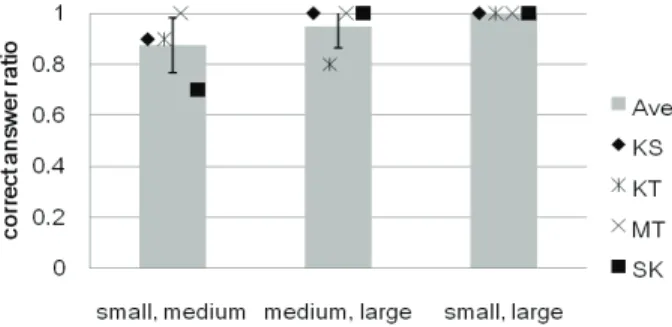
Figure 11 shows the observed results of all participants. The horizontal axis represents the combination of magnitude of stimulation, while the vertical axis represents the percentage of correct answer. The dots represent the actual results, and the bars represent their average. Error bars represent the SD. Participants were able to recognize the difference in magnitude between stimulation 80 % of the time. Using ANOVA, we determined that no significant difference was obtained between the various magnitudes of stimulation (F(2, 11) = 1.7, p = 0.26).
A number of participants stated that they were able to perceive a natural sensation of force applied perpendicular to the skin surface during the experiment, though other participants perceived a constant vibration when the large magnitude of stimulation was applied. The participants also noted that differences were
perceived between the various stimuli, depending on their position. 4.4 Directional Discrimination
Finally, we examine the ability of the proposed design of electrotactile stimulation to replicate the direction of force. We exposed participants to the electrotactile stimulation that simulating contact with a cylindrical object as shown in Fig. 6b. We prepared stimuli replicating three different directions of force. The directions used were ulnar (left), normal, and radial (right), with respect to the skin surface. The magnitude of force was simulated by the application of cathodic stimulation with a frequency of 60 Hz. To represent the concentration of stress, as shown in Fig. 8, we employed a frequency of 90 Hz. The frequency of anodic stimulation was 30 Hz. The intensity of anodic stimulation was determined on the basis of the threshold of electrotactile stimuli for each participant, as determined during pre-testing. The resultant signal of stimuli over time was shown in Fig. 9c. Participants were asked to touch randomly selected stimulation and to then state the perceived direction of force. Each direction was evaluated 10 times.
Figure 12 shows the results for all participants. The horizontal axis represents the direction of stimulation, while the vertical axis represents proportion of correct answers. The dots represent the actual results for each participant, while the bars represent their averages. The error bar represents SD. Each participant was able to identify the correct direction of stimulation, more 70 % of the time. Using ANOVA, we determined that there is no significant difference in results obtained between the different directions of stimulation (F(2, 11) = 0.4, p = 0.69).
Participants commented that they were able to recognize the direction of force from the spatial spread of the stimulation and the difference in the intensity of stimulation. Some participants also stated that they perceived the movement of the stimuli. 4.5 Discussion
From the experiment involving two-point discrimination, we are able to confirm that participants are capable of discriminating between two stimuli when they are separated by more than 4.0 mm. As this result is obtained when applying anodic stimulation [11], the proposed design of electrotactile stimulation therefore appears to have no effect on the spatial resolution of the electrotactile display. With regard to the mechanical tactile display, the threshold of two-point discrimination is approximately 1.5 mm [1]. This value is implemented by setting the distance between pin-electrodes to 0.75 mm. Furthermore, it appears that participants are capable of recognizing the difference
Figure 11. Result of experiment involving discrimination
between single-point and 2 mm separated two-point stimuli. Based on this, we suggest that the proposed design effectively represents the spatial difference (size) of a contact area via the difference in distance between pin-electrodes.
The results of the experiment involving discrimination between intensities demonstrate that the proposed method is capable of effectively representing variations in the magnitude of force vectors. Furthermore, participants are able to feel pressure that is applied in a direction perpendicular to the skin surface. However, high intensities of cathodic stimulation appear to cause sensations of vibration, in addition to the sensation of pressure. In order to simulate a natural tactile sensation, it is necessary for us to first carefully determine the stimulation threshold. In this experiment, we compared only three magnitudes of force. We suggest that, in the future, this work would benefit from an examination of the complete resolution of magnitude that the proposed design is capable of representing.
The results of the experiment involving the discrimination of force direction demonstrate that the proposed method is capable of simulating this effectively. However, participants appeared to discriminate between the applied directions, but instead by the movement of the locale of stimulation. We infer that the sensation of vibration (i.e. the response of RA receptors) plays an important role in the sensation of movement. As such, we must carefully design the anodic stimulation.
Based on the results of the three experiments detailed herein, we have confirmed that it is possible to represent the distribution of force vectors using the proposed design. However, it should be noted that these experiments are relatively trivial. In order to employ the proposed design in a practical setting, it would be necessary to simulate the response of mechanoreceptors and to represent nerve activities strictly. It appears to be possible to simulate the response of mechanoreceptors based on the SED within the skin surface, employing a FEM model of the fingertip [21].
The experiments demonstrate that participants tend to perceive differences in intensity of stimulation depending on its position. The instability of the intensity of stimulation may cause unnatural electrical sensations. The reason for this seems to be that the impedance of the skin varies with to the position. In these experiments, we have identified a single threshold of stimulation for all pin-electrodes. In order to address this issue, we must shift the threshold of stimulation according to the position of the user’s finger, in order to reduce the aforementioned electric sensation. In this experiment, we qualitatively evaluated the sensation resulting from the proposed approach to electrotactile stimuli. After further improvement of the electrotactile stimuli, we will proceed to evaluate the resulting sensations by quantitative means.
5 CONCLUSION
In this study, we have attempted to represent the distribution of force vectors using an electrotactile display. We have proposed a design of electrotactile stimulation based on the concept of tactile primary colors. We simulated the peripheral response of RA and SAI receptors using anodic and cathodic stimuli, respectively. The experimental results showed that the proposed design was feasible for use in the representation of the distribution of force vectors.
The current design, however, retains a number of problems that impede its feasibility for actual use. Therefore, we propose two improvements to our model. First, we suggest simulating the response of mechanoreceptors strictly, using a FEM. Second, we modify the electrotactile stimulation so that we are able to perceive a natural tactile sensation, rather than an electrical sensation. We believe that the improved design would be feasible
for use in transmitting the distribution of force vectors and enabling stable interaction with an object.
ACKNOWLEDGEMENT
This research was supported by CREST and Grant-in-Aid for JSPS Fellows (20·10009).
REFERENCES
[1] F. Bega-Bermudez and K. O. Johnson. Differences in spatial acuity between digits. Neurology, Vol. 56, pages 1389-1391, 2001. [2] M. Benali-Khoudja, M. Hafez, J.M. Alexandre, and A. Kheddar.
Tactile interfaces: a. state-of-the-art survey. Proceeding of International Symposium on Robotics, pages 721–726, 2004. [3] N. Cauna and G. Mannan. Organization and development of the
preterminal nerve pattern in the palmar digital tissues of man. J. Comp. Neurol., vol. 117, pages 309–328, 1961.
[4] C. C. Collins. Tactile television: Mechanical and electrical image projection. IEEE Transactions on Man-Machine System, MMS-11, pages 65–71, 1970.
[5] D. A. Eves and M. M. Novak. Extraction of vector information using a novel tactile display. Displays, Vol. 18, No. 3, pages 169-181, 1998.
[6] N. J. Ferrier and R. W. Brockett. Reconstructing the Shape of a Deformable Membrane from Image Data. The International Journal of Robotics Research, Vol. 19, No. 9, pages 795–816, 2000. [7] S. K. Horschel, B. T. Gleeson and W. R. Provancher. A fingertip
shear tactile display for communicating direction cues. Proceedings of World Haptics 2009, pages 172-177, 2009.
[8] A. Iggo. Sensory receptors in the skin of mammals and their sensory functions. Rev. Neurol.(Paris), Vol. 141, No. 10, pages 599–613, 1985.
[9] Y. Ikei and M. Shiratori. TextureExplorer: A tactile and force display for virtual textures.Proceedings of 10th Symposium on Haptic Interfaces for Virtual Environment and Teleoperator Systems pages 327-334, 2002.
[10] H. Kajimoto, N. Kawakami, T. Maeda and S. Tachi. Electro-Tactile Display with Tactile Primary Color Approach. Proceedings of International Conference on Intelligent Robots and Systems, 2004. [11] H. Kajimoto, M. Inami, N. Kawakami, and S. Tachi. SmartTouch:
Electric Skin to Touch the Untouchable. IEEE Computer Graphics & Applications Magazine, Vol. 23, No. 1, pages 36–43, 2004. [12] R. H. Lammote and V. B. Mountcastle. Capacities of humans and
monkeys to discriminate between vibratory stimuli of different frequency and amplitude: a correlation between neural events and psychophysical measurements. J.Neurophysiol., Vol. 38, No. 3, pages 539–559, May, 1975.
[13] J. Lee, C. Wagner, S. J. Lederman and R. D. Howe. Spatial low pass filter choice for pin actuated tactile displays. IEEE VR'03, 11th International Symposium on Haptic Interfaces for Virtual Environment and Teleoperator systems, pages 57-62, 2003.
[14] V. Levesque, J. Pasquero and V. Hayward. Braille Display by Lateral Skin Deformation with the STReSS^2 Tactile Transducer. Proceedings of World Haptics 2007, pages 115-120, 2007.
[15] N. S. Methil, Y. Shen, D. Zhu, C. A. Pomeroy, R. Mukherjee, N. Xi, and M. Mutka. Development of supermedia Interface for Telediagnostics of Breast Pathology. Proceedings of IEEE International Conference on Robotics and Automation, pages 3911– 3916, 2006.
[16] K. Minamizawa, H. Kajimoto, N. Kawakami and S. Tachi. Wearable Haptic Display to Present Gravity Sensation - Preliminary Observations and Device Design. Proceedings of WorldHaptics 2007, pages 133-138, 2007.
[18] K. Sato, K. Minamizawa, N. Kawakami, and S. Tachi. Haptic Telexistence. 34th Int. Conf. On Computer Graphics and Interactive Techniques (ACM SIGGRAPH 2007), San Diego, USA, 2007. [19] K. Sato, H. Nii, N. Kawakami, and S. Tachi. Electrotactile
Stimulation based on Strain Energy Density of the Fingertip, Proceedings of EuroHaptics International Conference 2008, pages 724-729, Madrid, Spain, 2008.
[20] K. Sato, K. Kamiyama, N. Kawakami, and S. Tachi. Finger-shaped GelForce: Sensor for Measuring Surface Traction Fields for Robotic Hand. IEEE Transaction on Haptics, (now printing).
[21] M.A. Srinivasan, and K. Dandekar. An Investigation of the Mechanics of Tactile Sense using Two-dimensional Models of the Primate Fingertip, ASME, vol. 118, pages 48–55, 2002.
[22] N. G. Tsagarakis, T. Horne and D. G. Caldwell. Slip aestheasis: A portable 2d slip/skin stretch display for the fingertip. Proceedings of Eurohaptics 2008, pages, 214-219, 2005.
[23] A. B. Vallbo. Sensations evoked from the glabrous skin of the human hand by electrical stimulation of unitary mechanosensitive afferents., Brain Research, 215, pages 359–363, 1981.
[24] A. B. Vallbo and R. S. Johansson. Properties of cutaneous mechanoreceptors in the human hand related to touch sensation. Human Neurobiology, vol.3, pages 3–14 Springer-Verlag, 1984. [25] R. J. Webster III, T. E. Murphy, L. N. Verner and A. M. Okamura. A
novel two-dimensional tactile slip display: design, kinematics and perceptual experiments. ACM Transactions on Applied Perception (TAP), Vol. 2, No. 2, pages 150-165, 2005.
[26] S. Yoshimoto, Y. Kuroda, Y. Kagiyama, T. Kuroda and O. Oshiro. Tactile Mapping Approach using Electrical Stimulus Pattern. Proceedings of IEEE ROMAN 2009, pages 460-465, 2009.
![Figure 3. Selective stimulation of electrotactile display using anodic or cathodic electrodes [11]](https://thumb-us.123doks.com/thumbv2/123dok_us/10215417.2925388/3.918.495.833.779.991/figure-selective-stimulation-electrotactile-display-anodic-cathodic-electrodes.webp)