A High Performance DC/DC Converter as MPPT for
Solar Modules
Marjan Dadras*‡, Meisam Farrokhifar*
*Faculty of Electrical Engineering, Islamic Azad University Heris Branch, Heris, Iran (marjandadras@yahoo.com, farrokhifar@herisiau.ac.ir)
‡Corresponding Author; Marjan Dadras, Faculty of Electrical Engineering, Islamic Azad University Heris Branch, Heris, Iran, Tel: +98 912 125 1879, marjandadras@yahoo.com
Received: 14.04.2015 Accepted: 28.06.2015
Abstract- The energy produced by solar modules is influenced by environmental conditions such as temperature and radiation intensity.Therefore, the generated voltage range is variable. The energy produced by solar modules has the maximum value at a certain point. Techniques for Maximum Power Point Tracking (MPPT) applied to step down - step up DC/DC converters can be used to increase the efficiency of solar modules. In this paper, a new step down-step up DC/DC converter is proposed which has lower ripple at output voltage and input current compared to the conventional converters. Moreover, the proposed converter has fewer number of keys and thus less dissipation and greater efficiency compared to the conventional devices.
Keywords: solar Modules; Maximum Power Point Tracking (MPPT); step down-step up DC/DC converter.
1. Introduction
Today, due to the indiscriminate use of electrical power by the people and industries and on the other hand, considering reduction of energy sources and fossil fuels such as oil, gas, and coal, there is a particular interest to new and renewable energies such as wind, solar power, and hydroelectric power. Moreover, severe pollution caused by the consumption of fossil fuels and also endangering human health and natural life are other reasons causing people to prefer new and renewable energies. However, the energy produced by these Modules is low. Therefore, solar modules are connected in series and form photovoltaic modules which are able to generate a lot of electrical power [1]. The effect of temperature change and radiation intensity on the voltage-power curves (V-P) of solar modules is shown in Fig.1. It can be observed from the curve V-P in Fig. 1 that an increase in temperature can decrease the power generated by PV module at maximum power point. On the other hand, an increase in radiation intensity can cause an increase in the power generated in the maximum power point of PV module and the other functional points. Therefore, maximizing the power generated by PV makes its application cost-effective [1-3]. Therefore, to find the maximum point of the power generated by PV and transfer it to load, a DC/DC converter should be applied which is an interface between load and PV module and track the maximum power point operation (MPPT). To perform MPPT, Duty rate in DC/DC converter is changed, and the load impedance seen from the two ends
of PV module changes,accordingly. This will continue until we reach the maximum power point of PV. There are several methods to track the maximum power point in PV, each of which has its advantages and disadvantages. Some of the methods of maximum power point tracking are Perturbation and Observation (P&O), hill climbing, and incremental conductance [4-5]. These methods do not require the information of the PV characteristic curve but they have some oscillations around the maximum power point, which is a disadvantage. We introduce a new P&O algorithm in this paper which reduces these perturbations. After selecting the desired MPPT method for maximum power point of solar panel, the next step is to select and design a new converter with high efficiency by which the desired method can be implemented.
2. Solar Modules
In recent decades, a common model for mathematical expression of current and output voltage of solar modules have been presented which is also used to perform MPPT. A PV array is composed of a group of series and parallel solar modules to generate the required voltage and current. The equivalent circuit for PV array which is formed by arranging
Npparallel and Ns series Modules is shown in Fig. 2 [6]. The equation of voltage and current of two ends of PV array is obtained from relation (1) [2]:
767
Fig. 1. V-P curves of PV module for different temperatures (left) and various radiations (right)
sh s s p C p s s s p ph p R R I N V N A T K N R I N V q I N I N I * * 1 * * * exp * * (1)
In relation (1) Iph is photon current, Is is cell saturation current, q is electron charge, K is the Boltzmann constant, TC is the working temperature of the cell, A is an ideal parameter, Rsh is parallel resistance, and Rs is solar modules series resistance.
3. Maximum Power Point Tracking Algorithm (MPPT)
MPPT algorithm of the proposed system is based on the direct adjustment of the duty cycle of DC/DC converter which is resulted from the sequential comparison of the output power of solar modules as well as the difference of output powers in two consecutive moments. Therefore, the problem of the maximized output power can be solved effectively using the duty cycle of DC/DC converter as a control variable with Perturbation and Observation (P&O) or the following control law [6-9]:
s N ph pI N sh s sR R N / I V
p N sh s sR R N /Fig. 2. solar array model which is composed of Npparallel and Ns series modules.
1 1 1 1 k k k k D P C D D (2)
Dk and Dk-1 are duty cycle values in k and k-1 intervals, respectively. Pk1 /Dk1 are the power tilt of PV in step k1, and c1 is the step change. The proposed Maximum Power Point Tracking based control algorithmis shown in Fig. 3. In Fig. 3 Vin, Iin, Pin and Vo are input voltage, input current, input power and output voltage respectively. The characteristic of the new proposed system is that PV output power is calculated and compared with the output power in the previous moment. The result of the comparison can help to decide whether the change sign of duty cycle D should be changed or remain unchanged.
4. The Proposed Step down-Step up DC/DC Converter
In the proposed convertor which is shown in Fig. 4, both voltages, higher and lower than the input voltage, can be achieved in the input. In other words, the proposed convertor is a step down-step up DC/DC converter with conversion ratio of (1-D/D). As seen in Fig. 4, this convertor has three keys (s1, s2, and s3), a diode (D1), and two inductors (L1 and L2) in the input and output and an energy-pumping capacitor (C1) and a capacitor in the output (C2) in order to stabilize output voltage and reduce the output voltage ripple.
This converter compared to the step down-step up Cuk converter, with conversion ratio of (D/1-D) and voltage with negative polarity at output, has voltage with positive polarity at output.
However, it has more power key than this convertor. Also the proposed convertor has a better conversion ratio than the two step down-step up DC/DC converters and type KY and hybrid type, because these two convertors has the conversion ratio of 2D. In other words, using this conversion ratio, more than twice the input voltage cannot be produced at output
768
start
Measure Vo
D
k+1=0
P
in,k=0
Measure
V
in,k,I
in,kMeasure V
ink,I
inkP
ink=V
inkI
inkD
K+1=D
k+∆D
K-
∆D
Return
V
o>V
maxP
ink>P
ink-1∆P
ink>∆P
ink-1∆D
k>∆D
k-1Yes
No
Yes
No
No
Yes
Fig. 3. the proposed Maximum Power Point Tracking Algorithm + 1 L in V 1 L V 2 S 2 L 1 C C2 + -- Vo 3 S 2 L V 1 C V + - - + 1 S o R
Fig. 4. the electrical circuit of the proposed step down-step up converter
voltage [10, 11].However, the proposed converter presents a voltage ranging from zero to infinity in the output.
In the following circuit equations and in the shape of the circuit in two performance modes are studied. In the first mode, S1 key is on and the S2 and S3 keys are off and the bias diode is direct. In this case, the energy pumping capacitor
(C1) is charged through the inductor L1, and inductor L2, which was magnetized in the previous mode, is demagnetized through the output. The proposed converter in this mode is shown in Fig.5 . Circuit equations in this mode are as follows: 1 1 in C L V v v (3) o L v v 2 (4) R v i iC2 L2 o (5) In the second mode, S1 key is off and S2 and S3 keys are on; bias diode (D) is reverse. In this mode, L1is magnetized through the input voltage, and L2 is charged and magnetized by energy pumping capacitor (C1), which was mentioned in the previous mode. The proposed converter in this mode of operation is shown in Fig. 6. Converter state equations in this mode are as follows:
in L V v 1 (6) o C L v v v 2 1 (7) R v i iC2 L2 o (8)
On the other hand, given that the average inductor voltage L1 in a switching period is zero, we have:
0 0 1
v dt T L (9)
1
* 0 *VinVC1 DT Vin DT (10) 0 1 C in in in DV V DV DV (11) 1 * C in D V V (12) Similarly for inductor L2, we have:0 0 2
v dt T L (13)
1
*
0 * Vo DT VC1Vo DT (14) 0 1 1 DVo DVC VC DC Vo (15)
1
* C1 o D V V (16)769
Substituting relation (16) into relation (12), we have:
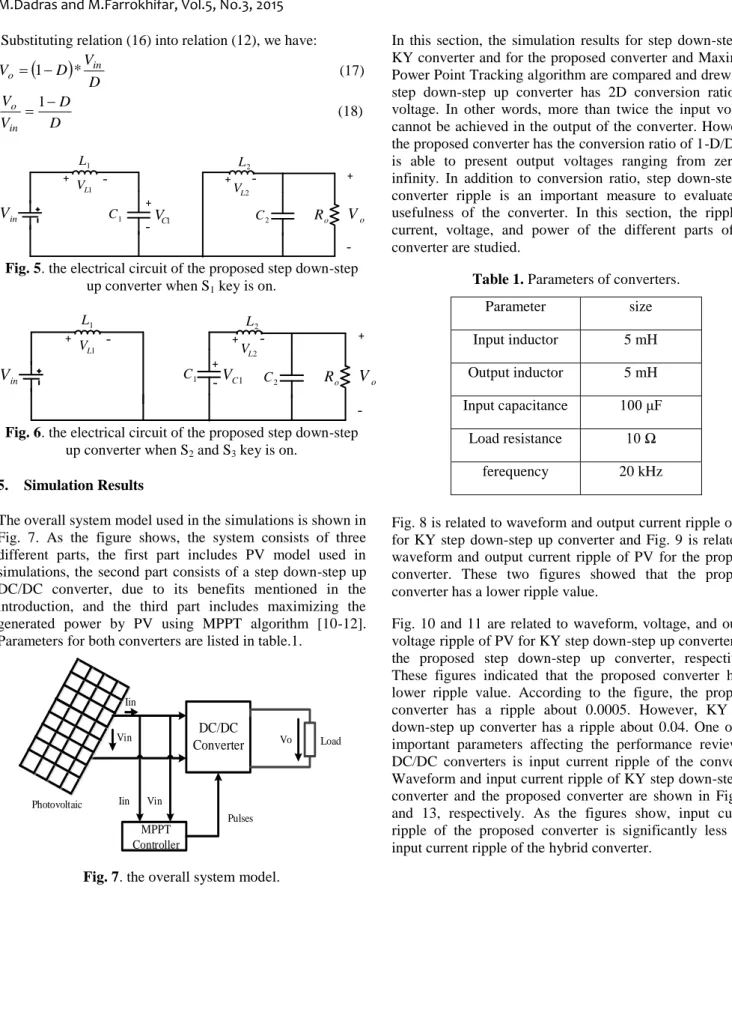
D V D Vo 1 * in (17) D D V V in o 1 (18) + 1 L in V 1 L V 2 L 1 C C2 + -- Vo 2 L V 1 C V + - - + o RFig. 5. the electrical circuit of the proposed step down-step up converter when S1 key is on.
+ 1 L in
V
1 L V 2 L 1 C + C2--
V
o 2 L V 1 C V +-
-
+ o RFig. 6. the electrical circuit of the proposed step down-step up converter when S2 and S3 key is on.
5. Simulation Results
The overall system model used in the simulations is shown in Fig. 7. As the figure shows, the system consists of three different parts, the first part includes PV model used in simulations, the second part consists of a step down-step up DC/DC converter, due to its benefits mentioned in the introduction, and the third part includes maximizing the generated power by PV using MPPT algorithm [10-12]. Parameters for both converters are listed in table.1.
DC/DC Converter MPPT Controller Load Vo Pulses Photovoltaic Iin Vin
Vin Iin
Fig. 7. the overall system model.
In this section, the simulation results for step down-step up KY converter and for the proposed converter and Maximum Power Point Tracking algorithm are compared and drew. KY step down-step up converter has 2D conversion ratio for voltage. In other words, more than twice the input voltage cannot be achieved in the output of the converter. However, the proposed converter has the conversion ratio of 1-D/D and is able to present output voltages ranging from zero to infinity. In addition to conversion ratio, step down-step up converter ripple is an important measure to evaluate the usefulness of the converter. In this section, the ripple of current, voltage, and power of the different parts of the converter are studied.
Table 1. Parameters of converters. Parameter size Input inductor 5 mH Output inductor 5 mH Input capacitance 100 μF Load resistance 10 Ω ferequency 20 kHz
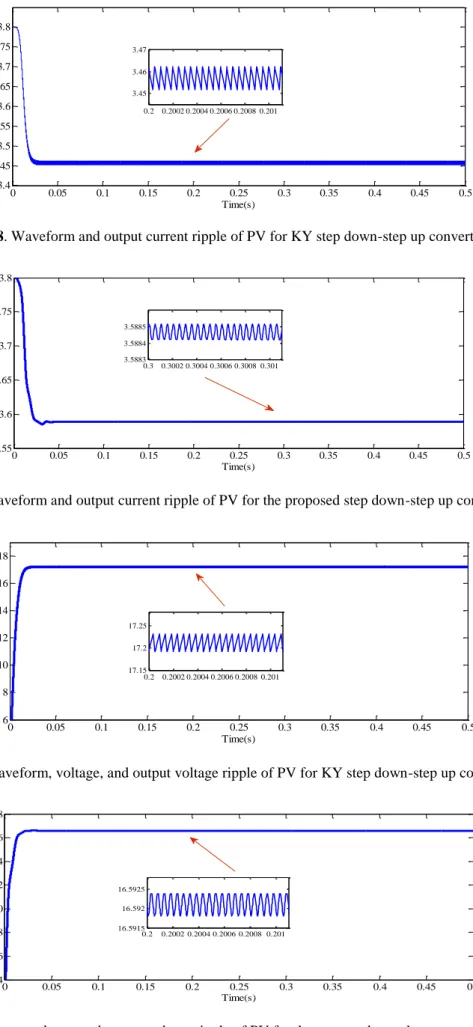
Fig. 8 is related to waveform and output current ripple of PV for KY step down-step up converter and Fig. 9 is related to waveform and output current ripple of PV for the proposed converter. These two figures showed that the proposed converter has a lower ripple value.
Fig. 10 and 11 are related to waveform, voltage, and output voltage ripple of PV for KY step down-step up converter and the proposed step down-step up converter, respectively. These figures indicated that the proposed converter has a lower ripple value. According to the figure, the proposed converter has a ripple about 0.0005. However, KY step down-step up converter has a ripple about 0.04. One of the important parameters affecting the performance review of DC/DC converters is input current ripple of the converter. Waveform and input current ripple of KY step down-step up converter and the proposed converter are shown in Fig. 12 and 13, respectively. As the figures show, input current ripple of the proposed converter is significantly less than input current ripple of the hybrid converter.
770
0 0.05 0.1 0.15 0.2 0.25 0.3 0.35 0.4 0.45 0.5 3.4 3.45 3.5 3.55 3.6 3.65 3.7 3.75 3.8 Time(s) C u rr en t( A ) 0.2 0.2002 0.2004 0.2006 0.2008 0.201 3.45 3.46 3.47Fig. 8. Waveform and output current ripple of PV for KY step down-step up converter.
0 0.05 0.1 0.15 0.2 0.25 0.3 0.35 0.4 0.45 0.5 3.55 3.6 3.65 3.7 3.75 3.8 Time(s) C u rr en t( A ) 0.3 0.3002 0.3004 0.3006 0.3008 0.301 3.5883 3.5884 3.5885
Fig. 9. Waveform and output current ripple of PV for the proposed step down-step up converter.
0 0.05 0.1 0.15 0.2 0.25 0.3 0.35 0.4 0.45 0.5 6 8 10 12 14 16 18 Time(s) V o lt ag e( V ) 0.2 0.2002 0.2004 0.2006 0.2008 0.201 17.15 17.2 17.25
Fig. 10. waveform, voltage, and output voltage ripple of PV for KY step down-step up converter.
0 0.05 0.1 0.15 0.2 0.25 0.3 0.35 0.4 0.45 0.5 4 6 8 10 12 14 16 18 Time(s) V o lt ag e( V ) 0.2 0.2002 0.2004 0.2006 0.2008 0.201 16.5915 16.592 16.5925
771
0 0.05 0.1 0.15 0.2 0.25 0.3 0.35 0.4 0.45 0.5 -70 -60 -50 -40 -30 -20 -10 0 10 Time(s) C u rr en t( A ) 0.2 0.2005 0.201 0.2015 0.202 0 5 10 15Fig. 12. Waveform and input current ripple of KY step down-step up converter.
0 0.05 0.1 0.15 0.2 0.25 0.3 0.35 0.4 0.45 0.5 1 1.5 2 2.5 3 3.5 4 Time(s) C u rr en t( A ) 0.2 0.2005 0.201 0.2015 3.5 3.55 3.6 3.65
Fig. 13. Waveform and input current ripple of the proposed step down-step up converter.
6. Conclusion
In this paper, Maximum Power Point Tracking (MPPT) applied to step down-step up DC/DC converters was used to increase the efficiency of solar modules. Fluctuations around the maximum power point, which are the main disadvantage of this method, were somewhat resolved using the proposed P&O method. A new step down-step up DC/DC converter was proposed with low ripple at output voltage and input current, compared to the conventional converters. Moreover, the proposed converter compared to the conventional converters has fewer number of keys and thus less dissipation and greater efficiency.
Reference
[1] B. Subudhi and R. Pradhan, “Characteristics evaluation and parameter extraction of a solar array based on experimental analysis,” in Proc. 9th IEEE Power Electron. Drives Syst, Singapore, Dec. 5–8, 2011. [2] S. Nema, R.K Nema., G. Agnihotri, “Matlab/ simulink
based study of photovoltaic cells/modules/array and their experimental verification”, International Journal of Energy and Environment, Vol.1, pp.487-500, 2010. [3] B. Subudhi , and R. Pradhan, “A Comparative Study on
Maximum Power Point Tracking Techniques for Photovoltaic Power Systems,” IEEE Trans on Sustainable Energy, vol. 4, no. 1, pp. 1949-3029, 2013.
[4] M. Calavia1, J. M. Perié1, J. F. Sanz, and J. Sallán, “Comparison of MPPT strategies for solar modules,” in Proc. Int. Conf. Renewable Energies Power Quality, Granada, Spain, Mar. 22–25, 2010.
[5] H. N. Zainudin and S. Mekhilef, “Comparison study of maximum power point tracker techniques for PV systems,” in Proc. 14th Int. Middle East Power Systems Conf., Egypt, Dec. 19–21, 2010.
[6] N. Femia, G. Petrone, G. Spagnuolo, andM. Vitelli, “Optimization of perturb and observe maximum power point tracking method,” IEEE Trans on Power Electron., vol. 20, no. 4, pp. 963–973, Jul. 2005. [7] F. Liu, Y. Kang, Y. Zhang, and S. Duan, “Comparison
of p&o and hill climbing MPPT methods for grid-connected PV generator,” in Proc. 3rd IEEE Conf. Industrial Electron. Application, Singapore, Jun. 3–5, 2013.
[8] S.Masoumi Kazraji, S. Khanabdal, R.Bavil Soflaye, M. Sabahi “ A Micro Scale Wind Turbine Fed BLDC Motor for Electric Drive Vehicle Application”
International Journal of Renewable Energy Research (IJRER), vol. 4, no. 1, pp. 31-38, 2014.
[9] H. Abbes, H. Abid, K. Loukil, “An Improved
Incremental Conductance Algorithm Using T-S Fuzzy System for Photovoltaic Panel” International Journal of Renewable Energy Research (IJRER), vol. 5, no. 1, pp. 160-167, 2015.
772
[10] K. I. Hwu, and Y. T. Yau, “Two Types of KY Buck–Boost Converters,” IEEE Trans. Power Electron, vol. 56, no. 8, pp. 0278-0046, 2009.
[11] K. I. Hwu, and T. J. Peng, “A novel buck–boost converter combining KY and buck converters,” IEEE Trans. Power Electron, vol. 27, no. 5, pp. 0885-8993, 2014.
[12] R.Coelho; F.M. Concer; D.C. Martins, “ Analytical and experimental analysis of DC- DC converters in photovoltaic maximum power point tracking applications” 36th Annual Conference on IEEE Industrial Electronics Society, 2010.