DigitalCommons@University of Nebraska - Lincoln
DigitalCommons@University of Nebraska - Lincoln
Architectural Engineering -- Faculty Publications Architectural Engineering and Construction, Durham School of
2013
Binaural room impulse response database acquired from a
Binaural room impulse response database acquired from a
variable acoustics classroom
variable acoustics classroom
Zhao PengUniversity of Nebraska - Lincoln, [email protected] Siu Kit Lau
University of Nebraska-Lincoln Lily M. Wang
University of Nebraska - Lincoln, [email protected] Sean Browne
Armstrong World Industries Kenneth P. Roy
Armstrong World Industries
Follow this and additional works at: https://digitalcommons.unl.edu/archengfacpub
Part of the Acoustics, Dynamics, and Controls Commons, and the Architectural Engineering Commons
Peng, Zhao; Lau, Siu Kit; Wang, Lily M.; Browne, Sean; and Roy, Kenneth P., "Binaural room impulse response database acquired from a variable acoustics classroom" (2013). Architectural Engineering -- Faculty Publications. 56.
https://digitalcommons.unl.edu/archengfacpub/56
This Article is brought to you for free and open access by the Architectural Engineering and Construction, Durham School of at DigitalCommons@University of Nebraska - Lincoln. It has been accepted for inclusion in Architectural Engineering -- Faculty Publications by an authorized administrator of DigitalCommons@University of Nebraska - Lincoln.
Volume 15, 2012 http://acousticalsociety.org/
163rd Meeting Acoustical Society of America/ACOUSTICS 2012 HONG KONG
Hong Kong 13 - 18 May 2012
Session 2aAAa: Architectural Acoustics
2aAAa1. Binaural room impulse response database acquired from a variable acoustics
class-room
Zhao Peng*, Siu-Kit Lau, Lily M. Wang, Sean D. Browne and Kenneth P. Roy
*Corresponding author’s address: Durham School of Architectural Engineering and Construction, University of Nebraska-Lincoln, 1110 South 67th Street, Omaha, Nebraska 68182, [email protected]
Room measurements were conducted in a variable acoustics classroom mockup space (epod) at Armstrong World Indus-tries in Lancaster, Pennsylvania, USA. Binaural room impulse responses were measured in the epod using a head and torso simulator. Five reverberation time (RT) scenarios were achieved with various combinations of absorptive wall panels and acoustical ceiling tile. These provided a range of mid-frequency RTs from 0.4 to 1.1 seconds. Three of the five RT scenarios were achieved using two different material configurations to also consider material location effects. For each of the eight material configurations, two student-teacher orientations were tested. One orientation had all desks facing the front of the room across the long dimension of the space, while the other had all furniture facing the front of the room along the short dimension of the space. Binaural impulse responses were measured at nine student positions in the longitu-dinal orientation and ten student positions in the transverse orientation, both using two teacher positions. This database of 252 binaural impulse responses from a variable acoustics classroom provides realistic test cases rather than simulations. These are being used for acoustic investigations on various topics including effects of classroom furniture orientation or acoustic material arrangements.
This paper was presented at Acoustics 2012 Hong Kong/163rd meeting of the Acoustical Society of America in Hong Kong, China on May 15, 2012.
INTRODUCTION
For this study, a database of binaural room impulse responses (BRIR) recorded from in situ measurements has been established to provide realistic materials for further investigations of room acoustics. In particular, the room used was set up to be similar to typical classroom configurations.
Some previous studies have investigated the effects of varying acoustic conditions, specifically reverberation time (RT), on classroom acoustics and speech intelligibility or student learning outcomes. Various methods were used to create different RT conditions for testing. Yang and Bradley1 digitally simulated the sound field in an anechoic room and recorded the speech intelligibility materials using an acoustical mannequin. The recorded materials were played back to participants over headphone. In another study by Iglehart2, physical modification to the test room surface absorptions was performed. Speech intelligibility materials were played through a speaker in the test room to participants. In more recent studies3, 4, electroacoustic systems were used to modify the reverberation characteristics in test rooms by superimposing a virtual room. Speech intelligibility or comprehension materials were
introduced through loudspeaker rigs with the listener seated at the “sweet spot”.
The database discussed in this paper provides opportunities for further study of room acoustics using recorded impulse responses. The changing variables among the in situ BRIRs include RT, location of absorption in room, teacher-student orientation and listener position; while keeping constant the room geometry, permanent material construction details, and mechanical and electrical system noise.
All measurements of the BRIRs were conducted in a lab space at Armstrong World Industries in Lancaster, PA. The lab was fitted out from a concrete core and shell space on a raised floor system. Demountable walls, which remained fixed during measurements, were utilized to partition the lab into two identical rooms and an auxiliary storage space with shared ceiling grid. Thick fiberglass was laid out along the common partition and above the ceiling grid to reduce sound transmission across those flanking paths between the two rooms. A rendering of the lab is shown in Figure 1.
Figure 1: Aerial view of Epod construction
MEASUREMENTS OF BRIR DATABASE
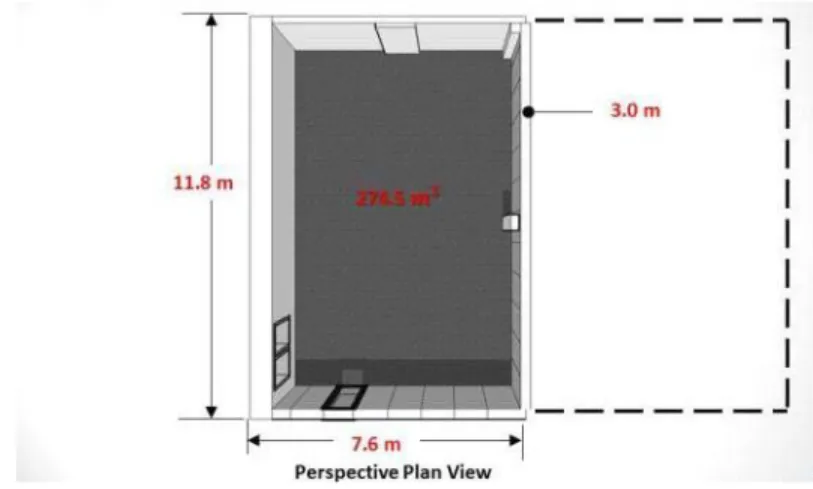
The BRIR measurements were conducted in the left room, hereafter referenced as Epod, with the left wall facing the building exterior. A perspective view of Epod is included in Figure 2. It is 11.8 m by 7.6 m in plan with a ceiling height of 3 m, similar to typical classrooms. The total volume is estimated to be 274.5 m3.
Figure 2: Interior view of Epod without additional absorptive materials
The permanent surface materials inside Epod include thin carpet on the floor, gypsum board on the front and left walls, and steel-faced panels on the demountable walls from floor to ceiling. Other permanent surface materials include the glass door on the back wall and a window on the left wall. Various RTs were achieved by combinations of (1) additional sound panels (25 mm thick, each of 1.5 m3) directly attached on walls and (2) three types of ceiling tiles – gypsum board, NRC 0.55 and NRC 0.70 mineral fiber tiles. Locations of additional absorptive material placement are indicated in Figure 3.
Figure 3: Locations of additional absorptive material placement
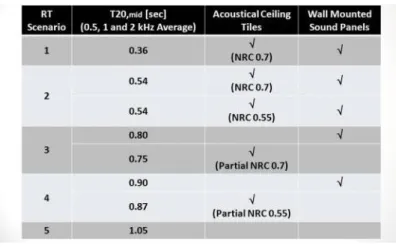
With various configurations of additional absorption, Epod was able to achieve five RTs ranging from 0.36 sec to 1.05 sec, measured as T and averaged across the 500, 1000 and 2000 Hz octave bands. The
material configurations used to attain each RT scenario are indicated in Table 1. For the middle three RT scenarios, an alternative material configuration was introduced to achieve a closely similar RT.
Table 1. Reverberation Time Scenarios
The background noise levels were monitored throughout all measurements. With only air-conditioning in operation, the background noise levels measured in the eight octave bands and averaged across all material configurations are indicated in Figure 4.. The error bars indicate one standard deviation. This background noise of Epod is rated at RC-26 hissy.
Figure 4: Measured Background Noise
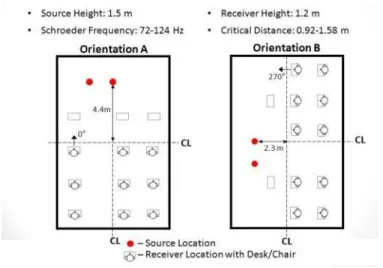
The BRIRs were measured in two teacher-student orientations, as shown in Figure 5. Orientation A had all the desks facing the front of the room and Orientation B facing the side of the room, while keeping the same amount of furniture. Two source positions were chosen, with receivers placed at distances
greater than the room’s critical distance, to imitate teacher locations during lecturing for each orientation. Receiver positions were also chosen based on typical student locations in classrooms. There were nine receiver positions in Orientation A and ten for Orientation B. However, none of the receiver positions were placed on the room’s center line to ensure that the direct sound arrival paths were slightly different for the two ears for BRIR measurements.
Figure 5: Teacher-Student Orientation
Two types of the measurements were conducted at each receiver position. A monaural measurement was first conducted based on ISO 3382-2 (Acoustics – Measurement of room acoustic parameters – Part 2: Reverberation time in ordinary rooms) to characterize the room. Once the monaural measurement indicated the achievement of target RT, a binaural measurement was performed using a KEMAR Manikin Type 45BA head and torso simulator with artificial pinnae as shown in Figure 6.
Figure 6: Types of measurements conducted
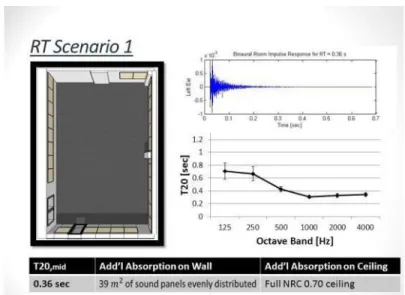
For the lowest RT scenario (1) of 0.36 sec (mid-frequency T20), a total of 39 m 2
of sound panels were evenly distributed except for the front wall, as indicated on the room perspective view in Figure 7, and a full NRC 0.70 ceiling. The graph in Figure 7 is showing T20 measured for this scenario from 125 to 4000
Hz, averaged across all source-receiver combinations. The error bars indicate one standard deviation for all trials measured in both teacher-student orientations for this RT scenario.
Figure 7: RT Scenario 1
The second RT scenario achieved a mid-frequency T20 of 0.54 sec using two material configurations,
as depicted in Figure 8. The first material configuration (2a) also incorporated a full NRC 0.70 ceiling, but reduced the area of sound panels on walls to 12.8 m2 only on the back of room. For the second material configuration (2b), a full ceiling of NRC 0.55 was used instead with a total of 13.5 m2 of sound panels evenly distributed on three walls. The error bars indicate one standard deviation for all trials measured in both teacher-student orientations under the respective material configuration for this RT scenario.
Figure 8: RT Scenario 2a and 2b
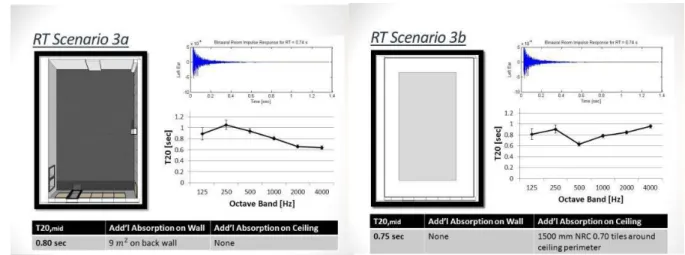
For the third RT scenario, as indicated in Figure 9, the additional absorption in Epod was further reduced. For the first material configuration in this RT scenario (3a), the ceiling tiles were substituted with gypsum board and only 9 m2 of sound panels were placed on the back wall. The resulting mid-frequency T20 for this set up was 0.80 sec. The alternative material configuration (3b) achieved a
mid-frequency T20 of 0.75 sec with only a strip of 1500 mm wide NRC 0.70 tiles around the ceiling perimeter,
leaving the center tiles as gypsum board. No additional absorption was applied on the walls for this set up.
Figure 9: RT Scenario 3a and 3b
The fourth RT scenario was also achieved through two material configurations, as indicated in Figure 10. In the first configuration (4a), the mid-frequency T20 of 0.90 sec was achieved by applying only a strip
of 300 mm wide NRC 0.55 tiles around the ceiling perimeter and gypsum board in the center. No additional absorption was incorporated on the walls. To achieve a similar mid-frequency T20 of 0.87 sec
(4b), 4.5 m2 of sound panels were attached to the back wall in room, instead of using ceiling treatments.
Figure 10: RT Scenario 4a and 4b
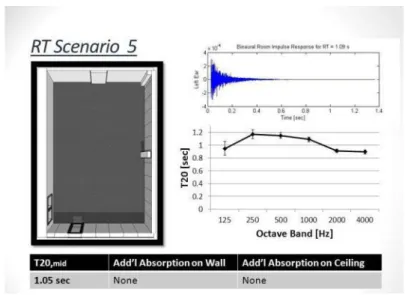
No additional absorption was incorporated in the last RT scenario (5), as shown in Figure 11. The measured RT was 1.05 sec (mid-frequency T20), which was also the ambient RT of Epod.
Figure 11: RT Scenario 5
SUMMARY
In summary, the gathered BRIRs in this database vary across several factors as outlined in Figure 12. Five RT scenarios were achieved through eight material configurations. In each material configuration, two teacher-student orientations were measured for 2 source positions x 9 or 10 receiver positions (18 trials for Orientation A and 20 trials for Orientation B). A total of 252 BRIRs were acquired in Epod for the database.
Figure 12: BRIRs in Database
For future work, we would like to utilize this database to study effects of teacher-student orientation and effects of absorptive material placement in room on the objective metrics calculated by these BRIRs. In addition, we are interested in conducting subjective tests using these BRIRs to study speech perception under different combinations of reverberation and background noise.
ACKNOWLEDGEMENTS
This work was supported by a Durham School of Architectural Engineering and Construction Research Seed Grant at the University of Nebraska-Lincoln. We would also like to acknowledge the Paul S. Veneklasen Research Foundation for their partial support of the trip for the graduate student to travel to this conference and present this paper. We sincerely thank our friends at Armstrong World Industries, Dr. Kenneth P. Roy, Sean Browne and Jere Myers, for granting us access to use Epod and for their assistance on site during measurements. We would also like to acknowledge our visiting scholar Dr. Mustafa Kavraz from Karadeniz Technical University, Turkey for his help with measurements on site and graduate students James Cottrell and Megan Christensen for their help in analyzing the data.
REFERENCES
1
W. Yang and J. S. Bradley, “Effects of room acoustics on the intelligibility of speech in classrooms for young children,” J. Acoust. Soc. Am., vol. 125, no. 2, pp. 922-933, 2009.
2
F. Iglehart, “Combined effects of classroom reverberation and noise on speech perception by students with typical and impaired hearing,” Proceedings of INTERNOISE, 2009
3
M. Klatte, T. Lachmann and M. Meis, “Effects of noise and reverberation on speech perception and listening comprehension of children and adults in a classroom-like setting,”Noise and
Health, vol. 12, no. 49, pp. 270-82, 2010.
4
D. Valente, H. Plevinsky, J. Franco, E. Heinrichs-Graham and D. Lewis, “Experimental investigation of the effects of the acoustical conditions in a simulated classroom on speech recognition and learning in children,”J. Acoust. Soc. Am., vol. 131, no. 1, pp. 232-246, 2012.