Outage Probability Analysis of Downlink
UAV-assisted Cellular Systems
Anandpushparaj. J
1, Gattu Laxman Nadiminti
1, Muthuchidambaranathan
1,
Maurizio Magarini
2and Dushantha Nalin K. Jayakody
3,41 Department of Electronics and Communication Engineering, National Institute of Technology, Trichy, Tamil Nadu, INDIA 2 Dipartimento di Elettronica, Informazione e Bioingegneria, Politecnico di Milano, 20133 Milan, ITALY
3 School of Computer Science and Robotics, National Research Tomsk Polytechnic University, Tomsk, RUSSIA 4 School of Engineering, Sri Lanka Technological Campus, SRI LANKA
Email: [email protected], [email protected], [email protected], [email protected], [email protected]
Abstract—The deployment of unmanned aerial vehicles (UAVs) as floating base stations (BSs) has a huge impact in the field of wireless communication. Coverage area and spectral efficiency can be improved by efficiently using floating UAV base stations. Floating UAV BSs are very effective in delivering temporary on-demand services due to their flexible deployment capability. One of the major disadvantages of this model is that the Line of Sight (LoS) propagation environment causes severe interference to other adjacent cell users and UAV BSs. The effectiveness of the UAVs acting as wireless base station for the ground users is analyzed based on the outage probability of the LoS and non-LoS (NLoS) links. The outage probability of the downlink depends on both height of the UAV BS from the ground and its coverage radius. The analysis is carried out by varying the height and the coverage radius of the UAV BS. The simulation results show that the outage probability is minimum for an optimum height of180mto200m for a coverage radius of500mand a Signal to Interference Noise Ratio (SINR) threshold of10dB.
Index Terms—Unmanned Aerial Vehicle (UAV), Base Station (BS), Air to Ground (AG), Outage Probability, Line of Sight (LOS), Non Line of Sight (NLOS).
I. INTRODUCTION
Due to the enormous use of wireless devices in a variety of implementations, a spectral efficiency and high-speed wireless service are now becoming equally necessary. Nevertheless, owing to the various limitations such as expenses and geo-graphical constraints (e.g. mountains and forests), many areas do not have wireless services or suffer from bad connectivity and service quality [1] [2]. Examples of regions with bad wireless coverage include rural areas and nations (e.g. in Africa) where the construction of a full terrestrial infrastructure is very costly or impracticable [2]. In addition, the current cellular network infrastructure, capability and coverage will need to be quickly enhanced in order to deal with such a rise in demand during significant government events such as the Olympic Games. UAV-assisted wireless communication offers an ideal solution for wireless services in such situations [2]. For example, AT&T and Verizon planned to use unmanned drones to provide momentarily enhanced Internet coverage for the University Football and Super Bowl National Championships [3].
As an aerial base station, unmanned drones can be used to meet the coverage and frequency demands of wireless customers. They may have line-of-sight (LOS) contacts to terrestrial users owing to the flying nature of UAVs, resulting
in enhanced coverage and rate results [4]. Mobile UAVs can smartly relocate and alter their place compared to terrestrial base stations to deliver on-demand coverage for terrestrial users. As a consequence, UAV-dependent floating base stations can be utilized for temporary occurrences or hotspot regions to increase wireless ability and coverage [2].
One of the primary issues in UAV based communications is the three-dimensional deployment of UAVs. The variable altitude of UAVs and their prospective flexibility actually provide extra notches of liberty for effective placement. As a consequence, considerable attention has been paid to ideal deployment of UAVs. Deploying Unmanned vehicles for better spectral efficiency, enhancement of coverage area, public safety and security, and smart cities, are some of the important design criterion [3]. The ideal 3D positioning of Unmanned vehicle is a difficult mission as it relies on more variables, such as placement setting ( geographic region), locations of terrestrial users, and UAV-to-terrestrial channel features, is also a features of the altitude of a UAV [3] [5]. Moreover, it becomes more difficult to concurrently deploy various UAVs owing to the effect of inter-cell interference on system efficiency. In reality, as in standard cellular network planning, the placement of UAVs is considerably more difficult than ground base stations. Unlike ground base stations, UAVs should be positioned in a constant 3D dimension in space, by considering the impact of height on the characteristics of the A2G channel [6] [7]. In addition, their flight time and power restrictions also be taken into consideration while deploying UAVs as they directly impact on the efficiency of the network.
Recently, the issue of application of UAVs in wireless systems has been extensively researched in latest works [3]. For example, multiple drones for energy efficient data collection from IoT systems were explored for optimal deployment and mobility [8]. The LoS probability links between transmitting end and receiving end at very low altitudes owing to the shadowing impact and subsequent decreases in coverage radius. Furthermore, at very elevated altitude, there are high probability LoS connections. However, the path loss increases due to the wide range between the transmitter, recipient and the coverage performance decreases as a consequence [9]. However, in order to identify the optimal UAV altitude, the significance of both range and LoS probability would always be assessed concurrently [10].
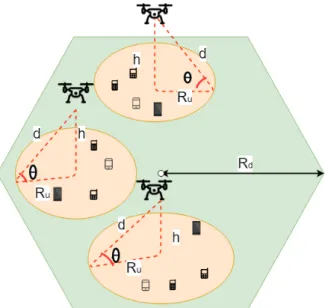
Fig. 1. UAV assisted cellular communication-System model . Single UAV acting as a floating Base station for a coverage area of radiusRu.
II. SYSTEMMODEL
Consider a geographical location in which certain numbers of UAVs must be placed in order to provide network coverage to terrestrial users within the zone. Each UAV is perceived to have a directional antenna. The drone serves a hexagonal coverage area withRdradius as illustrated in Fig.1, and any Multi User
(MU) is presumed to be lies in coverage region. The drone’s elevation angle to that specific user is defined by the inner angle between surface and the line that binds the wireless user to the unmanned drone [11]. In this system model the drone is placed at h meters above the surface of earth. In terrestrial communications, we will consider the UAV optimizing its height in order to attain the ideal expected efficiency based on Quality of Service (QoS) Limitations [11].
A. Propagation Model
There are few literature studies on characterizing the de-ployment of air to-ground (ATG) in especially in urban areas in which investigators have suggested that UAV to terrestrial communication should takes place in connection with two primary transmission units [12]. These classes are provably extracted in which the first category corresponds to receivers endorsing a condition of of-Sight (LoS) or nearby Line-of-Sight situation, whereas the second category usually belongs to receivers without LAP (Low Altitude Platform) LoS but receiving coverage through powerful reflections and diffractions [12].
RF (Radio Frequency) Signals transmitted by a LAP node propagate in open area till they achieve urban surroundings, where man-made buildings incur shadowing and scattering, resulting in significant losses in ATG connection. It is referred that additive loss occurred at the top of the loss of open space route as the unnecessary loss of the route, because it has a Gaussian distribution, but in this paper we deals with its normal distribution rather than its random activity. An other point is the impact of small changes induced by fast modifications in the propagation environment [12].
B. Modeling Line of Sight Probability
Numerous prototypes for air-to-ground (ATG) channels have already been suggested. UAV-BS radio signals are primarily Line-of-Sight (LoS) or non-Line-of-Sight (NLoS) entities. The possibility of getting a LoS link between the terrestrial user i
and the UAV-BS is determined by [13] [14] [15].
PLoS = 1 1 +a×exp−b180π tan−1rh i −a (1)
whereaandbare constants which reliant on the surroundings,
ri= (disinθi)specifies the position in horizontal dimension of
UAV-BS, hspecifies the height of the UAV-BS.
di= q
h2+r2
i (2)
In addition, Non-Line of Sight (NLoS) likelihood is
PN LoS = 1−PLoS. In relation to free space propagation loss,
RF signals are facing losses in the form of shadowing and scattering owing to the metropolitan area. We’re dealing with the mean path loss in this work apart from its random conduct. It is because the BS deployment scheduling stage shows long-term channel differences instead of small-scale differences. The path loss model for LoS and NLoS connections in dB is therefore expressed as.
LLoS = 20log 4πf cdi c +ηLoS (3) LN LoS= 20log 4πf cdi c +ηN LoS (4)
wherefc is the carrier frequency,diis the distance between
user iand the UAV-BS, given by
di= q
h2+r2
i (5)
In addition, the average extra losses for LoS and NLoS are
ηLoS and ηN LoS respectively. We could not determine if the
connection is LoS or NLoS in the lack of terrain expertise. The deterministic mean path loss, in which LoS and NLoS circumstance were averaged, is therefore considered as
L(h, ri) =LLoS×PLoS+LN LOS×PN LoS (6)
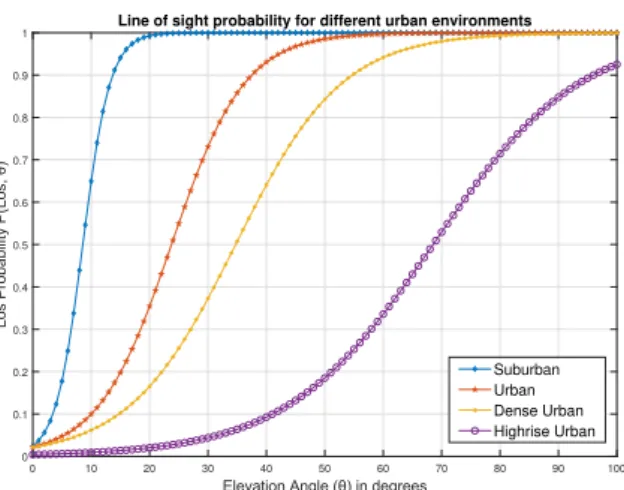
Line of sight probabilityPLoS is known as a periodic
func-tion of the elevafunc-tion angle and the variables of the environment. Probability of plotting for four chosen urban settings like Suburban, Urban, Dense Urban and High Raise Urban in Fig.2.
L(h, ri) =20log 4πf c c + 20log q h2+r2 i
+P(h, ri)ηLoS+ (1−P(h, ri))ηN LoS (7)
A=ηLos−ηN Los (8) B= 20log 4πf c c +ηN LoS (9) L(h, ri) = 20log q h2+r2 i +A×P(h, ri) +B (10)
0 10 20 30 40 50 60 70 80 90 100 0 0.1 0.2 0.3 0.4 0.5 0.6 0.7 0.8 0.9
1 Line of sight probability for different urban environments
Suburban Urban Dense Urban Highrise Urban
Fig. 2. Variation of line of sight probability with elevation angle for different environments
The received power of useriwith respect to transmit power
Ptdepends on the average path loss experienced by its
commu-nication channel, and it can be expressed asPr=PtL(h, ri) C. Suboptimal UAV deployment
We determine the optimum altitude of UAV for a coverage radius by considering the interference from other UAVs. Using directional antennas at the UAV, we consider the interference from the closest UAV k is strong. The nearest UAV k with received mean interference power is shown as [16].
I=PLoS,KE([Pr,k(LoS))] +PN LoS,kE[P r, k(N LoS)] (11) I=Pt[ 10 −µLoS 10 PN LoS,k + 10 −µNLoS 10 PN LoS,k] 4πf cdk c −n (12) Where PLoS,k is the line of sight probability for the
inter-ference horizontal link distance of the nearest UAV kas dk.
III. OUTAGE PROBABILITY
Outage probability is formulated as the stage where the receiver capacity value lies below the limit (where the energy value refers to the minimum signal to noise ratio (SNR) within a cellular), it can be said that the receiver is outside the BS range in cellular communications [17]. The probability of outage is a significant parameter for characterizing system results and is described as the likelihood of closing the communication link. The received SINR for a user served by UAViis written as:
γi(h, ri) =
Pr,i(h, ri)
Ii(h, dk) +N (13)
Where Pr,i(h, ri) is the received power at the user located at a radius of r when UAV is at a height h and Ii(h, dk) is the strong interference power received from the closest UAVk
which is located at a horizontal interference link distance ofdk.
Outage probability Pout(h, ri) is described as the probability that SNR range will fall below a defined predefined limitγth. Pout(h, ri) =P(γi(h, ri)< γth) (14)
TABLE I
SIMULATION PARAMETERS
Factor Range Explanation
ηLos 1 dB Path loss for LOS in free space propagation fc 2 GHz Carrier frequency
N 2 Path loss exponent
ηN Los 20 dB Path loss for NLOS in free space propagation
γth 5 dB SINR threshold No dBm/Hz-174 Noise power
Pt 46 dBm Maximum transmit power
0 100 200 300 400 500 600 700 800
Height of UAV (h) in meters 0 0.1 0.2 0.3 0.4 0.5 0.6 0.7 0.8 0.9 1 Outage Probability (P out )
UAV altitude (h) Vs Outage probability (Pout)
SNR Threshold = 10 dB SNR Threshold = 05 dB
Fig. 3. Drone height vs. the outage probability forγth= 5 dB and 10 dB
Here, Rayleigh’s fading channel shows that [11].
Pout(h, ri) = 1−exp −γ th γ(h, ri) (15) IV. RESULTS AND DISCUSSIONS
For simulations, we considering the UAV-based aerial wire-less communications above 2 GHz carrier frequency (fc =
2 GHz) in an urban environment with ηLos = 1dB and
ηN Los = 20dB and path loss exponent n = 2. We consider
UAV-BSs that transmit signals with transmit power Pt = 46
dBm, the noise power is assuming as -174 dBm/Hz. The outage probability for a SINR threshold of 5 dB, coverage radius of 500 m and interference link distance of 1000 m is shown in Fig.4. This figure clearly shows that the outage probability decreases initially then altitude increases to a certain value, and then increases, hence the entire altitude range can be divided into low-altitude region and high-altitude region. In low-altitude region as the altitude increases the probability of LoS connection increases and since the altitude is low the path loss of the connection is minimum which results in less outage probability. But in high-altitude region as the height of the UAV increases the path loss becomes dominant and as a result probability of outage increases.
Fig.3 shows the outage probability plot for a SINR threshold of 10 dB for a fixed coverage radius of 500 m and interference link distance as 1000 m. Outage Probability decreases for smaller heights and increases at larger heights. As we increase the threshold value the outage probability also gets increases. Furthermore, there is an optimum UAV height at which the average exit probability is lower than at any other height [11].The optimum altitude point which has the lowest outage is
0 200 400 600 800 1000 1200 Coverage radius in meters
0 0.1 0.2 0.3 0.4 0.5 0.6 0.7 0.8 0.9 1 Outage Probabilty
Coverage Radius Vs Outage Probability
h=100 m h= 200m h= 500 m h= 800m
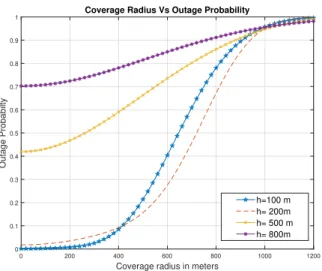
Fig. 4. Coverage radius in meters vs. the outage probability forγth= 5 dB
around 180-200 m for coverage radius of 500 m. Fig.3 shows the outage probability variation with respect to coverage radius for a SINR threshold of 5 dB for deployment with multiple drone altitudes and interference link distance as 1000 m. we can notice that as height of UAV raises outage probability also raises. But from outage curves for heights of 100 m and 200 m we can observe that to get a coverage radius of till 400 m optimum altitude point would be around 100 m. To get coverage radius more than 400 m the optimum altitude point would be around 200 m.
It is also inferred from Fig.4 that for coverage radius of 500 m the optimum altitude point would be around 200 m. So we obtain low outage for a height of 200 m than 100 m for coverage radius of more than 400 m.Outage reaches one for coverage radius more than 1200 m. It can also be inferred that link gets failed for a user located at a horizontal distance of more than 1200 m from the UAV. Fig.4 gives the outage probability plot with respect to variable SINR threshold for numerous UAV heights for a Static coverage radius of 500 m and interference link distance as 1000 m [11]. Fig.5 shows that as the UAV-BSs height increases with increase in outage probability due to the increased path loss. As the height increases outage probability reaches one for lesser threshold value.
A. Outage probability analysis with interference link distance
Fig.6 gives the outage probability plot with respect to UAV height for deployment with different horizontal interference link distances. It can be seen from the Fig.6. that as the horizontal interference link distance increases, outage probability also decreases because of interference link and communication gets reduced. We could also infer that the optimum altitude that minimizes Pout(h, ri) increases (shifts towards right) as the
distance of interference linkdk increases. B. Outage capacity
The outage probability of Rayleigh fading channel for a threshold capacity of Cthbits / s / Hz is given as [11].
PoutC(h, ri) =P r[log2(1 +γ(h, ri))< Cth] (16)
-15 -10 -5 0 5 10 15 20 SINR in Threshold in dB 0 0.1 0.2 0.3 0.4 0.5 0.6 0.7 0.8 0.9 1 Outage Probabilty
SINR Threshold Vs Outage Probability
h = 300 m h = 500 m h = 800 m
Fig. 5. SINR threshold in dB vs outage probability for multiple drone altitudes
0 100 200 300 400 500 600 700 800 Height of UAV in meters
0 0.1 0.2 0.3 0.4 0.5 0.6 0.7 0.8 0.9 Outage Probability
UAV altitude Vs Outage probability for multiple link distances
Dinf = 800 m Dinf = 1000 m Dinf = 1500 m
Fig. 6. UAV height in meters vs. the outage probability forγth= 5 dB for
multiple interference link distances.
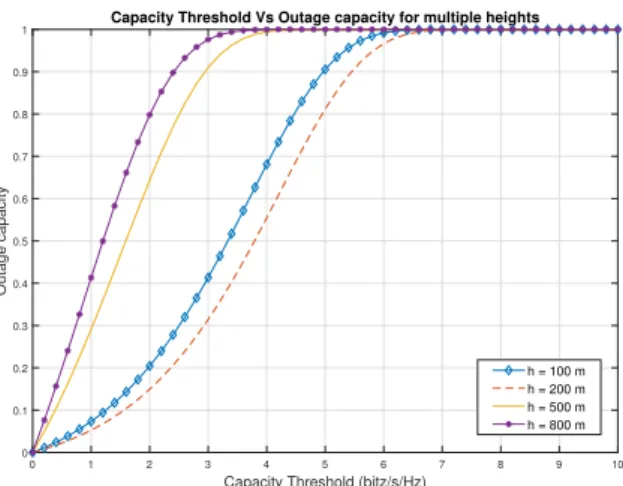
PoutC(h, ri) =P r 1 +γ(h, ri))<2Cth (17) PoutC(h, ri) =P r γ(h, ri))<2Cth−1 (18) PoutC(h, ri) = Z 2Cth−1 0 1 e γ(h, ri) e− nγ(h,ri) e γ(h,ri) o dγ(h, ri) (19) PoutC(h, ri) = 1−exp 2cth−1 γ(h, ri)) (20) From the Fig.7 that as the capacity threshold value increases outage probability of capacity increases. When height increases outage reaches maximum for lesser capacity threshold value. From plot it can be inferred that the outage curve for the organization of h = 200 m overtakes to that of h = 100 m. We identifies the same situation for the earlier computational modeling. This is again due to the optimal altitude point of around 200 m for a coverage radius more than 400 m.
0 1 2 3 4 5 6 7 8 9 10
Capacity Threshold (bitz/s/Hz)
0 0.1 0.2 0.3 0.4 0.5 0.6 0.7 0.8 0.9 1 Outage capacity
Capacity Threshold Vs Outage capacity for multiple heights
h = 100 m h = 200 m h = 500 m h = 800 m
Fig. 7. Threshold Capacity vs. Outage capacity for many UAV heights with radius Ro = 500 m
V. CONCLUSION
This paper analyzes the effective implementation of un-manned drones with the effect of node interference. Downlink SINR received at the mobile terminal has been evaluated by proper path loss models. Performance of UAV base stations is examined by using a performance metric in the sense of outage probability for different drone altitudes. The effects of outage probability for different SINR threshold values, coverage radii and interference link distances has been analyzed. Also results show that there exists an optimal height at which outage probability would be minimum that maximizes the received power. Optimal heights of base stations for various transmitting and interference node parameters has been determined.
VI. ACKNOWLEDGMENT
This work was funded in part by the Scheme for Promotion of Academic and Research Collaboration (SPARC), Ministry of Human Resource Development, India under the No.P145 and Indo-Italy researcher exchange program for 2017-2020 (INT/ITALY/P-6/2016 (ER)).
REFERENCES
[1] Y. Zeng, J. Lyu, and R. Zhang, “Cellular-connected uav: Potential, challenges, and promising technologies,”IEEE Wireless Communications, vol. 26, no. 1, pp. 120–127, 2018.
[2] Y. Zeng, R. Zhang, and T. J. Lim, “Wireless communications with unmanned aerial vehicles: Opportunities and challenges,”IEEE Commu-nications Magazine, vol. 54, no. 5, pp. 36–42, 2016.
[3] M. Mozaffari, W. Saad, M. Bennis, Y.-H. Nam, and M. Debbah, “A tutorial on uavs for wireless networks: Applications, challenges, and open problems,”IEEE Communications Surveys & Tutorials, 2019.
[4] Q. Feng, J. McGeehan, E. K. Tameh, and A. R. Nix, “Path loss models for air-to-ground radio channels in urban environments,” in2006 IEEE 63rd vehicular technology conference, vol. 6. IEEE, 2006, pp. 2901–2905. [5] R. I. Bor-Yaliniz, A. El-Keyi, and H. Yanikomeroglu, “Efficient 3-d
placement of an aerial base station in next generation cellular networks,” in2016 IEEE international conference on communications (ICC). IEEE, 2016, pp. 1–5.
[6] D. W. Matolak and R. Sun, “Air–ground channel characterization for unmanned aircraft systemspart iii: The suburban and near-urban environ-ments,”IEEE Transactions on Vehicular Technology, vol. 66, no. 8, pp. 6607–6618, 2017.
[7] V. Sharma, D. N. K. Jayakody, and K. Srinivasan, “On the positioning likelihood of uavs in 5g networks,”Physical Communication, vol. 31, pp. 1–9, 2018.
[8] D. N. K. Jayakody, T. D. P. Perera, M. C. Nathan, and M. Hasna, “Self-energized full-duplex uav-assisted cooperative communication systems,” in2019 IEEE International Black Sea Conference on Communications and Networking (BlackSeaCom). IEEE, 2019, pp. 1–6.
[9] A. Al-Hourani, S. Kandeepan, and A. Jamalipour, “Modeling air-to-ground path loss for low altitude platforms in urban environments,” in 2014 IEEE global communications conference. IEEE, 2014, pp. 2898– 2904.
[10] J. Lyu, Y. Zeng, R. Zhang, and T. J. Lim, “Placement optimization of uav-mounted mobile base stations,”IEEE Communications Letters, vol. 21, no. 3, pp. 604–607, 2016.
[11] A. M. Hayajneh, S. A. R. Zaidi, D. C. McLernon, and M. Ghogho, “Optimal dimensioning and performance analysis of drone-based wireless communications,” in 2016 IEEE Globecom Workshops (GC Wkshps). IEEE, 2016, pp. 1–6.
[12] A. Al-Hourani, S. Kandeepan, and S. Lardner, “Optimal lap altitude for maximum coverage,”IEEE Wireless Communications Letters, vol. 3, no. 6, pp. 569–572, 2014.
[13] C.-C. Lai, C.-T. Chen, and L.-C. Wang, “On-demand density-aware uav base station 3d placement for arbitrarily distributed users with guaranteed data rates,”IEEE Wireless Communications Letters, 2019.
[14] M. Alzenad, A. El-Keyi, and H. Yanikomeroglu, “3-d placement of an unmanned aerial vehicle base station for maximum coverage of users with different qos requirements,”IEEE Wireless Communications Letters, vol. 7, no. 1, pp. 38–41, 2017.
[15] M. Alzenad and H. Yanikomeroglu, “Coverage and rate analysis for unmanned aerial vehicle base stations with los/nlos propagation,” in2018 IEEE Globecom Workshops (GC Wkshps). IEEE, 2018, pp. 1–7. [16] M. Mozaffari, W. Saad, M. Bennis, and M. Debbah, “Efficient deployment
of multiple unmanned aerial vehicles for optimal wireless coverage,” IEEE Communications Letters, vol. 20, no. 8, pp. 1647–1650, 2016. [17] M. Kim and J. Lee, “Outage probability of uav communications in
the presence of interference,” in 2018 IEEE Global Communications Conference (GLOBECOM). IEEE, 2018, pp. 1–6.