Content-Based Image Retrieval using Color Quantization and Angle
Representation
Ihab Zaqout
Department of Information Technology, Faculty of Engineering & Information Technology, Alazhar University – Gaza, Gaza Strip, Palestine
ABSTRACT
An efficient non-uniform color quantization and similarity measurement methods are proposed to enhance the content-based image retrieval (CBIR) applications. The HSV color space is selected because it is close to human visual perception system, and a non-uniform color method is proposed to quantize an image into 37 colors. The marker histogram (MH)
vector of size 296 values is generated by segmenting the quantized image into 8 regions (multiplication of 45) and count
the occurrences of the quantized colors in their particular angles. To cope with rotated images, an incremental displacement to the MH is applied 7 times. To find similar images, we proposed a new similarity measurement and other 4 existing metrics. A uniform color quantization of related work is implemented too and compared to our quantization method. One-hundred test images are selected from the Corel-1000 images database. Our experimental results conclude high retrieving precision ratios compared to other techniques.
Indexing terms/Keywords
Content-based image retrieval; Segmentation; Marker histogram; Non-uniform color quantization; Similarity measurement.
Academic Discipline And Sub-Disciplines
Computer Science.
SUBJECT CLASSIFICATION
Image Retrieval.TYPE (METHOD/APPROACH)
Scientific Research Work.Council for Innovative Research
Peer Review Research Publishing System
Journal:
INTERNATION JOURNAL OF COMPUTERS AND TECHNOLOGY
1. INTRODUCTION
The increasing number on accessing the image database hosts by Internet users pay more attention to the researchers in developing different algorithms for the image retrieval problem, which is a branch of information retrieval. The performance of the retrieval process is evaluated by the distance or similarity measurements between the query image and the image collection.
Text based image retrieval (TBIR) and content based image retrieval (CBIR) are the main two approaches of the image retrieval problems. Image retrieval is widely used in important applications, such as search engines for image searching, indexing, and retrieving, criminal issues for searching suspected photos, medical diagnosis to discover certain diseases by searching for similar cases, album archives organization, remote sensing systems, motion tracking and crime prevention, etc.
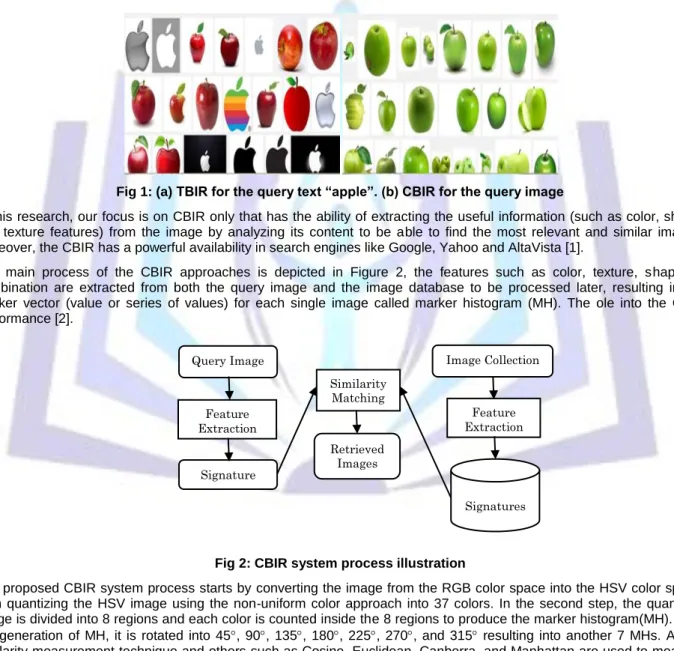
In TBIR systems, the query/input is text and the result of searching using the Google’s search engine is a collection of apple fruit and Apple company logo as shown in Figure 1(a). The results of the retrieval process cannot distinguish between the two objects of the same category, because of their names similarity. In CBIR systems, the query/input is an image and the result of searching using the Google’s search engine is a collection of only apple fruit as shown in Figure 1(b).
Fig 1: (a) TBIR for the query text “apple”. (b) CBIR for the query image
In this research, our focus is on CBIR only that has the ability of extracting the useful information (such as color, shape, and texture features) from the image by analyzing its content to be able to find the most relevant and similar images. Moreover, the CBIR has a powerful availability in search engines like Google, Yahoo and AltaVista [1].
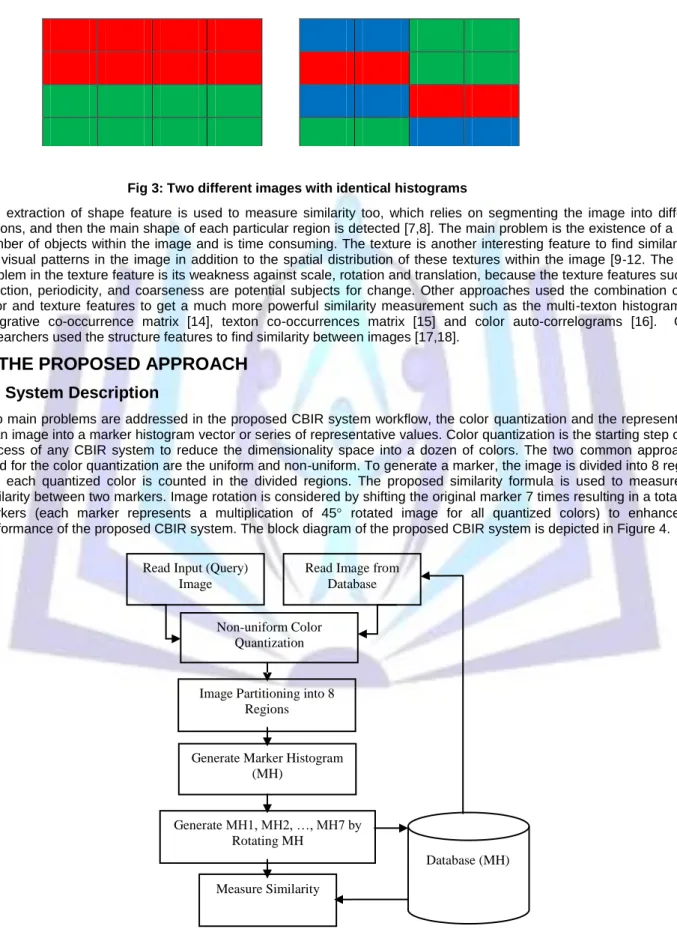
The main process of the CBIR approaches is depicted in Figure 2, the features such as color, texture, shape, or combination are extracted from both the query image and the image database to be processed later, resulting into a marker vector (value or series of values) for each single image called marker histogram (MH). The ole into the CBIR performance [2].
Fig 2: CBIR system process illustration
The proposed CBIR system process starts by converting the image from the RGB color space into the HSV color space, then quantizing the HSV image using the non-uniform color approach into 37 colors. In the second step, the quantized image is divided into 8 regions and each color is counted inside the 8 regions to produce the marker histogram(MH). After the generation of MH, it is rotated into 45, 90, 135, 180, 225, 270, and 315 resulting into another 7 MHs. A new similarity measurement technique and others such as Cosine, Euclidean, Canberra, and Manhattan are used to measure the similarity between the MH of the query image and MHs of the image database. The results of our similarity measurement are mapped into the period [0, 1]. The proposed system is expected to be resistant against rotations and scalability issues compared to the approaches presented in [3,4].
The advantages of using MHs are the ability to overcome the problem of depending on the color histogram that retrieves irrelevant images because of similarity in the histograms, and of dividing the image into 8 regions to find rotated images.
Query Image Feature Extraction Signature Image Collection Feature Extraction Signatures Similarity Matching Retrieved Images
2. RELATED WORK
In color based approaches, the histograms are widely used to count the occurrences of the image’s colors and applied to measure the similarity between two images [5,6], but as mentioned in the previous section, different images can be similar in their histograms and are irrelevant from the human visual system as shown in Figure 3. However, the precision of histogram based approaches depend on the image’s complexity and its type.
Fig 3: Two different images with identical histograms
The extraction of shape feature is used to measure similarity too, which relies on segmenting the image into different regions, and then the main shape of each particular region is detected [7,8]. The main problem is the existence of a huge number of objects within the image and is time consuming. The texture is another interesting feature to find similarity of the visual patterns in the image in addition to the spatial distribution of these textures within the image [9-12. The main problem in the texture feature is its weakness against scale, rotation and translation, because the texture features such as direction, periodicity, and coarseness are potential subjects for change. Other approaches used the combination of the color and texture features to get a much more powerful similarity measurement such as the multi-texton histogram[13], integrative co-occurrence matrix [14], texton co-occurrences matrix [15] and color auto-correlograms [16]. Other researchers used the structure features to find similarity between images [17,18].
3. THE PROPOSED APPROACH
3.1 System Description
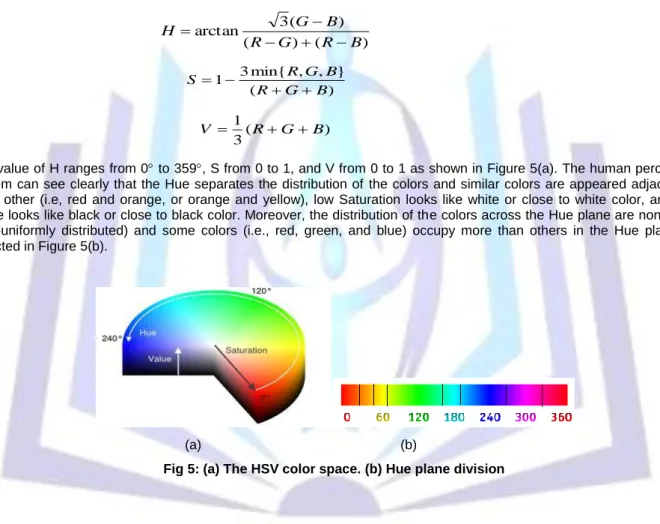
Two main problems are addressed in the proposed CBIR system workflow, the color quantization and the representation of an image into a marker histogram vector or series of representative values. Color quantization is the starting step of the process of any CBIR system to reduce the dimensionality space into a dozen of colors. The two common approaches used for the color quantization are the uniform and non-uniform. To generate a marker, the image is divided into 8 regions and each quantized color is counted in the divided regions. The proposed similarity formula is used to measure the similarity between two markers. Image rotation is considered by shifting the original marker 7 times resulting in a total of 8 markers (each marker represents a multiplication of 45 rotated image for all quantized colors) to enhance the performance of the proposed CBIR system. The block diagram of the proposed CBIR system is depicted in Figure 4.
Fig 4: Block diagram for the proposed approach
Database (MH) Read Input (Query)
Image
Non-uniform Color Quantization
Image Partitioning into 8 Regions
Generate Marker Histogram (MH)
Generate MH1, MH2, …, MH7 by Rotating MH
Measure Similarity
Read Image from Database
3.2 Non-Uniform Color Quantization
The depth of the color per pixel reflects the pixel’s resolution, and the total number of colors in the image depends on the image type, color system and the pixel’s resolution, for example if the HSV (Hue, Saturation, and Value) system is used, with 8-bit depth for each color, then, the image includes 224 or 16 million possible colors. Therefore, high computations are required to process a huge number of colors in image causes a major problem. Another problem is the distinction between two similar colors with two different saturation values looks different for the computer vision applications, but for the human vision system they might look as one color. The overall solution for both problems is to use quantization.
The quantization is the process that improves the performance of the CBIR system by decreasing the huge number of colors from millions to dozens in terms of replacing similar or close colors by one quantized color. In the RGB (Red, Green, and Blue) color space, assume the criteria is to quantize any pixel value (R ≤ 40, G ≤ 40, and B ≤ 40) into a black pixel and (R > 215, G > 215, and B > 215) into a white pixel. However, the RGB color space is successfully used in computer vision systems, but the human vision system is close to the HSV color space in terms of the color perception and its saturation. For this reason, the HSV color space is selected in our proposed CBIR approach.
To convert an image from the RGB color space into HSV color space, the R, G, and B values are divided by 255 to change the range from 0 .. 255 to 0 .. 1, then:
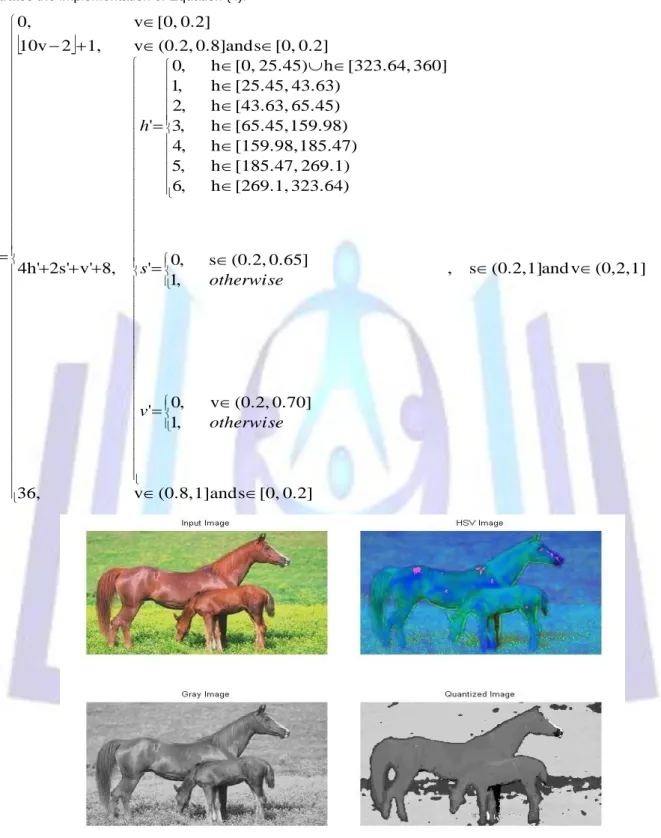
) ( ) ( ) ( 3 arctan B R G R B G H (1) ) ( } , , min{ 3 1 B G R B G R S (2) ) ( 3 1 B G R V (3) The value of H ranges from 0 to 359, S from 0 to 1, and V from 0 to 1 as shown in Figure 5(a). The human perception system can see clearly that the Hue separates the distribution of the colors and similar colors are appeared adjacent to each other (i.e, red and orange, or orange and yellow), low Saturation looks like white or close to white color, and low Value looks like black or close to black color. Moreover, the distribution of the colors across the Hue plane are non-equal (non-uniformly distributed) and some colors (i.e., red, green, and blue) occupy more than others in the Hue plane as depicted in Figure 5(b).
(a) (b)
In this research, the idea of the work of [19] for color quantization is modified by partitioning the Hue space non-uniformly. The non-uniform color quantization process is described in the Equation (4), where Q is the quantized vector. Figure 6 illustrates the implementation of Equation (4).
0.2]
[0,
s
and
1]
(0.8,
v
36,
(0,2,1]
v
and
(0.2,1]
s
,
,
1
0.70]
(0.2,
v
,
0
'
,
1
0.65]
(0.2,
s
,
0
'
323.64)
[269.1,
h
,
6
269.1)
[185.47,
h
,
5
185.47)
[159.98,
h
,
4
159.98)
[65.45,
h
,
3
65.45)
[43.63,
h
,
2
43.63)
[25.45,
h
,
1
360]
[323.64,
h
25.45)
[0,
h
,
0
'
8,
v'
2s'
4h'
0.2]
[0,
s
and
0.8]
(0.2,
v
1,
2
10v
0.2]
[0,
v
0,
otherwise
v
otherwise
s
h
Q
(4)3.3 The Marker Histogram
By knowing the height and width of the image, it's an easy to get the center of the image (reference point). From the reference point, the image is partitioned into 8 regions as depicted in Figure 7. Each region represents a multiplication of 45° (i.e., region 2 covers all angles between 45° and 89°).
Fig 7: Image is partitioned into 8 regions
Each quantized pixel Qi, where i = 0, 1, ….., 36 is counted as its occurrences in the 8 regions to finally generate the marker histogram (MH). Figure 8 depicts a snapshot of the occurrences of the 37 quantized color values (0 - 36) from the 8 regions. From the reference point (center of the image), each quantized pixel’s angle is calculated as follows:
,
tan
1y
x
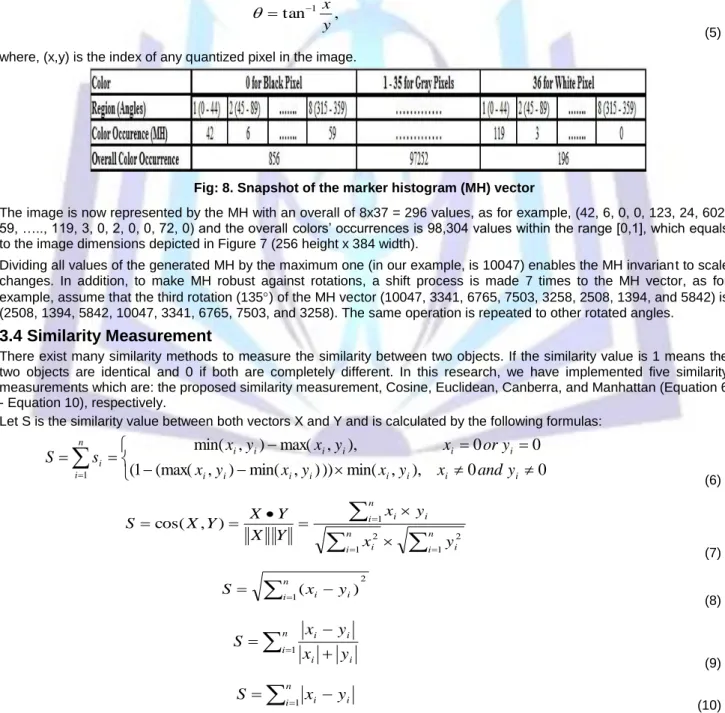
(5) where, (x,y) is the index of any quantized pixel in the image.Fig: 8. Snapshot of the marker histogram (MH) vector
The image is now represented by the MH with an overall of 8x37 = 296 values, as for example, (42, 6, 0, 0, 123, 24, 602, 59, ….., 119, 3, 0, 2, 0, 0, 72, 0) and the overall colors’ occurrences is 98,304 values within the range [0,1], which equals to the image dimensions depicted in Figure 7 (256 height x 384 width).
Dividing all values of the generated MH by the maximum one (in our example, is 10047) enables the MH invariant to scale changes. In addition, to make MH robust against rotations, a shift process is made 7 times to the MH vector, as for example, assume that the third rotation (135) of the MH vector (10047, 3341, 6765, 7503, 3258, 2508, 1394, and 5842) is (2508, 1394, 5842, 10047, 3341, 6765, 7503, and 3258). The same operation is repeated to other rotated angles.
3.4 Similarity Measurement
There exist many similarity methods to measure the similarity between two objects. If the similarity value is 1 means the two objects are identical and 0 if both are completely different. In this research, we have implemented five similarity measurements which are: the proposed similarity measurement, Cosine, Euclidean, Canberra, and Manhattan (Equation 6 - Equation 10), respectively.
Let S is the similarity value between both vectors X and Y and is calculated by the following formulas:
(
1
(max(
,
)
min(
,
)
))
min(
,
),
0
0
0
0
),
,
max(
)
,
min(
1 i i i i i i i i i i i i i i n i iy
and
x
y
x
y
x
y
x
y
or
x
y
x
y
x
s
S
(6)
n i i n i i n i i iy
x
y
x
Y
X
Y
X
Y
X
S
1 2 1 2 1)
,
cos(
(7) 2 1( )
n i xi yi S (8)
n i i i i iy
x
y
x
S
1 (9)
n ix
iy
iS
1 (10)The advantage of implementing the Equation (6) makes low importance for small numbers like 0.1 and 0.2 when it has to be compared with 0.88 and 0.92 for example, and to give less importance for comparisons between 0.9 and 0.07 for example. Therefore, comparisons between the abovementioned similarity measurements are discussed in Section 4 and the results will show that our similarity measurement provides an overall better accuracy than others.
4. EXPERIMENTAL RESULTS AND DISCUSSIONS
This research is implemented on MATLAB 2009a, core i3 - 2.20 GHz processor, and Windows 7 operating system. The Corel-1000 image database is selected in our experiments that consists of 10 categories (Africa , Beaches, Building, Buses, Dinosaurs, Elephants, Flowers, Horses, Mountains and Foods), and each category consists of 100 different true color images. From each category, ten images are selected to test the uniform and non-uniform color quantization by using the mentioned similarity measurement techniques in subsection 3.4.
Retrieved images are ranked according to their similarity values between the query image and the Corol-1000 image database, and four choices are selected to display the best 10, 15, 20, and 25 scores. Initially, all images are transformed from the RGB color space into HSV color space. Two color quantization methods are implemented, the proposed non-uniform color quantization maps the image into 37 colors and the non-uniform color quantization maps the query image into 72 colors as shown in Figure 9(b,c), respectively.
Fig 9: (a) The query image (Top) - “image no. 878 from Corel-1000 Database.” (b) The result of non-uniform color quantization (bottom-left). (c) The result of uniform color quantization (bottom-right)
The marker histogram (MH) is generated by counting the occurrence of each quantized color in the 8 regions. In our approach the size of the MH vector is 8 x 37 = 296 values. Referring to the Figure 9(b), the black and white colors, as for example, are counted in the 8 regions and stored in the MH vector as follows: (0, 0, 0, 0, 9232, 3929, 5662, 8127, …………, 1435, 28, 120, 2434, 5, 0, 0, 51). In Figure 9(c), the size of the MH vector is 8 x 72 = 576 values including the black and white colors [19], as for example, are counted in the 8 regions and stored in the MH vector as follows: (0, 0, 0, 0, 162, 0, 259, 50, ………….., 0, 0, 0, 0, 0, 0, 0, 0). To overcome rotations difficulties, the generated MH is manipulated by the shifting process of the collected statistics from one region to the next region in terms of 45, 90, 135, 180, 225, 270, and 315 angles, yields to 8 MHs.
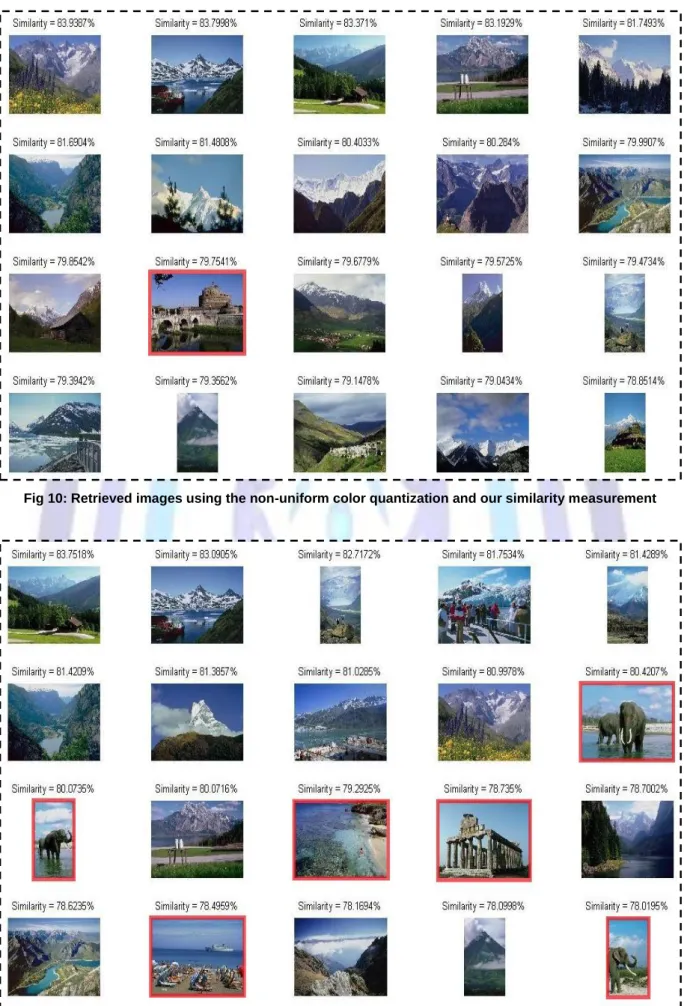
Assume that the query image is the image no. 878 is selected from the Corel-1000 image database, Figure 10 and Figure 11 illustrate the implementation of our similarity method on the non-uniform and uniform quantized image, respectively.
Fig 10: Retrieved images using the non-uniform color quantization and our similarity measurement
As shown in the Figure 10 and Figure 11, each retrieved image is displayed with its associated similarity value appears above it, and the wrong retrieved image is bounded by a red rectangle. A snapshot of the precision results of non-uniform and uniform color quantization for particular category (i.e., category 8) are summarized in Table 1 and Table 2, respectively. Our similarity measurement presents higher precision values among other similarity/distance metrics. However, the precision value of the retrieval process is proportional to the total number of retrieved images displayed.
Table 1: Non-uniform Color Quantization tested on Category 8 (image nos. 807, 811, 816, 829, 855, 857, 878, 880, 883, 888)
Similarity/Distance Metric
Best Scores – Precision % Category
Precision % n=10 n=15 n=20 n=25 Our Similarity 90.0 84.0 80.0 74.0 82.0 Cosine 73.0 68.0 65.0 60.0 66.5 Euclidean 68.0 63.3 60.0 55.6 61.7 Canberra 64.0 59.3 56.5 52.4 58.1 Manhattan 88.0 82.7 78.5 72.8 80.5
Table 2: Uniform Color Quantization tested on Category 8 (image nos. 807, 811, 816, 829, 855, 857, 878, 880, 883, 888)
Similarity/Distance Metric
Best Scores – Precision % Category
Precision % n=10 n=15 n=20 n=25 Our Similarity 81.0 75.6 72.0 66.6 73.8 Cosine 65.8 61.4 58.5 54.1 60.0 Euclidean 60.8 56.7 54.0 50.0 55.4 Canberra 57.4 53.6 51.0 47.2 52.3 Manhattan 79.3 74.0 70.5 65.2 72.3
The overall performance of this research is summarized in Table 3 and Table 4. The results obtained ensures that the non-uniform color quantization concludes better results than uniform color quantization, and our proposed similarity measurement as well.
Table 3: Non-uniform Color Quantization for overall categories
Similarity/Distance Metric
Best Scores – Precision % Overall
Precision % n=10 n=15 n=20 n=25 Our Similarity 91.8 87.1 83.4 77.9 85.0 Cosine 79.6 75.7 72.9 68.2 74.1 Euclidean 72.8 69.2 66.7 62.5 67.8 Canberra 74.4 70.6 67.7 63.4 69.0 Manhattan 79.6 75.7 73.0 68.4 74.2
Table 4: Uniform Color Quantization for overall categories
Similarity/Distance Metric
Best Scores – Precision % Overall
Precision % n=10 n=15 n=20 n=25 Our Similarity 84.4 78.8 75.0 69.4 76.9 Cosine 73.8 68.8 65.6 60.6 67.2 Euclidean 67.5 63.0 60.0 55.5 61.5 Canberra 68.5 64.0 60.9 56.3 62.4 Manhattan 73.9 69.0 65.7 60.8 67.3
5. CONCLUSIONS
In this research the HSV color space is chosen in our experiments because it’s close to our visual perception system, and the implementation of a non-uniform color quantization is our approach. The Hue plane is non-uniformly divided into 7 blocks of different sizes including threshold criteria imposed on Saturation and Value planes, to create an image of 37 quantized colors. The quantized image is divided into 8 regions and each region is a multiplication of 45. By counting the occurrences of the 37 quantized colors in the 8 regions, a marker histogram (MH) vector of size 296 values is generated. To cope with rotated images, the non-rotated MH is rotated 7 times by shifting the occurrences of each quantized color in multiplications of 45.
Therefore, The 8 generated MH vectors of the query image are compared with a MH vector of each image in the Corel-1000 image database using our proposed similarity measurement and other existing distance/similarity measurements such as Cosine, Euclidean, Canberra, and Manhattan. The overall precision obtained shows that our similarity measurement offers better results than other metrics.
REFERENCES
[1] S. Murala, R. P. Maheshwari, and R. Balasubramanian, Local tetra patterns: a new feature descriptor for
content-based image retrieval, IEEE Transactions on Image Processing, vol. 21, no. 5 (2012): 2874-2886.
[2] K. Meskaldji, S. Boucherkha, and S. Chikhi, Color quantization and its impact on color histogram based image
retrieval accuracy, 1ST International Conference on Networked Digital Technologies NDT’09, IEEE (2009): 515-517.
[3] X. Wang, and Z. Wang, A novel method for image retrieval based on structure elements' descriptor, Journal of Visual Communication and Image Representation, vol. 24, no. 1 (2013): 63-74.
[4] G. Liu, Z. Li, L. Zhang, and Y. Xu, Image retrieval based on micro-structure descriptor, Pattern Recognition, vol. 44,
no. 9 (2011): 2123-2133.
[5] D. Androutsos, K. N. Plataniotis, and A. N. Venetsanopoulos, Image retrieval using the directional detail histogram,
International Society for Optics and Photonics, (1997): 129-137.
[6] D. Mahidhar and M. Maheswar, A novel approach for retrieving an image using CBIR, International Journal of Computer Science and Information Technologies, vol. 1, no. 5 (2010): 329-331.
[7] A. Del Bimbo and P. Pala, Visual image retrieval by elastic matching of user sketches, IEEE Transactions on Pattern Analysis and Machine Intelligence, vol. 19, no. 2 (1997): 121-132.
[8] G. J. Scott, M. N. Klaric, C. H. Davis, and C-R. Shyu, Entropy-balanced bitmap tree for shape-based object retrieval
from large-scale satellite imagery databases, IEEE Transactions on Geoscience and Remote Sensing, vol. 49, no. 5 (2011): 1603-1616.
[9] A. Smeulders, M. Worring, S. Santini, A. Gupta, and R. Jain, Content-based image retrieval at the end of the early
years, IEEE Transactions on Pattern Analysis and Machine Intelligence, vol. 22, no. 12 (2000): 1349-1380. [10] M. Ferecatu and N. Boujemaa, Interactive remote-sensing image retrieval using active relevance feedback, IEEE
Transactions on Geoscience and Remote Sensing, vol. 45, no. 4 (2007): 818-826.
[11] Y. Li, and T. Bretschneider, Semantics-based satellite image retrieval using low-level features, IEEE International Proceedings on Geoscience and Remote Sensing Symposium IGARSS'04, vol. 7, (2004): 4406-4409.
[12] A. Samal, S. Bhatia, P. Vadlamani, and D. Marx, Searching satellite imagery with integrated measures, Pattern Recognition, vol. 42, no. 11 (2009): 2502-2513.
[13] G-H. Liu, L. Zhang, Y-K. Hou, Z-Y. Li, and J-Y. Yang, Image retrieval based on multi-texton histogram, Pattern Recognition, vol. 43, no. 7 (2010): 2380-2389.
[14] P. Christoph, Color texture classification by integrative co-occurrence matrices, Pattern Recognition, vol. 37, no. 5
(2004): 965-976.
[15] G-H. Liu and J-Y. Yang, Image retrieval based on the texton co-occurrence matrix, Pattern Recognition vol. 41, no.
12 (2008): 3521-3527.
[16] J. Huang, S. R. Kumar, M. Mitra, W-J. Zhu, and R. Zabeh, Image indexing using color correlograms, IEEE Proceedings on Computer Vision and Pattern Recognition, (2001): 762 – 768.
[17] K. W. Tobin, B. L. Bhaduri, E. A. Bright, A. Cheriyadat, T. P. Karnowski, P. J. Palathingal, T. E. Potok, and J. R. Price, Large-scale geospatial indexing for image-based retrieval and analysis, Advances in Visual Computing, Springer, vol. 3804, (2005): 543 - 552.
[18] K. W. Tobin, B. L. Bhaduri, E. A. Bright, A. Cheriyadat, T. P. Karnowski, P. J. Palathingal, T. E. Potok, and J. R. Price, Automated feature generation in large-scale geospatial libraries for content-based indexing, Journal of Photogrammetric Engineering and Remote Sensing, American Society for Photogrammetry, vol. 72, no. 5 (2006): 531-540.
[19] Z. Lei, L. Fuzong, and Z. Bo, A CBIR method based on color-spatial feature, IEEE Proceedings Region 10 TENCON 99, vol. 1, (1999): 166-169.
Author’s Biography
Ihab Zaqout is an associate Professor in Computer Science at the Department of Information Technology, Faculty of Engineering and Information Technology at Alazhar University – Gaza, Palestine. His research work based on digital image processing and data mining applications.