Scripps Senior Theses Scripps Student Scholarship
2019
The Impact of Transportation Network Companies
on Public Transit: A Case Study at the San
Francisco International Airport
Lianne Renee SturgeonScripps College
This Open Access Senior Thesis is brought to you for free and open access by the Scripps Student Scholarship at Scholarship @ Claremont. It has been accepted for inclusion in Scripps Senior Theses by an authorized administrator of Scholarship @ Claremont. For more information, please contact
scholarship@cuc.claremont.edu. Recommended Citation
Sturgeon, Lianne Renee, "The Impact of Transportation Network Companies on Public Transit: A Case Study at the San Francisco International Airport" (2019).Scripps Senior Theses. 1318.
THE IMPACT OF TRANSPORTATION NETWORK COMPANIES ON PUBLIC TRANSIT:
A CASE STUDY AT THE SAN FRANCISCO INTERNATIONAL AIRPORT
by
LIANNE STURGEON
SUBMITTED TO SCRIPPS COLLEGE IN PARTIAL FULFILLMENT OF THE DEGREE OF BACHELOR OF ARTS
PROFESSOR GRANT PROFESSOR PEDACE
Abstract
The emergence and rapid growth of Transportation Network Companies (TNCs), such as Uber and Lyft, has challenged the transportation industry by offering a new mode of transportation to consumers. It is imperative that transit agencies and cities understand the effect of TNCs on public transit usage to make informed
decisions. This study analyzes the impact of TNCs on Bay Area Rapid Transit (BART) ridership at the San Francisco International Airport (SFO) to measure the effect of TNCs on public transit. Using a fixed effects model to analyze hourly BART and TNC ridership data from 2011 to 2018, these findings suggest that TNCs are a substitute to BART. Before the entrance of TNCs, BART ridership at the BART SFO station increases. However, with the presence of TNCs, BART ridership at the SFO station decreases. Further research will proxy for transportation demand using hourly air traffic data at SFO and an instrumental variable for TNC supply to reduce
Acknowledgements
I would like to thank my primary reader Professor Laura Grant for her guidance and enthusiasm for my project. She has been extremely supportive in looking for
opportunities to advance my paper and pushed me to produce a final product better than I could have imagined. I’m excited to continue research next
semester--working with her is sure to be a highlight of my time at Claremont.
Thank you also to my second reader Professor Roberto Pedace for always setting aside time to meet with me despite his busy schedule. Finally, I wish to acknowledge my unofficial third reader, Vedant Vohra, who was always willing to let me run my ideas and Stata questions by him during the summer, semester, and weekends. I would like to express my appreciation to the staff of Bay Area Rapid Transit and San Francisco International Airport. Pam Herhold, Brendan Monaghan, and Dennis Lee, your ideas and feedback are always welcome. I’m thrilled to be able to help BART through my thesis and research next semester. I would not have been able to do the quality of analysis I did without the help from Roger Hooson and his team from SFO who went the extra mile to provide me with data.
Table of Contents
1. Introduction ... 6
2. Literature Review... 8
3. Context and Data ... 12
4. Model and Result ... 16
5. Conclusion ... 21
6. Appendix... 24
Executive Summary
The emergence and rapid growth of Transportation Network Companies (TNCs), such as Uber and Lyft, has challenged the transportation industry by offering a new mode of transportation to consumers. It is imperative that transit agencies and cities understand the effect of TNCs on public transit usage to make informed decisions. In this paper, I study TNCs’ effects on public transportation by looking at the San Francisco International Airport (SFO) as a case study: How do TNCs affect Bay Area Rapid Transit (BART) ridership at SFO?
Limited granular TNC data has restricted past research; I overcome this obstacle by using hourly TNC and BART ridership data. Both datasets include the hourly number of inbound and outbound riders for each mode between 2011 to 2018. The final dataset has 5,519,584 observations.
Using a fixed effects model, I regress BART ridership on factors measuring TNC operations. I include dummy variables for month, day of week, and hour to control for fluctuations in air and ground travel patterns. I also account for shocks in the BART system and rain which significantly decrease the attractiveness of
choosing to ride BART.
This study finds evidence that TNCs are a substitute to BART. My model shows that before the entrance of TNC, BART ridership at the SFO BART station grows by 50 riders per year. However, after the entrance of TNCs, BART ridership at the SFO BART station falls by 16 riders per year. I believe that the magnitude of daily BART ridership growth and decline rates will increase after I control for more unobserved factors
Future research will primarily focus on measuring ground transportation demand at SFO. This demand contributes to the simultaneous growth of BART and TNC ridership which may be leading to biased estimators. To proxy for
transportation demand, I can use air passenger deplaning and enplaning data. I will also use an instrumental variable for 𝑡𝑛𝑐 𝑟𝑡 to create an exogeneous variable that
measures the impact of TNC supply on BART ridership, independent of unobserved factors.
1. Introduction
Uber and Lyft are radically changing the transportation sector by offering a new mode of transportation to consumers. These Transportation Network
Companies (TNC) use internet-based technology to connect those seeking
transportation with a driver and unlike taxis, neither own vehicles nor employee drivers (AAMA). TNCs’ popularity and presence within the transportation sector has grown rapidly since their emergence nearly a decade ago. For example, Uber, the most widely-used TNC, was founded in 2010 and celebrated its 5 billionth trip in 2017 (Hawkins 2017). Many believe that the appearance of TNCs has most
immediately affected the transportation industry by destroying the taxi industry (Wallsten 2015). Public transit agencies are concerned that TNCs are cutting into their market share. It is imperative that transit agencies understand how the
continued growth of TNCs will affect public transportation so that they can respond appropriately. In this paper, I study TNCs’ effects on public transportation by looking at the San Francisco Airport as a case study: to what extent are TNCs reducing Bay Area Rapid Transit (BART) ridership at the San Francisco International Airport (SFO)?
Although researchers and government agencies have studied the effects of TNCs on public transit ridership by attempting to determine if TNCs are a
compliment or substitute to public transportation systems, conclusions have been opposing and indecisive. Some believe that TNCs compliment public transportation by solving the “first/last mile problem” that deters people from choosing public
transit(Sadowsky and Nelson 2017). The first/last mile problem refers to the distance between a transit user’s origin or destination and nearest public transportation access point (Wang and Odoni 2016). Others argue that TNCs
directly compete with public transit systems (Clewlow and Mishra 2017; Sadowsky and Nelson 2017). The discrepancy between conclusions may be due to four
limitations of past studies: absence of granular TNC data, lack of TNC data over a period longer than two months, differences in demographics between cities, and varying degrees to which TNCs impact different modes of public transportation.
By narrowing my scope of my research to TNC’s effect on BART at SFO, I better address the first two limitations. SFO has been collecting hourly TNC data for about the last three years, and I take advantage of this granular data set. I am also able to use the counterpart BART ridership dataset. BART is the heavy rail system that runs within the Bay Area and has a station directly at SFO (Figure A Appendix).
Using a fixed effects model, I regress BART ridership on factors measuring TNC operations at SFO. Part 2 outlines past research on the characteristics of TNC rides and users and its impact on public transit. Part 3 gives context to the period of study and describes the data sources. Part 4 details the model and results, and Part 5 addresses the significance of the results and suggestions for future research.
2. Literature Review
Because TNCs began in 2010, research on TNCs and their effect on public transportation is just beginning. Initial studies are qualitative, and researchers generally agree on the characteristics of TNC activity and user demographics. However, as researchers begin to more quantitatively study to what degree TNCs substitute or complement public transportation, conclusions vary. In Section 2a, I explain data sources used by past papers, and in Section 2b, I summarize TNC ridership and ride characteristics found by researchers. In Section 2c, I outline various studies which argue for a substitutional, complimentary, or insignificant relationship between public transit and TNCs and the contributions of my research. 2a. Overcoming Limited Data
TNCs have not publicly shared detailed data about their operations. To overcome the limited data on TNCs, studies collect data in multiple ways such as through surveys and existing travel pattern data. In one of the initial studies on TNCs, Rayle et al. (2015) summarize operations in San Francisco by surveying 380 participants in three TNC hotspots in San Francisco. Sadowsky and Nelson (2017) use monthly ridership data from the Federal Transit Administration to estimate trends in public transit ridership before and after the entrance of TNCs in their regression discontinuity design. Alternatively, in their working paper, Clewlow and Mishra (2017) create an original survey on transportation patterns and distributed it to seven metropolis areas. Coogan et al. (2018) rely on two previously conducted surveys and past National Household Travel Surveys to create models that show
changes in ridership. Coogan’s models react to changes in each mode’s quality of service population preferences.
More recently, researchers have been able to utilize data directly provided by TNCs themselves and indirectly source data from API addresses of TNC drivers. API addresses are public facing and disclosure certain data such as approximate location of TNC vehicles. The San Francisco County Transportation Authority (SFCTA)
estimates TNC operations in San Francisco from drivers’ APIs in their report “TNCs Today.” Feigon and Murphy (2018) use SFCTA’s data along with data directly provided from TNCs for five other cities and responses from two existing surveys. 2b. Characteristics of TNC Rides and Ridership
Despite differing data sources, the previously mentioned studies find similar characteristics of TNC operations and users. Feigon and Murphy (2018), Rayle et al. (2015), Coogan et al. (2018), and Clewlow and Mishra (2017) agree that TNC users are younger, higher income, and more well-educated than the average population. Feigon and Murphy (2018) and Rayle et al. (2015) find that a majority of TNC rides occur around city centers and airports. Activity peaks on weekends and during evening and night hours. The two studies show that travel time is the top reason for choosing TNC trips over public transit. Coogan et al. (2018) find that not only trip time, but also cost difference is a determining factor in taking TNCs over public transit. In ridership models where Coogan allows bus and train operations to “improve” (the cost and travel time are reduced), Coogan sees that bus and train ridership increased regardless of if TNC operations are held constant or “improve”
as well. From these results, Coogan argues that improved public transit service is the main driver for growing public transportation ridership. 2c. TNCs: Substitute or Complement to Public Transportation
While the aforementioned studies agree on the traits of TNC rides and users, they disagreed to what extent TNCs compete with or complement public
transportation. Rayle et al.’s (2015) survey show that 28% of TNC trips end near a train stop and 81% near a bus stop, suggesting that these TNC trips “were plausibly rail transit substitutes.” Clewlow and Mishra (2017) believe that TNCs are a
substitute when all modes of public transit are aggregated, but vary as a
complement or substitute for each specific mode. Their survey results showed that after the introduction of TNCs, total transit use at a national level fell 6% while train ridership rose 3%. In their paper, Sadowsky and Nelson (2017) argue when Uber first entered, TNCs complemented public transit. However, when Lyft entered, the two companies engaged in price competition, driving the price of TNCs below public transportation and drawing people towards TNCs.
Others argue that TNCs are a complement to public transportation. Doppelt (2018) uses a difference-in-differences model to compare Uber’s impact on public transportation modally and between metropolitan areas in the U.S. Doppelt finds that the individual effect of TNCs on rail is complimentary, but after aggregating the impact across all modes of public transportation, Uber is a substitute. His regression shows that rail ridership rises 26.2% after Uber enters. Hall et al. (2018) also use difference-in-differences to estimate Uber’s impact on public transit ridership
adjusting for the timing of entry and size of existing transit agencies in U.S.
metropolitan areas. Their model suggests that for the average transit agency, Uber’s presence increases ridership by 5% after two years. In large cities, Uber can
complement transit, raising transit ridership by .8%. However, if public transit usage was high before the arrival of Uber, Uber’s entry causes a decrease in ridership.
Finally, some researchers do not find a clear relationship between TNC and public transportation ridership. Feigon and Colin (2018) state it is not possible to determine the effects on TNCs on public transportation ridership on a national scale because TNCs’ impact varies by cities. Coogan et al. (2018), argue that public transit and TNCs may not be the most direct competitors with each other. They calculate the cross-demand elasticities between various modes of public transportation and TNCs after changing travel time and price. Coogan finds that the cross-demand elasticity between public transportation and TNCs is not significant and more specifically, the cross-demand elasticity between rail and TNCs is not significant. However, the cross-demand elasticities between bus and train are larger in magnitude, suggesting that these modes compete between each other.
The limited availability of granular TNC data over a long period of time has restricted past research. I add more precise measurements of the impact of TNCs on public transportation by using hourly TNC data over a period of about three years.
3. Context and Data
This study measures the impact of TNC operations on BART ridership at SFO. According to SFO, TNCs began to unofficially do business at SFO without permits in 2012, and although SFO asked TNCs to stop operations, TNCs continued. Between October 2014 to February 2015, SFO launched a pilot program to allow TNC operations in order to evaluate a new ground transportation business model. SFO released an official permit program in February 2016 (SFO November 2017). I choose to analyze BART operations during the time period 2011 to 2018, one year before the entrance of TNCs and three years after the official permit process.
My two main data sources are hourly BART and TNC ridership taken from the period 2011 to 2018. In Section 3a I begin by describing the BART data and then describe TNC data in Section 3b. In Section 3c, I compare basic ridership trends between BART and TNCs.
3a. BART Data
The original BART data, published by BART, includes ridership information between January 1, 2011 to September 2, 2018. Each observation includes the entry and exit station (route), the number of passengers that made a trip on this route, and the date and hour (datehour) of the trip. The original BART data set includes observations from every trip made within the entire system. I reduce the number of observations to 3,856,290 after keeping only observations for routes that begin or end at the SFO BART station. I then eliminate 42,051 observations for the SFO to SFO route assuming that this route was made by SFO employees commuting to and
from work. These employees do not make decisions between TNCs and BART like the average SFO customer because they ride BART at a discount directly to their job location. (SFO n.d.). Not all routes in the original data are present for each datehour between 2011 to 2018. There are gaps in routes during non-operating hours or when no passengers completed a specific route. To fill in the panel data set of each route, I assume that missing datehours and routes had 0 riders and fill in those observations with a 0. Now, every possible route to and from SFO has an
observation for almost every hour from January 1, 2011 to September 2, 2018. The final panel data is almost completely filled in and observes almost every route combination passing through the SFO BART station between 2011 to 2018. It contains 5,519,584 observations.
Total BART ridership through SFO was around 3.9 million in 2011, peaked at 4.7 million in 2014, and fell to 4.4 million in 2017 (Table A Appendix). The total number of riders passing through the BART SFO station ranged from 1 to 2,285 riders per hour during the period studied (Table B Appendix). Between 2011 to 2018, on average, 52% of BART trips passing through the SFO BART station were outbound away from SFO and 48% were inbound to SFO (Table C Appendix). This shows that, growth of BART ridership at SFO station has not relied
disproportionately on either inbound or outbound ridership and any shocks to ground transportation at SFO have affected BART ridership in both directions relatively equally. Between 2011 to 2018, the downtown San Francisco stations were the four most popular entry and exit stations (Table D Appendix). Around 42%
of all trips passing through SFO station start or end in downtown San Francisco suggesting that a majority of these trips are made for tourism or business. 3b. TNC Data
SFO administration provided the original TNC ridership data that spans between December 15, 2014 to September 2, 2018. Observations begin when SFO began to track Sidecar, one of the smaller TNCs that is now out of business. By May 2015, SFO was tracking all TNCs operating at SFO, including the two biggest
companies Uber and Lyft. Because of this, ridership is underreported up until May 2015. Each observation indicates the number of inbound and outbound at SFO for each datehour during the period studied. 32,879 observations remained after eliminating two observations taken before December 15, 2018.
Total TNC ridership was around 6.1 million in 2015 when SFO finally began to track all TNCs. Between 2015 to 2016 TNC ridership increased by 52% and between 2016 to 2017 increased by 29% (Table E Appendix). The number of TNC riders passing through SFO range between 1 to 4,160 per hour during the period studied (Table B Appendix). Excluding the anomaly year 2015, on average between 2014 to 2018, 46% of TNC trips at SFO were outbound and 54% inbound (Table C Appendix). In 2015, 40% of TNC trips were outbound 60% were inbound. These percentages suggest that like BART ridership, TNC growth has not been dependent on one direction of trip over the other.
3c. Comparing BART and TNC Data
Both BART and TNC ridership follow similar seasonal and weekly trends during the studied period. Seasonally, both modes on average have highest hourly ridership in August and lowest in January (Figure B Appendix). Average hourly ridership at SFO peaks for both modes on Friday and is the lowest on Saturday (Figure C Appendix).
Daily ridership trends differ between BART and TNCs due to availability of each mode during the time of day. BART ridership is highest in the afternoon and is zero during the non-operating hours of 12am to 4am (Figure D Appendix). During these non-operating hours, passengers take TNCs. Hourly TNC ridership, in contrast, is lowest in the late afternoon and highest late at night and in the morning. Often passengers must walk between the BART station and their origin or destination, so they are less inclined to take BART during night. For both modes, inbound ridership is higher than outbound ridership in the early morning, and outbound ridership is higher than inbound ridership at night.
Between 2015 to 2018 the correlation coefficient between inbound TNC ridership versus BART ridership is .103 and outbound TNC ridership versus BART ridership is .083 (Table F Appendix). The weak positive correlation reflects the fact that BART and TNC ridership at SFO increase between 2015 to 2018. Both modes’ ridership growth could be driven by increased air traffic or other unknown travel pattern factors.
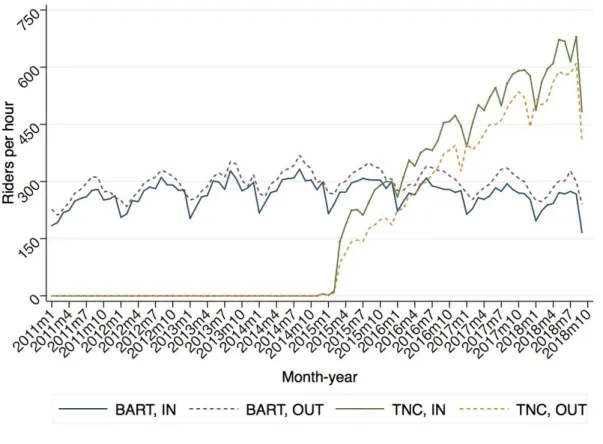
Comparing average hourly ridership between BART and TNCs supports a substitutional relationship between TNCs and BART. BART ridership peaks in 2014, right as TNC data begins. After 2014, the number of average hourly TNC riders at SFO grows rapidly while the number of BART riders at SFO decreases gradually (Figure E Appendix). This suggests that the increasing TNC ridership is partially responsible for declining BART ridership.
4. Model and Result
This study uses a fixed effects model and clusters by route to account for differences in route characteristics. Each station differs in distance from SFO, condition, type of neighborhood such as business or residential, and demographics surrounding the station. These factors impact the frequency of trips made on each route that passes through SFO. I use fixed effects on the routes to standardize the number of riders on each route. I also cluster by route because each observation is correlated with all other observations of the same route.
(1) 𝑏𝑎𝑟𝑡𝑟𝑖𝑡[𝐷] = 𝛽0𝑡𝑛𝑐𝑡+ 𝛽1𝑑𝑡+ 𝛽2𝑡𝑛𝑐𝑡 ∗ 𝑑𝑡 + 𝛽3𝑡𝑛𝑐𝑟𝑡[𝐷] + 𝑚𝑛𝑡 + 𝑑𝑜𝑤𝑡 + ℎ𝑟𝑡 + 𝜀𝑖𝑡 where the direction of trip is D= { 𝑖𝑛, inbound towards airport
𝑜𝑢𝑡, outbound leaving airport
The dependent variable,𝑏𝑎𝑟𝑡𝑟𝑖𝑡is BART ridership by route i and unique
in January 2011. I separately estimate the change in BART ridership by direction D, where in is inbound and out is outbound. The dummy variable 𝑡𝑛𝑐𝑖𝑡 indicates if
TNCs began operating at SFO at time t. 𝑡𝑛𝑐𝑖𝑡 takes the value 1 if the observation falls
after July 2012. Until December 2012, SFO was “in denial” about TNC operations at SFO (SFO 2017), and I estimate that the actual emergence of TNC at SFO started in July 2012. 𝑑𝑡 is the date and 𝛽1 is the linear time trend before TNCs began operating.
The coefficient 𝛽2from interacting 𝑡𝑛𝑐𝑖𝑡 and 𝑑𝑡 shows the change in 𝑑𝑡 after TNCs
began operating. The variable 𝑡𝑛𝑐𝑟𝑖𝑡 is TNC ridership for each unique datehour t and
its direction D depends on the direction of 𝑏𝑎𝑟𝑡𝑟𝑖𝑡. 𝛽3 measures the average impact
of an additional TNC rider on all BART ridership for all routes passing through SFO. I account for seasonal, weekly, and hourly trends in ground and air traffic using the dummy variables 𝑚𝑛𝑡 , day of week 𝑑𝑜𝑤𝑡 , and hour ℎ𝑟𝑡.
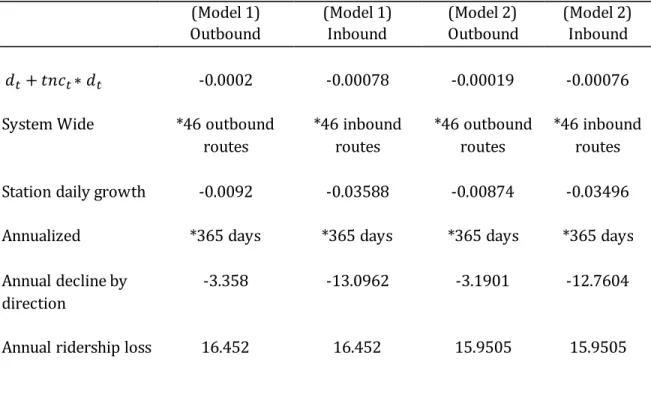
Columns 1 and 2 in Figure F present the results for Model 1 “Outbound” and “Inbound” regressions (Appendix). In the “Outbound” regression, the coefficient for the linear time trend 𝑑𝑡is .00145 and statistically significant at 1%. This means that
on average, on each of the 46 outbound routes, BART ridership grows .00145 riders per day without the presence of TNCs. However, the highly statistically significant coefficient of the interaction variable 𝑡𝑛𝑐𝑡∗ 𝑑𝑡 shows that the marginal effect of
TNCs presence on 𝑑𝑡 is -0.00165. The coefficients for the Model 1 “Inbound”
regression are interpreted in the same way. Without TNCs, daily ridership growth rate is .00149 on average for all inbound routes, but after TNCs begin operations, the marginal effect on the growth rate is -0.00227 on all inbound routes.
Because the magnitude of the coefficient of 𝑡𝑛𝑐𝑡∗ 𝑑𝑡 is negative and a larger
magnitude than the magnitude of 𝑑𝑡 , daily ridership post-TNCs declines by .0002
riders on each outbound route and .00078 riders on each inbound route. This new negative growth rate is shown in rows 1 and 2 of Figure F (Appendix). While the inbound coefficient is statistically significant at 1%, the outbound coefficient is not statistically significant. I believe that after addressing endogeneity, the outbound coefficient will become statistically significant. Model 1 estimates that 16.5 less riders use the SFO BART annual after the appearance of TNCs. Table G shows how I calculate the entire station impact of the daily ridership decline, annualize this decline, and the aggregate outbound and inbound declines to reach 16.5 riders (Appendix).
Although the coefficients for 𝑡𝑛𝑐𝑟𝑡 are positive and statistically significant in
both the “Outbound” and “Inbound” regressions, these do not support a complementary relationship. Instead, 𝑡𝑛𝑐𝑟𝑡 and 𝑏𝑎𝑟𝑡𝑟𝑖𝑡are simultaneously
determined by uncontrolled factors such as air traffic. As more people deplane or enplane at SFO, the demand for both modes rise.
The “Outbound” and “Inbound” coefficients for the dummy variable 𝑡𝑛𝑐𝑡 are
also positive and large in magnitude, but do not imply a complementary
relationship. 𝑡𝑛𝑐𝑡indicates datehours after July 2012 and because BART ridership
increases over the time period studied, the coefficient is positive. Furthermore, the coefficients overestimate the effect of TNC presence in January 2015 because there is no TNC data before this month.
(2) 𝑏𝑎𝑟𝑡𝑟𝑖𝑡[𝐷] = 𝛽0𝑡𝑛𝑐𝑡+ 𝛽1𝑑𝑡+ 𝛽2𝑡𝑛𝑐𝑡 ∗ 𝑑𝑡 + 𝛽3𝑡𝑛𝑐𝑟𝑡[𝐷] + ℛ𝑖𝑡 ∗ Γ + 𝛽4𝑟𝑎𝑖𝑛𝑡[𝐿] +
𝛽5𝑟𝑎𝑖𝑛𝑡[𝐿] ∗ 𝑡𝑛𝑐𝑡+ 𝑚𝑛𝑡+ 𝑑𝑜𝑤𝑡 + ℎ𝑟𝑡 + 𝜀𝑖𝑡
where the direction of trip is D= { 𝑖𝑛, inbound towards airport 𝑜𝑢𝑡, outbound leaving airport
where the location of rain is L = {𝑑𝑡𝑠𝑓 if D is inbound 𝑠𝑓𝑜 if D is outbound
In Model 2, I add ℛ, a matrix of dummy variables indicating shocks in BART
service due to closures, delays, or holiday schedules; the estimated coefficients are in the vector Γ. Closures and delays increase BART travel time which significantly
decrease the attractiveness of taking BART. BART administration provided data for all significant line closures, system delays, and one storm between January 1, 2011 to September 2, 2018. I eliminate Intra-East Bay shocks since these lines are not directly connected to SFO. Delays and closures that affected the entire system,
Transbay crossings, and intra-San Francisco operations remain. Closures completely eliminate the option to travel by BART for passengers. Delays significantly decrease the attractiveness of taking BART for passengers who compare travel times of TNC and BART when choosing a mode.
I also add the variable 𝑟𝑎𝑖𝑛𝑡 which is hourly inches of precipitation at
location L. 𝑟𝑎𝑖𝑛𝑡 is measured where the passenger starts their trip and is deciding
what mode to take. I measure 𝑟𝑎𝑖𝑛𝑡 at SFO sfo for outbound trips which begin at
SFO and at Downtown San Francisco dtsf for inbound trips. I choose to measure rain for the inbound regression at Downtown San Francisco since around 42% of all trips
to and from SFO begin or end at a Downtown San Francisco station (Table D Appendix). 𝛽5 from the interaction term 𝑟𝑎𝑖𝑛𝑡∗ 𝑑𝑡 indicates how the weather
impacts daily linear 𝑏𝑎𝑟𝑡𝑟𝑖𝑡 growth if the option of TNCs is available.
Columns 3 and 4 in Figure F present the results for Model 2 “Outbound” and “Inbound” regressions respectively (Appendix). After accounting for BART shocks, the coefficients of the linear growth trends 𝑑𝑡 and 𝑡𝑛𝑐𝑡 ∗ 𝑑𝑡do not change or only
change by 0.00001, and the significance levels remain the same. Model 2 explains only slightly more of the variation in BART ridership with the additional variables than Model 1.
Because Model 2’s coefficients for 𝑑𝑡 and 𝑡𝑛𝑐𝑡 ∗ 𝑑𝑡 do not dramatically
change, the new estimated post-TNC daily growth rates are only slightly smaller in magnitude. Model 2 shows a smaller loss of annual ridership at the SFO BART after the appearance of TNCs; Model 2 measures 16 less riders. Table G shows how I calculate the entire station impact of the daily ridership declines, annualize this decline, and the aggregate outbound and inbound declines to reach 16 riders (Appendix).
In Model 2 “Outbound,” the coefficient for the interaction term 𝑟𝑎𝑖𝑛𝑡 ∗ 𝑡𝑛𝑐𝑡
shows that, with the presence of TNCs, for each additional inch of rain at SFO, BART ridership on all outbound routes will decrease by .66635 riders for the day. In Model 2 “Inboiund,” for each additional inch of rain at Downtown San Francisco, with the presence of TNCs, BART ridership on all inbound routes will decrease by .11881 riders for the day. Rain dramatically decreases the attractiveness of BART since
many passengers walk to and from their location and stations. However, with the option of TNCs, passengers are more likely to choose TNCs because this mode directly picks up and drops off passengers at locations.
The coefficients for 𝑡𝑛𝑐𝑟𝑡 and 𝑡𝑛𝑐𝑡 in Model 2 “Outbound” and “Inbound”
regressions remain positive. As in Model 1, these coefficients do not support a complementary relationship between BART and TNCs; rather they suggest that TNC and BART ridership are simultaneously determined by unobserved factors.
5. Conclusion
Measuring the relationship between TNCs and public transit is imperative for cities, planners, and public transit agencies to make informed decisions. Cities and planners must understand how demand for both modes is changing to best manage limited space on the streets and prioritize modes. Public transit agencies must understand their relation to TNCs to plan future operations, capital projects, and sources of financing. TNCs have disrupted the past structure of public
transportation and will continue to change the transportation industry.
TNCs have an advantage when planning because they have more data than public agencies to make informed decisions. Because they can access both their own private data and publicly available data, TNCs have better measure of their impact and power in the transportation industry. Public agencies and cities must
what degree TNCs positively or negatively affect public transit ridership can determine if public agencies and cities decide to treat TNCs as a threat or as a partner.
Using the relationship between BART and TNC at SFO as a case study, I add quantitative evidence that TNCs are a substitute to rail ridership. I find that without the presence of TNCs, BART ridership at the SFO BART station grows by 50 riders per year, but after the entrance of TNCs, station ridership decreases by 16 riders per year. These results reflect the trend of average hourly BART rides during the period studied (Figure E Appendix). After running a fitted line through the historical average of BART rides per hour, I see that BART ridership rises and suddenly declines when TNCs begin operating (Figure G Appendix).
The low R-squared in all regressions suggests that there is omitted variable bias. I will add parking data to account for the impact of personal vehicles on BART ridership. It is also possible that TNC and BART ridership may both rise because TNCs serve areas outside of BART service such as south of SFO. TNCs growth is not solely based on taking potential BART customers. However, it is unlikely I will be able separate out which TNC and BART rides compete with each other since data on TNC origins and destinations is confidential.
I will better measure the impact on the emergence of TNCs at SFO by extrapolating TNC data during the time period when TNCs operated, but were not tracked.
Future research will primarily focus on better measuring ground transportation demand at SFO in my model. This demand contributes to the simultaneous growth of BART and TNC ridership which may be leading to low significance levels and biased coefficients for the variables 𝑡𝑛𝑐𝑡, 𝑑𝑡, and 𝑡𝑛𝑐𝑡 ∗ 𝑑𝑡. To
proxy for transportation demand, I can use air passenger deplaning and enplaning data. Doing so will reduce misestimation of coefficients in the models’ time
dependent variables which are picking up BART growth driven by transportation demand increasing over time. The coefficient for 𝑡𝑛𝑐𝑡 was overestimated due to lack
of data between the time TNCs began operating and SFO began tracking. I will extrapolate TNC data during this period. Finally, I will use an instrumental variable for 𝑡𝑛𝑐 𝑟𝑡 to create an exogeneous variable that measures the impact of TNC supply
on BART ridership, independent of unobserved factors. Freeway traffic surrounding SFO is a possible instrument since it is likely to affect the supply of 𝑡𝑛𝑐 𝑟𝑡and be
6. Appendix
Figure A: Complete BART System Map as of November 2018
The BART San Francisco International Airport station is directly at SFO.
Table A: Total Annual BART Ridership at SFO BART Station
Year Total BART Ridership % Growth
2011 3,936,380 2012 4,353,531 10% 2013 4,430,968 2% 2014 4,713,458 6% 2015 4,688,479 -1% 2016 4,588,881 -2% 2017 4,429,202 -4% 2018* 2,805,834 -58%
Table B: Summary Statistics
Hourly Ridership Observations Mean SD Min Max
BART: Total at SFO* 5,519,584 564.6 313.8 1 2,285
TNC: Outbound** 2,664,329* 379.9 311.9 0 3,420
TNC: Inbound** 2,664,329* 442.8 326.5 0 1,775
TNC in Action 5,519,584 0.805 0.396 0 1
Date 5,519,584 13Nov2014 na 1Jan2011 2Sep2018
TNC in Action Date 5,519,584 12Aug2015 na 2Jul2012 2Sep2018
BART Delay 5,519,584 0.003 0.059 0 1
BART Closure 5,519,584 0.004 0.067 0 1
BART Holiday 5,519,584 0.020 0.139 0 1
Inches Rain SFO 5,519,584 0.002 0.017 0 .7
Inches Rain DTSF 5,489,575 0.002 0.013 0 .5
*Dependent variable
**Calculated starting in 2015 when SFO began observing all TNCs operating
Table C: Inbound vs. Outbound Ridership
Year Inbound BART Outbound BART Inbound TNC Outbound TNC
2011 47.9% 52.1% 2012 48.3% 51.7% 2013 48.1% 51.9% 2014 47.9% 52.1% 53.0% 47.0% 2015 47.7% 52.3% 60.3% 39.7% 2016 47.3% 52.7% 55.6% 44.4% 2017 47.2% 52.8% 53.5% 46.5% 2018 46.8% 53.2% 52.2% 47.8%
Both BART and TNC ridership are spilt relatively evenly between inbound and outbound. Ridership growth for both modes does not overwhelming depend on either outbound or inbound trips.
Table D: Most Popular Routes Through SFO BART Station
Rank Origin Station
For Inbound Trips
% Destination Station For Outbound Trips
%
1 Powell 19% Powell 21%
2 Civic Center 8% Civic Center 8%
3 Embarcadero 7% Embarcadero 7%
4 Montgomery 7% Montgomery 7%
5 Millbrae 5% Millbrae 5%
The first four most popular origins and destinations for routes passing through SFO station are in Downtown San Francisco. These make up around 40% of all trips made through SFO station.
Table E: Total Annual TNC Ridership at SFO
Year Total BART Ridership % Growth
2015 2,938,638
2016 6,116,818 52%
2017 8,595,986 29%
2018* 8,017,086 -7%
Figure B: Monthly Ridership Trends at SFO, BART vs TNC
BART averages calculated from 2011 to 2018. TNC averages calculated starting in 2015 when SFO began tracking all TNCs. Outbound ridership is slightly higher than inbound for BART and outbound ridership is slightly higher than inbound for TNCs. This reflects the inbound/outbound percentage break down of both modes.
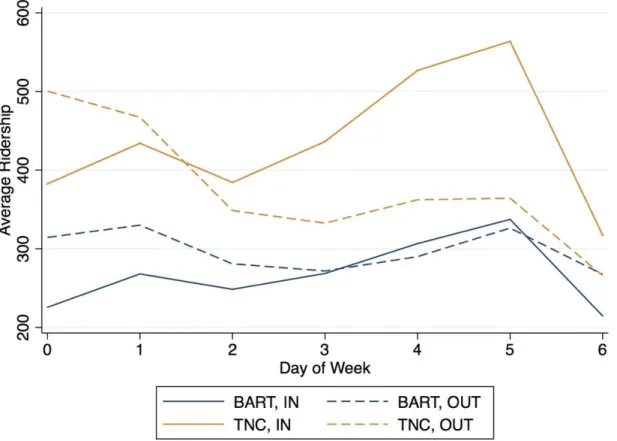
Figure C: Weekly Ridership Trends at SFO, BART vs TNC
Sunday=0, Saturday=6
BART averages calculated from 2011 to 2018. TNC averages calculated starting in 2015 when SFO began tracking all TNCs. Outbound ridership is slightly higher than inbound for BART and outbound ridership is slightly higher than inbound for TNCs. This reflects the inbound/outbound percentage break down of both modes.
Figure D: Hourly Ridership Trends at SFO, BART vs. TNC
BART averages calculated from 2011 to 2018. TNC averages calculated starting in 2015 when SFO began tracking all TNCs. During BART non-operating hours from 12am to 4am, passengers choose TNCs.
Table F: Correlation between BART and TNC 2015-2018
BART TNC Outbound TNC Inbound
BART 1
TNC Outbound 0.103 1
TNC Inbound 0.083 0.217 1
All values are calculated starting in 2015 when SFO began to track all TNCs. There is a weak positive correlation between BART and TNC ridership outbound and TNC ridership inbound. These numbers do not imply causation.
Figure E: Ridership Trends at SFO TNC vs. BART 2011-2018
The jump in TNC ridership from 2014 to 2015 is overestimated. TNCs began to operate at SFO in 2012, but SFO began to collect all TNC data in 2015. Outbound ridership is slightly higher than inbound for BART and outbound ridership is slightly higher than inbound for TNCs. This reflects the inbound/outbound percentage break down of both modes.
Figure F: Regressions
(Model 1) (Model 1) (Model 2) (Model 2)
VARIABLES Outbound Inbound Outbound Inbound
𝑡𝑛𝑐𝑖𝑡 32.12233*** 44.17148*** 32.08327*** 43.87925*** (7.65052) (10.80535) (7.56198) (10.72699) 𝑑𝑡 0.00145*** 0.00149*** 0.00146*** 0.00149*** (0.00026) (0.00032) (0.00026) (0.00032) 𝑡𝑛𝑐𝑡∗ 𝑑𝑡 -0.00165*** -0.00227*** -0.00165*** -0.00225*** (0.00039) (0.00056) (0.00039) (0.00055) 𝑑𝑡+ 𝑡𝑛𝑐𝑡∗ 𝑑𝑡 -0.0002 -0.00078*** -0.00019 -0.00076*** (0.00014) (0.00025) (0.00014) (0.00024) 𝑡𝑛𝑐𝑟𝑡[𝐷] 0.00044 0.00148*** 0.00044 0.00146*** (0.00028) (0.00027) (0.00028) (0.00027) 𝑟𝑎𝑖𝑛𝑡[𝐿] ∗ 𝑡𝑛𝑐𝑡 -0.66500 -0.12030 (0.62015) (0.58451) 𝑑𝑡+ 𝑟𝑎𝑖𝑛𝑡[𝐿] ∗ 𝑡𝑛𝑐𝑡 -0.66635 -0.11881 (0.62025) (0.58459) R-squared 0.14126 0.14896 0.14177 0.14947
*** p<0.01, ** p<0.05, * p<0.1. Standard errors are clustered at the route level and shown in parentheses. All regressions are fixed effects on routes. Additional time fixed effects month-year, day of week, and hour are included. In columns 3 and 4, I include a matrix of BART shocks and measure the level of precipitation in 𝑟𝑎𝑖𝑛𝑡. 1 and 3 “Outbound” show the average impact on all BART routes outbound from SFO station. Columns 2 and 4 “Inbound” show the average impact on all BART routes inbound to SFO station. There are 46 routes inbound and 46 routes outbound.
Table G: Annual Decrease in Ridership at BART SFO Station
(Model 1) (Model 1) (Model 2) (Model 2)
Outbound Inbound Outbound Inbound
𝑑𝑡+ 𝑡𝑛𝑐𝑡∗ 𝑑𝑡 -0.0002 -0.00078 -0.00019 -0.00076
System Wide *46 outbound
routes *46 inbound routes *46 outbound routes *46 inbound routes
Station daily growth -0.0092 -0.03588 -0.00874 -0.03496
Annualized *365 days *365 days *365 days *365 days
Annual decline by direction
-3.358 -13.0962 -3.1901 -12.7604
Annual ridership loss 16.452 16.452 15.9505 15.9505
Starting with post-TNC ridership decline rate, I calculate the entire station impact, annualize this number, and aggregate the inbound and outbound ridership
Figure G: BART Month-Year Ridership Trends Pre-TNC vs Post-TNC
I run a fitted line through the average rides per hour shown in Figure E. Before TNCs (I estimate entrance in July 2012), BART ridership increases. However, after TNCs begin operations, average hourly BART ridership declines. This reflects the
7. Works Cited
American Association of Motor Vehicle Administrators. n.d. "Transportation Network Companies." Accessed November 09, 2018.
https://www.aamva.org/TransportationNetworkCompanies/
Bay Area Rapid Transit. 2018. “Hourly Ridership by Origin-Destination Pairs.” Accessed October 15, 2018.
<http://64.111.127.166/origin-destination/>
Clewlow, Regina R. and Gouri S. Mishra. 2017. “Disruptive Transportation: The Adoption, Utilization, and Impacts of Ride-Hailing in the United States. “Institute of Transportation Studies, University of California, Davis, Research Report UCD-ITS-RR-17-07.
Coogan, Matthew et al. 2018. “Understanding Changes in Demographics,
Preferences, and Markets for Public Transportation.” TCRP Research Report no. 201 (October): 1-84.
Department of Commerce. 2018. “Local Climatological Data.” National Centers for Environmental Information
Doppelt, Lawrence. “Need a Ride? Uber Can Take You (Away from Public
Transportation).” Master’s thesis, Georgetown University, 2018. ProQuest (10791830).
Feigon, Sharon and Colin Murphy. 2018. “Broadening Understanding of the Interplay Between Public Transit, Shared Mobility, and Personal
Automobiles” Pre-publication draft of TCRP Research Report no. 195: 1-104. Hawkins, Andrew. 29 July, 2017. “Uber Just Completed Its 5 Billionth Trip, Proving
Most People Are Okay with All the Scandals.” Accessed November 09, 2018. < https://www.theverge.com/2017/6/29/15894130/uber-5-billion-trips-milestone-scandals>
Hooson, Roger. “Hourly TNC data.” Email. 2015.
Jonathan D. Hall & Craig Palsson & Joseph Price. 2017. "Is Uber a substitute or complement for public transit?," Working Papers tecipa-585, University of Toronto, Department of Economics. July 2017.
Lee, Dennis. “BART historical service closures 2011-2018.” Email. 2018.
Rayle, Lisa et al. 2015. “Just a Better Taxi? A Survey-Based Comparison of Taxis, Transit, and Ridesourcing Services in San Francisco” Journal Elsevier Transport Policy no. 45 (November): 168-178.
Sadowsky, Nicole and Erik Nelson. 2017. "The Impact of Ride-Hailing Services on Public Transportation Use: A Discontinuity Regression Analysis.” Economics Department Working Paper Series. 13, Bowdoin College, Brunswick, ME, May 2017.
San Francisco County Transportation Authority. 2017. “TNCs Today: A Profile of San Francisco Transportation Network Company Activity.” San Francisco County Transportation Authority.
San Francisco International Airport. 2017. “TNC White Paper.” San Francisco International Airport.
San Francisco International Airport. n.d. “BART Discount Card.” SFO Connect.
Wallsten, Scott. 2015. “The Competitive Effects of the Sharing Economy: How is Uber Changing Taxis?” Technology Policy Institute.
Wang, Hai and Amedeo Odoni. 2016. “Approximating the Performance of a ‘Last Mile’ Transportation System.” Transportation Science vol. 50 no. 2 :659-675.