Open Access Dissertations Theses and Dissertations
Fall 2014
Energy production, distribution, and pollution
controls: Combining engineering and economic
analysis to enhance efficiency and policy design
David F. Perkis Purdue University
Follow this and additional works at:https://docs.lib.purdue.edu/open_access_dissertations Part of theAgricultural Economics Commons,Economics Commons, and theEnvironmental Sciences Commons
This document has been made available through Purdue e-Pubs, a service of the Purdue University Libraries. Please contact [email protected] for additional information.
Recommended Citation
Perkis, David F., "Energy production, distribution, and pollution controls: Combining engineering and economic analysis to enhance efficiency and policy design" (2014).Open Access Dissertations. 346.
PURDUE UNIVERSITY
GRADUATE SCHOOL
Thesis/Dissertation Acceptance
7KLVLVWRFHUWLI\WKDWWKHWKHVLVGLVVHUWDWLRQSUHSDUHG %\ (QWLWOHG )RUWKHGHJUHHRI ,VDSSURYHGE\WKHILQDOH[DPLQLQJFRPPLWWHH $SSURYHGE\0DMRU3URIHVVRUVBBBBBBBBBBBBBBBBBBBBBBBBBBBBBBBBBBBB BBBBBBBBBBBBBBBBBBBBBBBBBBBBBBBBBBBB $SSURYHGE\ +HDGRIWKH'HSDUWPHQW*UDGXDWH3URJUDP 'DWHTo the best of my knowledge and as understood by the student in the Thesis/Dissertation Agreement, Publication Delay, and Certification/Disclaimer (Graduate School Form 32), this thesis/dissertation adheres to the provisions of Purdue University’s “Policy on Integrity in Research” and the use of copyrighted material.
David F. Perkis
ENERGY PRODUCTION, DISTRIBUTION, AND POLLUTION CONTROLS: COMBINING ENGINEERING AND ECONOMIC ANALYSIS TO ENHANCE EFFICIENCY AND POLICY DESIGN Doctor of Philosophy Wallace E. Tyner Timothy N. Cason Benjamin M. Gramig Wallace E. Tyner Thomas W. Hertel Kenneth A Foster 12/10/2014
ENERGY PRODUCTION, DISTRIBUTION, AND POLLUTION CONTROLS: COMBINING ENGINEERING AND ECONOMIC ANALYSIS TO ENHANCE
EFFICIENCY AND POLICY DESIGN
A Dissertation Submitted to the Faculty
of
Purdue University by
David F. Perkis
In Partial Fulfillment of the Requirements for the Degree
of
Doctor of Philosophy
December 2014 Purdue University West Lafayette, Indiana
This is dedicated to my wife, Kristin, and my children, Andrew and Olivia. Your commitment to my work, patience in my absence, and love in my presence have meant
ACKNOWLEDGEMENTS
I would like to acknowledge the support of Professor Wallace Tyner, whose
encouragement has been essential not just across the wide breadth of my research efforts, but in my teaching endeavors as well.
I would also like to thank my advisors, Professors Timothy Cason, Thomas Hertel, and Benjamin Gramig, for their unique and significant contributions with respect to learning how to model economic systems.
I would like to acknowledge the members of our department who have fostered my development as an instructor, including Professors Kenneth Foster, Frank Dooley, Sally Thompson, Craig Dobbins, and Michael Gunderson, as well as Dr. Harlan Day of the Indiana Council for Economic Education.
Finally, I would like to thank Professor Carol Runyan, who provided me with my first leadership role in an academic setting, affording me the opportunity to develop my abilities as a researcher and leader within academia.
TABLE OF CONTENTS
Page
LIST OF TABLES ... vii
LIST OF FIGURES ... ix
ABSTRACT ... xi
CHAPTER 1. INTRODUCTION ... 1
1.1 There are Few Representative Molecules ... 2
1.2 The Social Planner vs. Profit Maximizing Firms... 3
1.3 Mathematical Predictions and Human Behavior ... 5
1.4 References ... 6
CHAPTER 2. ECONOMIC ANALYSIS OF A MODIFIED DRY GRIND ETHANOL PROCESS WITH RECYCLE OF PRETREATED AND ENZYMATICALLY HYDROLYZED DISTILLERS’ GRAINS... 8
2.1 Abstract ... 8
2.2 Introduction ... 9
2.3 Methodology ... 11
2.3.1 The Base Process ... 12
2.3.2 Pretreated Liquid ... 13
2.3.3 Price Expectations for eDDGS and enzymes ... 14
2.4 Results ... 16
2.4.1 Pretreatment Module: Pricing Adjustments ... 20
2.4.2 Pretreatment Module: Process Flows, Capital, and Operating Costs and Revenue ... 20
2.4.3 Pretreatment Module: Financials ... 22
Page
2.4.5 Sensitivity to Enzyme Mix Pricing ... 23
2.5 Summary and Conclusions ... 23
2.6 Acknowledgments... 25
2.7 References ... 25
CHAPTER 3. SPATIAL OPTIMIZATION AND ECONOMIES OF SCALE FOR CELLULOSIC TO ETHANOL FACILITIES IN INDIANA ... 27
3.1 Abstract ... 27 3.2 Introduction ... 28 3.3 Methodology ... 31 3.4 Results ... 38 3.5 Discussion ... 43 3.6 References ... 46
CHAPTER 4. AN EXPERIMENTAL INVESTIGATION OF HARD AND SOFT PRICE CEILINGS IN EMISSIONS PERMIT MARKETS ... 48
4.1 Abstract ... 48
4.2 Introduction ... 49
4.3 Structure of Ceiling Mechanism ... 52
4.4 Expectations in a Repeated Static Environment ... 54
4.5 Methodology ... 56
4.6 Results ... 60
4.6.1 Prices in the Main (Initial) Auction ... 60
4.6.2 Session Price Trends and Reserve Auction Prices ... 66
4.6.3 Welfare Gains from Trade ... 67
4.7 Discussion ... 69
4.8 Acknowledgments... 72
4.9 References ... 72
APPENDICES Appendix A Spatial Optimization for Cellulosic to Ethanol Facilities in Indiana with Sequential Start-ups ... 75
Page
Appendix B Links to Software Programs... 79
Appendix C Subject Instructions for Soft Ceiling Design ... 80
Appendix D Subject Instructions for Reserve Auction Design ... 101
Appendix E Subject Instructions for Baseline Design ... 122
Appendix F Subject Instructions for Hard Ceiling Design ... 140
LIST OF TABLES
Table ... Page Table 2.1 Total Swine Feed Nutrition Limits in Feed Cost Model for Swine Feed
Containing 15% DDGS or eDDGS... 15
Table 2.2 Key Prices and Economic Assumptions ... 17
Table 2.3 Capital and Financial Analysis of the Base and Alternative Processes. ... 18
Table 2.4 Annual Revenue and Operating Cost Details of the Base and Alternative Processes ... 19
Table 2.5 Input and Output Rate Changes of Major Ingredients between the Alternative Process and the Base Process ... 20
Table 2.6 DDGS and eDDGS Nutrient Analysis ... 21
Table 2.7 Capital Costs for the Base Process and Alternative Process ... 22
Table 3.1 Indiana Ethanol Supply Capabilities from Major Cellulosic Sources ... 34
Table 3.2 Raw Material and Transportation Costs for Harvested Crops and Shipped Product. ... 36
Table 3.3 Assumptions for Financial Analysis to Annualize Economies of Scale Which Would Cover Increased Shipping Distances Associated with Larger Plant Sizes... 37
Table 3.4 Operating Cost Savings and Their Economy of Scale Equivalents Which Lead to the Transition from 50 Million Gallon Facilities to 100 Million Gallon Facilities for the Production of Cellulose Source Ethanol. ... 38
Table ... Page Table 3.5 Cost Ranking and Biomass Percentages for Each Plant Site Based on Cost
Minimization Procedure: Billion-Ton Assumptions without Economies of Scale ... 40
Table 4.1 p-Values for Main Auction Treatment Comparisona ... 62
Table 4.2 Estimates of the Mean Price in the Main Auction for the First Period ... 64
Table 4.3 Comparing Estimates of the Main Auction Mean Price across Treatments ... 65
Table 4.4 EstimaWHVRIWKH0HDQ3ULFHLQWKH5HVHUYH$XFWLRQȕi2, t Æ... 67
Table 4.5 Comparison of Welfare Gains from Trade for End of Session ȕi2, t Æa .... 69
Table A.1 Cost Ranking and Corn Stover Percentages for Each Plant Site Based on Cost Minimization Procedure: Billion-Ton Assumptions without Economies of Scale ... 78
LIST OF FIGURES
Figure ... Page Figure 2.1 Schematic Flow Diagram of Current Dry Grind Ethanol Process. Water Utilization for Cooling of Heat Exchangers Is Not Shown (Kim)... 10 Figure 2.2 Schematic Flow Diagram of Alternative Dry Grind Process with Recycle of Distiller’s Grains (Wet Cake) to Liquefaction (Kim). ... 11 Figure 3.1 Optimal Counties of Manufacturing Sites for the Biochemical Conversion of Corn Stover, Switchgrass, and Poplar to Ethanol Based on Billion-Ton Study Projections and No Economies of Scale. ... 39 Figure 3.2 Optimal Counties of Manufacturing Sites for the Biochemical Conversion of Corn Stover and Switchgrass to Ethanol Based on Billion-Ton Study Projections and Economies of Scale. ... 41 Figure 3.3 Optimal Counties of Manufacturing Sites for the Biochemical Conversion of Corn Stover, Switchgrass, and Poplar to Ethanol Based on Conservative Total Yield Estimates and No Economies of Scale... 42 Figure 3.4 Optimal Counties of Manufacturing Sites for the Biochemical Conversion of Corn Stover and Switchgrass to Ethanol Based on Conservative Total Yield Estimates and Economies of Scale. ... 43 Figure 4.1 Controlling High Prices with a Soft Ceiling... 53
Figure ... Page Figure 4.2 Four Policy Treatments Tested as Price Controls in an Experimental Market. ... 58 Figure 4.3 Demand and Supply for Permits in Emissions Market (Soft Ceiling). ... 59 Figure 4.4 Mean of Last 8 Trades in Initial Auction for Each Period (All Sessions) ... 61 Figure 4.5 Mean of Last 8 Trades in Initial Auction for Last 5 Periods (All Sessions) ... 62 Figure A.1 Sequential Start-Up of Manufacturing Sites for the Biochemical Conversion of Corn Stover and Switchgrass to Ethanol Based on Low Yield Assumptions and No Economies of Scale. ... 77
ABSTRACT
Perkis, David F. Ph.D., Purdue University, December 2014. Energy Production,
Distribution, and Pollution Controls: Combining Engineering and Economic Analysis to Enhance Efficiency and Policy Design. Major Professor: Wallace Tyner.
Three published articles are presented which focus on enhancing various aspects of the energy supply chain. While each paper adopts a different methodology, all three combine engineering data and/or techniques with economic analysis to improve
efficiency or policy design within energy markets.
The first paper combines a chemical engineering plant design model with an economic assessment of product enhancements within an ethanol production facility. While a new chemical process is shown to achieve greater ethanol yields, the animal feed by-products are denatured and decrease in value due to the degradation of a key
nutritional amino acid. Overall, yield increases outweigh any costs, providing additional value to firms adopting this process. The second paper uses a mixed integer linear model to assess the optimal location of cellulosic ethanol production facilities within the state of Indiana. Desired locations with low costs are linked to regions with high yield corn growth, as these areas provide an abundance of corn stover, a by-product of corn and a cellulosic source of ethanol. The third paper implements experimental economic methods to assess the effectiveness of policies intended to control prices in emissions permit markets. When utilizing reserve permit auctions as an alternative to setting explicit maximum prices, prices are elevated beyond the theoretical predictions of the model within the conditions of the experiment. The most likely cause of higher prices is the negotiating power provided to sellers by grandfathering permits as evidenced by higher than expected welfare gains to sellers.
Before presenting the articles, a discussion is introduced regarding the role of assumptions used by economists. For each article, a key assumption is highlighted and the consequences of making a different assumption are provided. Whether the
consequences are large or small, the benefits of elucidating our models with assumptions based on real world behaviors are clearly demonstrated.
CHAPTER 1. INTRODUCTION
Scientific theories are distinguished from myths merely in being
criticizable, and in being open to modifications in the light of criticism. They can be neither verified nor probabilified.
Karl Popper, Realism and the Aim of Science (Karl Popper, 1992)
Since the financial crisis of 2008, economists have been looking for answers as to what went wrong with the banking system and the economy. While theories abound, Nobel laureate Paul Krugman provides some wise insight when stating that “the
economics profession went astray because economists, as a group, mistook beauty, clad in impressive-looking mathematics, for truth.” (Paul Krugman, 2009) Often hidden in many of our mathematical equations are simplifying assumptions. If these assumptions are incorrect but on the periphery of the problem at hand, then it is often not an issue. If, however, there are incorrect simplifying assumptions which change some key aspects of an economic problem, and other conclusions are built on top of these assumptions, then many of these conclusions are likely to be erroneous.
The fields of energy and environmental economics lend themselves to combining engineering and economic analysis to identify solutions to technological hurdles and policy debates. Beyond simply lending technical data to the economist, research methods in the engineering sciences can prove useful. While no one would expect any researcher to provide a model that avoids the criticisms of an empiricist of the ilk of Karl Popper, practiced engineers are often quite skilled at adopting simplifying assumptions while maintaining a few essential necessary complexities which allow the model to represent real world behavior.
The three enclosed chapters each focus on a distinct issue related to optimizing energy supplies in the United States through improvements in either productive
efficiency or policy design1. Each chapter also depends on engineering and scientific
data to either describe or solve an economic problem. Finally, each chapter provides an example of how a simplifying assumption could cause a researcher to go astray, whereas an assumption based in real world behavior provides more reasonable results.
1.1 There are Few Representative Molecules
The first paper offers an economic assessment of a manufacturing process intended to generate larger yields of ethanol and more value from corn (David Perkis et al., 2008). The intent of the process is to transform distiller’s dry grains (DDGS), a by-product of ethanol by-production used as a source of nutrition for hogs and cattle, into a higher value feed by increasing protein concentrations. This would be achieved while simultaneously extracting more pure ethanol from the DDGS. In this way, value would be added to two product streams with the only added costs being those related to
additional capital and processing expenditures.
A combined chemical, engineering, and economic cost model demonstrates that the value added from larger ethanol yields outweighs the added manufacturing costs. However, when analyzing the new DDGS by-product via a nutritional assessment, it is determined that in spite of larger protein concentrations, the value has been decreased. The drop in value is caused by the disproportionate degradation of lysine, a key amino acid in the nutritional profile of swine and hogs, due to the use of heat in the new chemical process. In net, the new process still provides added value to large scale production facilities, and subsequent energy supply streams, as the benefits of larger
1 Each chapter represents a copy of a peer-reviewed article already published in a journal or a set of conference proceedings. Copyright approval has been obtained from each periodical. Citations are provided in each section of this introduction, and any changes to the articles are restricted to formatting for the purposes of this dissertation.
ethanol yields outweigh both the manufacturing and denatured DDGS costs. However, with the expectation that the DDGS would have been enhanced, the returns on investment are not as lucrative as expected.
There is one additional learning from this research to which economists working with engineers and physical scientists would be well served to heed: There are few representative molecules. As economists, we often assume a representative agent, and can often do so while generating very robust and rich results with our models. The physical sciences are much less forgiving of such generalizations. As we see in this paper, measuring the overall concentration of a general classification of molecules (proteins and amino acids) yields different results than examining each molecule’s nutritional contribution separately.
Subsequent to publishing, the combined engineering and economic model was further modified for research in biofuel production technology assessment (Rakesh Agrawal et al., 2008, Rakesh Agrawal et al., 2009) and policy design (Wallace E. Tyner et al., 2010a, Wallace E. Tyner et al., 2010b). With regards to the latter, a stochastic component was added to the model in order to assess a variable biofuel subsidy design in comparison to the existing fixed subsidies in the market. It was determined that a
properly designed variable subsidy could enhance production value and decrease firm risk while simultaneously lowering the cost of the subsidy to tax-payers.
1.2 The Social Planner vs. Profit Maximizing Firms
The second paper implements a cost minimization model in order to determine the optimal locations for ethanol production facilities from cellulosic sources in Indiana (David F. Perkis et al., 2008). The sources considered are corn stover, a secondary residue from corn crops, and switchgrass, a primary crop requiring dedicated land. Costs which are minimized include those covering the production and shipping of biofuel crops up to the door of the conversion plant.
Two very strong assumptions are adopted for the model. First, production facilities are assumed to be capable of receiving either type of biomass. This would require all facilities to have equipment which converts each type of biomass into a form that can be chemically processed and fermented, and for the cost differential between conversion processes to be negligible. Second, costs are minimized over the network of plants consistent with a social planner’s framework. This requires decisions regarding the location of manufacturing sites to be made simultaneously for all facilities in the network.
Perkis et al. (2008) conclude the following regarding the optimal location of manufacturing sites: (1) The probability of having a county with a site is somewhat higher in the top half of the state where the highest yields of corn are produced, (2) Plants in the northwestern section of Indiana use the highest percentage of corn stover and obtain raw materials at the lowest cost, and (3) Plants operating in the southwestern section of Indiana use the largest percentage of switchgrass and operate at the highest cost. These conclusions were consistent over various plant sizes and corn stover removal rate assumptions.
These conclusions are also consistent with what one observes within the industry today. As some of the first cellulosic biorefineries begin production this year, they tend to locate within corn-rich regions, utilizing corn stover pulled from nearby farmland (Tom Doran, 2014). However, industrial practices are not entirely consistent with one of the paper’s key assumptions, namely that most sites would process multiple sources of cellulosic material. As manufacturing operations that utilize corn stover come online, they tend to focus solely on this one raw material as their source of biofuel production.
Subsequent to publishing, the model was altered to more closely reflect the assumptions of profit maximization (Appendix A). Instead of minimizing costs over the entire network of locations simultaneously, sites would minimize costs on a rolling basis. For instance, the first site would minimize costs with access to the entire resource base of cellulosic materials. The second site would minimize costs without the raw materials utilized by the first site, and so on. When changing assumptions from that of a social planner to profit-maximizing firms, most sites utilize only one type of cellulosic material,
with those first to market focusing on corn stover and those last to market focusing on switchgrass. The main conclusions regarding plant location and cost ordering remain the same.
While the assumption of the social planner did not impact the main results of this paper, it certainly did impact the mixture of cellulosic materials being used by each site. For studies where the proportions of biofuel sources are important, the social planner assumption would lead to erroneous results. Therefore, in subsequent studies conducted by colleagues who wished to use this model, the assumption of profit maximization was adopted (Justin L. Quear, 2008).
1.3 Mathematical Predictions and Human Behavior
The third paper utilizes experimental economic methods to examine the effectiveness of price controls utilized in markets which sell permits allowing firms to emit greenhouse gases and other pollutants (David F. Perkis et al., 2014). Two types of policies are compared in this analysis. The first type, referred to as a hard ceiling, places a legal maximum on permit prices. The second type, referred to as a soft ceiling, releases an additional reserve of permits into the market near the end of the regulated time period. A hard ceiling provides absolute price control while the soft ceiling does not.
To further complicate issues, the mathematics of the soft ceiling requires firm managers to use some foresight while trading by predicting market conditions and optimal behavior when reserve permits are eventually released. If firm managers are skillful in adopting foresight, their behavior should converge towards the theoretical predictions of the soft ceiling model. The set of experiments presented were designed to determine whether subjects trading in experimental markets regulated by a soft ceiling would converge towards the price limit predictions of the model. If they do not, then such policies should likely be redesigned and/or reconsidered before being passed into law.
The paper demonstrates that under certain conditions, the soft ceiling design does not control prices as intended. In some cases, prices are higher than the desired
maximum even after subjects have been exposed to the same experimental market structure over 12 repeated periods. One of the most likely culprits is the grandfathering of permits which provides sellers with appreciable negotiating power. This is
demonstrated by large shifts in welfare from buyers to sellers in comparison to theoretical predictions.
Regardless of the reason for the model’s divergence from theory, this research highlights another issue prevalent within economics: some theories and policies that are mathematically sound may not hold when subjected to the reality of human behavior.
In the natural sciences, experiments are easier to conduct. Engineers and
scientists are able to run controlled experiments with physical materials, keeping certain factors constant and varying others. Economists have a more difficult task, as conducting experiments requires working with human subjects as well as anticipating the factors over which the economist has no control. Fortunately, with the growing number of
experimental labs within economics departments, more and more researchers are able to test their ideas on a small scale (akin to an engineer’s pilot plant) before they are
implemented as policy. In doing so, economists can modify their mathematical models to account for human behavior and improve policy design before it is implemented on a larger scale and passed into law.
1.4 References
Agrawal, Rakesh; Navneet R. Singh; Fabio H. Ribeiro; W. Nicholas Delgass; David F. Perkis and Wallace E. Tyner. 2009. "Synergy in the Hybrid Thermochemical-Biological Processes for Liquid Fuel Production." Computers & Chemical Engineering, 33(12), 2012-17.
Agrawal, Rakesh; Navneet R. Singh; Fabio H. Ribeiro; W. Nicholas Delgass; David F. Perkis and Wallace E. Tyner. 2008. "Environmentally Friendly Energy Solutions,"
Doran, Tom. 2014. "Corn Stover-to-Ethanol Plant Nears Reality," AgriNews. LaSalle, IL: AgriNews Publications.
Krugman, Paul. 2009. "How Did Economists Get It So Wrong?," The New York Times.
New York, NY: The New York Times Company.
Perkis, David F.; Timothy N. Cason and Wallace E. Tyner. 2014. "An Experimental Investigation of Hard and Soft Price Ceilings in Emissions Permit Markets."
Environmental and Resource Economics, doi:10.1007/s10640-014-9810-z
Perkis, David F.; Wallace E. Tyner; Paul Preckel and Sarah Brechbill. 2008. "Spatial Optimization and Economies of Scale for Cellulose to Ethanol Facilities in Indiana,"
Transition to a Bioeconomy: Risk, Infrastructure and Industry Evolution. Farm
Foundation conference. Berkeley, CA.
Perkis, David; Wallace E. Tyner and Rhys. Dale. 2008. "Economic Analysis of a Modified Dry Grind Ethanol Process with Recycle of Pretreated and Enzymatically Hydrolyzed Distillers’ Grains." Bioresource Technology, 99(12), 5243-49.
Popper, Karl. 1992. Realism and the Aim of Science. Routledge.
Quear, Justin L. 2008. "The Impacts of Biofuel Expansion on Transportation in Indiana,"
Agricultural Economics. West Lafayette, IN: Purdue University.
Tyner, Wallace E.; Sarah Brechbill and David Perkis. 2010a. "Cellulosic Ethanol:
Feedstocks, Conversion Technologies, Economics, and Policy Options," R. Schnepf, CRS
Report for Congress. Washington, DC: Congressional Research Service.
Tyner, Wallace E.; Farzad Taheripour and David Perkis. 2010b. "Comparison of Fixed Versus Variable Biofuels Incentives." Energy Policy, 38(10), 5530-40.
CHAPTER 2. ECONOMIC ANALYSIS OF A MODIFIED DRY GRIND ETHANOL PROCESS WITH RECYCLE OF PRETREATED AND ENZYMATICALLY
HYDROLYZED DISTILLERS’ GRAINS
2.1 Abstract
A modification of the conventional dry grind process for producing ethanol from yellow dent corn is considered with respect to its economic value. Process modifications include recycling distiller’s grains, after being pretreated and hydrolyzed, with the ground corn and water to go through fermentation again and increase ethanol yields from the corn starch. A dry grind financial model, which has been validated against other financial models in the industry, is utilized to determine the financial impact of the process changes. The hypothesis was that the enhanced process would yield higher revenues through additional ethanol sales, and higher valued dried distiller’s grains (DDGS), due to its higher protein content, to mitigate the drop in DDGS yields. However, there may be no value added to the enhanced dried distiller’s grains (eDDGS), even in light of its higher protein levels, as current pricing is expected to be more sensitive to the amino acid profile than the total protein level, and the eDDGS has lower lysine levels, a key amino acid. Thus, there is a decrease in revenue from eDDGS due to the combination of no price change and loss of DDGS yield to ethanol. A 32% increase in net present value (NPV) for the overall operation is expected when applying the process modifications to a 100 million gallon ethanol plant. The financial improvements are a result of the increased revenue from higher ethanol yields outpacing the sum of all added costs, which include higher capital costs, larger loan payments, increased operating costs, and decreased revenues from dried distiller’s grains.
2.2 Introduction
The dry grind process converts the entire corn kernel into two main products of economic value, ethanol and dried distiller’s grains (DDGS). While ethanol has typically been known as a key component in alcoholic beverages, its rapidly growing use as an automotive fuel, through subsidies and high oil prices, makes it a product of high value. The DDGS co-product is sold as animal feed for swine, cattle, and chickens due to its protein, amino acid, and energy content. However, DDGS also contains some
unconverted starch and sugar precursors to ethanol, which, if processed, could increase the ethanol yield of a dry grind facility. Increasing ethanol yields would increase the revenue from ethanol of the dry grind process, and could also enhance the value of the DDGS by creating a product with higher concentrations of protein for animal feed.
A process has been proposed which takes the distiller’s grains from the
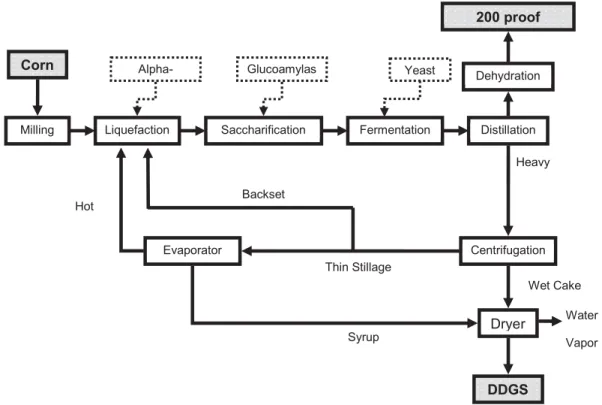
conventional dry grind process and recycles them for further processing and fermentation, resulting in higher yields of ethanol and an enhanced dried distiller’s grains (eDDGS) product with increased protein levels (Kim et al., 2007). The conventional process (Figure 2.1), or “base” process, grinds the corn and breaks it down into simple sugars to be fermented into ethanol. The ethanol is then separated by distillation off the top of a column, while the bottom products are further processed to separate water from the distiller’s grains. The proposed modifications (Figure 2.2) would subject the material from the bottom of the distillation column to further processing, including a pretreatment heating step and subsequent hydrolysis of polymeric sugars and residual starches by enzymes, and then separate the sugar-rich “pretreated” liquid to be recycled back through the original hydrolysis and fermentation processes in order to increase ethanol yields. The remaining distiller’s grains not recycled with the pretreated liquid would be dried and sold as eDDGS, an animal feed with higher protein levels than conventional DDGS.
A dry milling model, called the DM model based on dry milling of corn (Dale and Tyner, 2006a), was developed using MS Excel (Microsoft Corporation, 2003) to monitor the financial feasibility of the conventional dry grind process given market trends for the costs of corn, the price of ethanol, and other product and input prices. Validation of this model included comparisons of capital costs and variable costs against industrial
estimates from the Ethanol Production Handbook (BBI Int., 2003) and a 2002 Cost of Production Survey (Shapouri and Gallagher, 2005) respectively. In the 100 million
gallon nameplate range, the DM model calculated capital and variable costs valued at 97% and 103% of their respective industrial estimates (Dale and Tyner, 2006a). Calculations performed at other nameplate ranges were similarly close. Thus, there is confidence that the DM model can be utilized to determine the financial feasibility of the conventional dry grind process, and can be augmented with a technology module and adjusted pricing to analyze the financial costs and benefits of the dry grind process with pretreated liquid.
Figure 2.1 Schematic Flow Diagram of Current Dry Grind Ethanol Process. Water Utilization for Cooling of Heat Exchangers Is Not Shown (Kim).
Wet Cake Centrifugation Corn
Milling Liquefaction Saccharification Distillation Dehydration 200 proof
Fermentation
Alpha- Glucoamylas Yeast
Heavy Evaporator Dryer Syrup DDGS Backset Hot Thin Stillage Water Vapor
Figure 2.2 Schematic Flow Diagram of Alternative Dry Grind Process with Recycle of Distiller’s Grains (Wet Cake) to Liquefaction (Kim).
2.3 Methodology
The DM model is based on the process in Figure 2.1, which takes yellow dent corn, hydrates the ground corn particles, breaks down the starch into simple sugars using
Centrifugation) Corn
Milling Liquefaction Saccharification Distillation Dehydration
200 proof Ethanol
Fermentation Alpha-amylase Glucoamylase Yeast
Heavy Stillage Evaporator Pretreatment Wet Cake Syrup Wet e Cake Backset Ev Hot Thin Stillage Saccharification Centrifugation Dryer eDDGS Liquid Water Vapor Amylases/Cellulases/ Solid
enzymes, and then ferments the simple sugars into ethanol. The ethanol is then separated from the remaining distiller’s grains, which are also processed in order to sell to the animal feed market. The DM model takes specific flow rates (ethanol output, water recycle), conversion rates (hydrolysis and fermentation yields), and product and input characteristics (grain, ethanol, DDGS) to determine all other flows in the process (Dale and Tyner, 2006b). Especially important are the product and process stream moistures, as these determine how water is managed in the process, both in terms of drying capacity and recycle use. With this information, all product flow rates and densities can be estimated, allowing for equipment sizing, motor loads, and temperature and thermal energy requirements.
Market prices for variable costs (grain, chemicals, energy, and utilities) and revenues (ethanol, DDGS, CO2) are incorporated into the model to determine yearly operating costs and benefits in real terms. The equipment sizing and specifications allow for pricing of individual units to be determined. Equipment prices are scaled to the current year by the Marshall Swift Index (chemical engineering, 2007). For large nameplates such as this, the DM model uses the Fixed Capital Investment (FCI) method to determine the Total Capital Costs (TCC) based on equipment costs (Dale and Tyner, 2006a). Working capital based on initial real operating expenses is added in, and the resulting Total Capital Investment (TCI) is obtained. Part of this investment, as well as any capitalized interest, is assumed to be financed through loans. Finally, interest and discount rates are utilized to determine both nominal and real loan payments and perform the final benefit-cost analysis to determine the financial measures of interest such as net present value (NPV) and the internal rate of return (IRR).
2.3.1 The Base Process
The material balance for the conventional dry grind process (Kim, 2007) was normalized by setting the ethanol output volume equal to the hourly flow rates assumed
in the DM Model, and subsequently adjusting the starch and sugar conversion yields in order to match the corn input rates of the material balance. Additionally, adjustments to process flow moisture levels and backset recycle rates were made in the DM model to match the material balance as closely as possible.
Once all the material and energy flows were determined based on this normalization, prices were updated to represent current market values (Table 2.2). Commodity prices were updated based on market pricing in the last week of May 2007. Specialty chemical prices which typically show less volatility were updated using information from industry obtained during the first half of 2007. As previously stated, capital costs for equipment are automatically updated in the DM model with the Marshall & Swift Equipment Cost Index, a commonly used engineering equipment inflation index. In some cases, information from industry differed in that some equipment costs had increased more dramatically than estimated by the Marshall & Swift Index, likely driven by the increased demands on equipment by the ethanol industry. In such situations, the equipment cost was inflated to more accurately represent prevailing market prices. The DDGS price was also updated based on regional market prices, as opposed to being estimated based on its historical relationship to corn or soy bean meal prices.
Once the base process model and all pricing was updated, loan terms were determined and project financials were calculated.
2.3.2 Pretreated Liquid
A technology module containing the parameters of the pretreated liquid process has been added to the base DM model in order to assess the financial impact of building a plant with the pretreatment process. The module, as with the material balance, assumes an equal rate of input corn, adjusting the remainder of the process flows with scaling factors as indicated by the material balance (Kim et al., 2007). For instance, while the pretreated liquid brings in more sugars to the fermentation process, increasing the
requirements of yeast, it is assumed that no additional starches are introduced into the liquefaction step with the pretreated liquid. Thus, the enzymes used in the base process can be maintained at the same levels since they are tied to the starch flow rates coming from the corn. Some rates increase such as the ethanol processing streams since higher yields are obtained than in the base process. Finally, some of the rates decrease such as the DDGS processing streams as more of the fermentable starches and sugars are recycled. For water and thermal energy rates, it was assumed that these would be consumed by the process at the same rate for each gallon of ethanol as the base process. This is believed to be a conservative estimate as more savings would likely be realized in the pretreatment process by recycling water and using effective heat exchange.
Existing equipment has been resized and new items are assumed to have been purchased, including a saccharifaction tank for the enzymatic hydrolysis of the cellulose and residual starch in the combined wet cake/thin stillage, and a centrifuge to separate out the resulting pretreated liquid from the remaining distiller’s grains. Resizing is
performed based on the key operating parameters used for each piece of equipment. This parameter is often as simple as the throughput, although some capital is sized based on other factors, such as residence time or drying loads.
With flows rates and equipment sizing determined, market prices can be applied to the pretreated liquid technology module just as in the base process. Loan terms are then calculated and the financials for the pretreatment module are determined, such as annual net benefits, NPV, and IRR.
2.3.3 Price Expectations for eDDGS and enzymes
While most market prices apply to both the base and pretreated liquid processes, there are two additional components in the new process without a market price, the added enzyme mixture and eDDGS. Prices for the new enzyme mixture are estimated by the
supplier (Genencor International, Inc.) and are based on the additional ethanol yields (in gallons) obtained in the new process.
It was expected that the higher protein levels in eDDGS would bring higher prices, without having to pay a premium for the enzyme requirements of the pretreated liquid stream. The eDDGS price is estimated based on the change in value compared to DDGS as determined by a swine feed ration pricing model. The compositional analyses of DDGS and eDDGS (Table 2.1) required for the pricing model were performed by the Experiment Station Chemical Laboratories, University of Missouri-Columbia, following methods outlined in a previous paper in this series (Kim et al., 2007).
Table 2.1 Total Swine Feed Nutrition Limits in Feed Cost Model for Swine Feed Containing 15% DDGS or eDDGS.
MINIMUM MAXIMUM
Crude Protein 0.160
App. Dig. Methionine+Cystine 0.502
App. Dig. Threonine 0.518
App. Dig. Tryptophan 0.144
Calcium 0.720 0.820
Available Phosphorous 0.240
Crude Fat 8.00
App. Dig. Lysine 0.850
Isoleucine 0.468
Valine 0.570
Vitamin Premix 0.150 0.150
A swine feed pricing model was chosen due to the strong dependence of swine health on the amino acid and nutrient profile of swine feed (National Research Council, 1998). It is desirable that eDDGS would increase in value in all markets where it is purchased, whether for cattle, swine, or any other animal which currently consumes DDGS. Since initial analytical results showed a substantial increase in protein for the
eDDGS, it was expected that this protein would yield higher value for eDDGS. As swine do have a more particular diet based on specific amino acid levels (Thaler, 2002), it is believed that value determinations based on the added constraints of a swine diet will represent a true lower limit for eDDGS pricing in the market.
For the swine feed model, DDGS or eDDGS was assumed to be mixed into the animal feed at a 15% level for grower swine. Because previous studies have shown that dried distiller’s grains with fat content similar to that of standard DDGS can cause reduced belly firmness and more soft fat when added at levels above 20% of a grower swine’s diet, current recommendations entail starting the swine at 10% DDGS and increasing the feed diet up to a maximum of 20% (Thaler, 2002). The midpoint of 15% was therefore chosen for this analysis. However, several percentages were tested in the model between 10% and 20% in an attempt to confirm the robustness of pricing estimates.
The swine feed model sets limits on amino acids (see Table 2.1), as well as total protein and other minerals (National Research Council, 1998 and Hill et al., 1998). Prices and nutrient levels are included for all other feed ingredients. The total feed cost is minimized by adjusting corn, soy bean meal, vitamins, and amino acid supplements to obtain the desired nutrient requirements at the lowest price possible, and a shadow value is calculated for the DDGS. In this analysis, shadow values for DDGS and eDDGS were obtained, and the ratio of the two shadow values was applied to the DDGS market price in order to estimate an expected market price for eDDGS.
2.4 Results
Based on a dry grind nameplate level of 100 million gallons of ethanol, a corn price of $3.82 per bushel, and a denatured ethanol price of $2.23 per gallon (Table 2.2), the DM model predicts an NPV of $162 million (Table 2.3) over the 25 year life of the project, with operations beginning in year 3. This includes a $33.5 million yearly net operating benefit (Table 2.4), not including initial annual loan payments of $11 million
(Table 2.3). The loan pays off 60% of the total capital investment of $148 million plus any capitalized interest. The total capital investment per gallon of ethanol is $1.48. While this number may seem somewhat low, some of the large capital investment values found in industry may be due to a bubble from the growing ethanol demand. It is likely that TCI values will soon return to lower levels more in line with our model. More annual cost and revenue data can be found in Table 2.4.
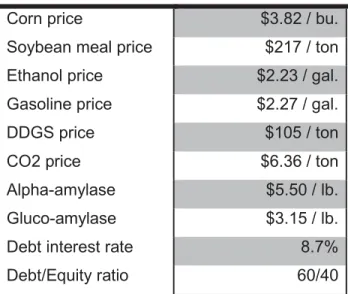
Table 2.2 Key Prices and Economic Assumptions
(Price Data Taken from Chicago Board of Trade, Ethanol Producers Magazine, Bloomberg.com, and other Industrial Contacts)
Value
Corn price $3.82 / bu.
Soybean meal price $217 / ton
Ethanol price $2.23 / gal.
Gasoline price $2.27 / gal.
DDGS price $105 / ton
CO2 price $6.36 / ton
Alpha-amylase $5.50 / lb.
Gluco-amylase $3.15 / lb.
Debt interest rate 8.7%
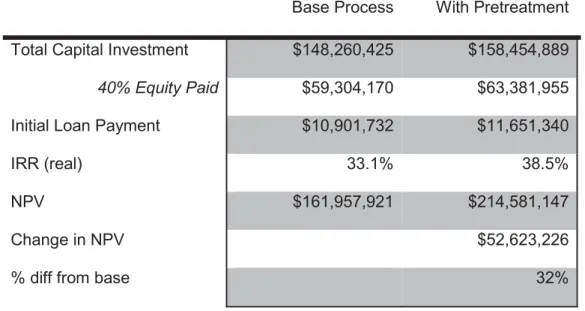
Table 2.3 Capital and Financial Analysis of the Base and Alternative Processes. All Values in Real Dollars
Base Process With Pretreatment
Total Capital Investment $148,260,425 $158,454,889
40% Equity Paid $59,304,170 $63,381,955
Initial Loan Payment $10,901,732 $11,651,340
IRR (real) 33.1% 38.5%
NPV $161,957,921 $214,581,147
Change in NPV $52,623,226
Table 2.4 Annual Revenue and Operating Cost Details of the Base and Alternative Processes
Revenues Base Process With Pretreatment
Ethanol $223,000,000 $251,254,754
DDGS or eDDGS $37,694,685 $28,735,669
CO2 $2,004,506 $2,271,200
Total Revenue $262,699,191 $282,261,623
Costs Base Process With Pretreatment
Materials $166,843,443 $171,035,283 Grain $136,176,590 $136,176,590 Enzymes $13,532,318 $16,066,376 yeast $1,018,105 $1,056,774 SO2 $4,766,430 $4,947,464 denaturant $11,350,000 $12,788,078
Energy and Water $33,707,243 $39,552,795
Thermal $25,576,643 $29,602,759 Electrical $7,673,417 $9,434,927 H2O $457,184 $515,110 Indirect $27,917,734 $30,813,358 Labor $6,553,650 $7,017,489 Taxes $8,234,656 $9,698,408 Liscence Fees $5,253,984 $5,645,232 Maintenance $5,253,984 $5,645,232 Misc. $2,621,460 $2,806,996
Total Operating Costs $229,165,569 $241,401,436 Net Benefits Base Process With Pretreatment
2.4.1 Pretreatment Module: Pricing Adjustments
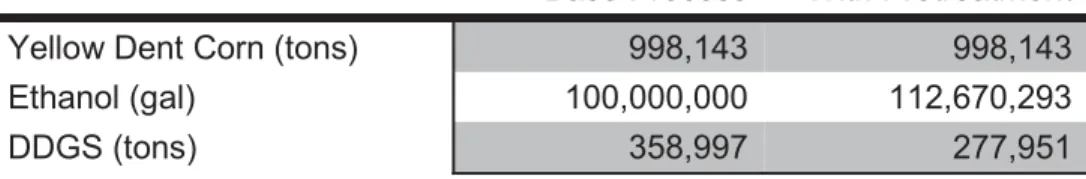
The new enzyme mix cost is estimated to add $0.20 per additional gallon of ethanol above 100 million gallons. With 12.7 million gallons of additional ethanol being produced by the pretreatment process (Table 2.5), there are roughly $2.5 million in additional enzyme costs.
Table 2.5 Input and Output Rate Changes of Major Ingredients between the Alternative Process and the Base Process
Base Process With Pretreatment
Yellow Dent Corn (tons) 998,143 998,143
Ethanol (gal) 100,000,000 112,670,293
DDGS (tons) 358,997 277,951
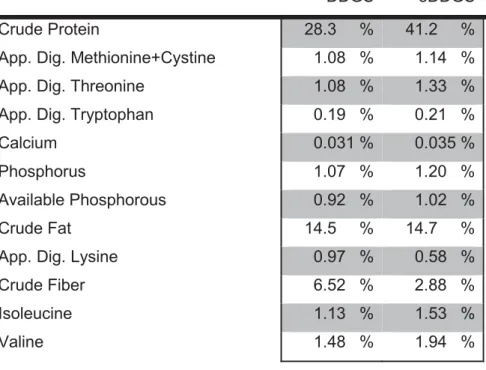
eDDGS drops in value roughly 1.5% compared to the base DDGS currently in the market as determined by the swine feed model. This drop is due to the loss of lysine in the eDDGS samples. Our base DDGS has 0.87% digestible lysine while the eDDGS has 0.54% (Table 2.6). Lysine is a key ingredient in swine feed (Thaler, 2002), and such a drop forces the model to supplement the feed with higher cost, lysine rich components and supplements, resulting in a very slight drop in value of the eDDGS. If the lysine to protein ratio were to stay the same, we would predict an eDDGS lysine level of 1.27% and an increase in eDDGS value of 6.7% vs. the base DDGS.
2.4.2 Pretreatment Module: Process Flows, Capital, and Operating Costs and Revenue
The ethanol yield increases with the pretreatment module by 12.7% (Table 2.5). This has a substantial impact on plant revenue, increasing revenue by over $28 million
annually due to ethanol yields alone. A couple of other notable changes are driven by this yield increase. All ethanol processing equipment is more expensive due to the increased throughputs, and the utilities are more expensive as well, as energy and water increase in cost from $33.7 million to $39.6 million (Table 2.4).
Table 2.6 DDGS and eDDGS Nutrient Analysis
DDGS eDDGS
Crude Protein 28.3 % 41.2 %
App. Dig. Methionine+Cystine 1.08 % 1.14 %
App. Dig. Threonine 1.08 % 1.33 %
App. Dig. Tryptophan 0.19 % 0.21 %
Calcium 0.031 % 0.035 %
Phosphorus 1.07 % 1.20 %
Available Phosphorous 0.92 % 1.02 %
Crude Fat 14.5 % 14.7 %
App. Dig. Lysine 0.97 % 0.58 %
Crude Fiber 6.52 % 2.88 %
Isoleucine 1.13 % 1.53 %
Valine 1.48 % 1.94 %
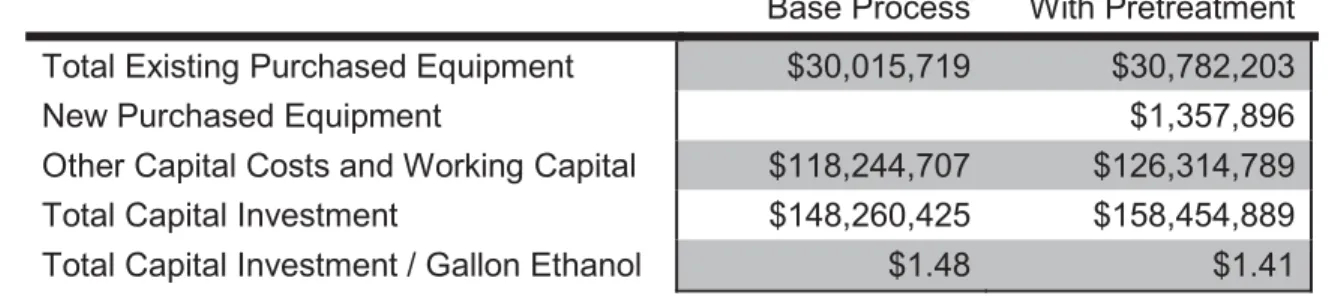
While the ethanol yields drive up the throughput and prices of certain pieces of equipment, other capital expenditures are unaffected, or even decrease, due to the new process flows. For instance, the hammer mill cost would be identical due to the constant corn input rates (Table 2.5). Similarly, the costs of liquefaction and saccharification tanks would increase minimally as the pretreated liquid stream does not increase
throughput in these two tanks substantially. In the case of eDDGS drying and processing, the lower yields actually lessen the capacity requirements of the drum dryers, resulting in a decrease in capital costs through this part of the process. The net result is that the pretreatment process module increases the equipment costs for existing equipment by just over $750 thousand, with another $1.4 million needed for the new equipment in the
process (Table 2.7). These two increases lead to a total capital investment (TCI) of $158.5 million, or a 6.9% increase in TCI compared to the base process. With the ethanol yield increasing by 12.7%, an efficiency in TCI per gallon of ethanol is realized as this value decreases from $1.48 in the base process to $1.41 in the pretreated liquid process.
Table 2.7 Capital Costs for the Base Process and Alternative Process
Base Process With Pretreatment
Total Existing Purchased Equipment $30,015,719 $30,782,203
New Purchased Equipment $1,357,896
Other Capital Costs and Working Capital $118,244,707 $126,314,789
Total Capital Investment $148,260,425 $158,454,889
Total Capital Investment / Gallon Ethanol $1.48 $1.41
Finally, the decrease in eDDGS yields, with no appreciation in its value, results in a revenue loss of nearly $9 million annually (Table 2.4), diminishing some of the revenue gains from the ethanol.
2.4.3 Pretreatment Module: Financials
The loan payments increase for the pretreated liquid process, due both to increases in capital requirements, as well as increases in working capital (based on operating costs tied to higher values for capital and ethanol revenue). However, with the lower capital cost per gallon of ethanol, and the large increase in ethanol revenue, it is not surprising that the NPV for an operation which includes the pretreatment and enzymatic hydrolysis technology is $214.6 million, or a $52.6 million increase compared to the base process (Table 2.3). The IRR also increases to 38.5%, compared to 33.1% for the base process.
2.4.4 Sensitivity to eDDGS Pricing
If any variability exists with respect to lysine losses in the distiller’s grains due to the pretreatment technology, it would be useful to understand the impact on the plant financials. Assuming no loss of lysine in the protein, and an eDDGS lysine level of 1.27%, the adjusted value of eDDGS (a 6.7% increase instead of a 1.5% decrease) yields an NPV of $230.7 million, or $16 million higher than the estimate with the lower eDDGS value.
2.4.5 Sensitivity to Enzyme Mix Pricing
The enzyme mixture which hydrolyzes the pretreated distiller’s grains by far represents the most significant raw material cost increase, and brings an additional $2.5 million in material costs to the operation. Without this added cost, the net operation benefits of implementing the pretreatment and hydrolysis of distiller’s grains is $9.9 million. Thus, added enzyme costs cut into this net benefit by 26%. Looking at the sensitivity of pricing for the enzyme mixture, a decrease in the new enzyme mixture cost by 20% would yield a net yearly benefit of $7.8 million and an NPV of $218.2 million compared to $7.3 million and $214.6 million respectively for the assumed pricing. However, if the enzyme mixture cost ended up being higher by 20%, the net yearly benefit and NPV would drop to $6.9 million and $211.0 million respectively.
2.5 Summary and Conclusions
Based on the conservative practice of utilizing swine feed models to determine the value of dried distiller’s grains, the eDDGS product does not show an increase in value as anticipated compared to the base DDGS due to the loss of lysine through the pretreatment
and enzymatic hydrolysis processes, lysine being a particularly important amino acid in the swine diet. While using a swine diet might seem restrictive as other animals may benefit more from the high protein content in eDDGS, it is not known whether such a product differentiation is possible in the DDGS market, being able to sell the product for one type of animal feed at a premium while eliminating other markets. Thus, the
restrictions of a swine diet may be appropriate. If this is the case, then finding ways of retaining lysine could prove important. While the value of eDDGS did not decrease substantially compared to the base, further losses of lysine could drop the value enough that overall feed costs become prohibitive to the farmer, and eDDGS loses more of its worth to the swine population.
Nevertheless, even with the eDDGS value not appreciating, the pretreatment technology does add value to a conventional dry grind operation at current corn and ethanol prices. The large yield increases in ethanol, combined with its value over that yield, increases revenues substantially, more than making up for added capital costs, higher operating costs, and revenue losses from decreased DDGS yields. Thus, at current ethanol prices, the economics of the pretreatment technology are encouraging, and
finding a way to maintain lysine levels in the dried distiller’s grains would likely make the technology even more economically attractive. Furthermore, any reductions in pricing of the enzyme mixture are shown to add to the economic gains of the
pretreatment and hydrolysis process. It is also known that lower ethanol prices would reduce the gains of hydrolyzed distiller’s grains substantially. For instance, given the assumptions used in this analysis, the breakeven ethanol price for the pretreatment
process is roughly $1.95 per gallon compared to $1.99 per gallon for the conventional dry grind process. Any changes which either increase the value of the eDDGS or decrease the cost of the enzyme mixture would help to lower this breakeven price even more, thus making ethanol production by the dry grind process feasible over a larger range of ethanol prices.
2.6 Acknowledgments
This work was supported by US Department of Energy (Contract: DE-FG36-04GO14220) in cooperation with Midwest Consortium for Biobased Products and Bioenergy. Acknowledgements are due to Mike Ladisch, Youngmi Kim, Nate Mosier, Paul Preckel, Brian Rickert, and Todd Hubbs for their assistance with parts of the analysis.
2.7 References
BBI International, 2003. The Ethanol Plant Development Handbook: Fourth Edition. BBI International Publishing, Grand Forks, ND.
Bloomberg.com, 2007. Bloomberg Energy Prices. Available from: <http://www.bloomberg.com/markets/commodities/energyprices.html>. Accessed May 2007
Chemical Engineering, 2007. Economic Indicators: Marshall and Swift Equipment Cost Index. Chemical Engineering. January, 68.
Chicago Board of Trade, 2007. Agricultural Products. Available from:
<http://www.cbot.com/cbot/pub/page/0,3181,963,00.html> Accessed May, 2007. Dale, R.T.; Tyner, W.E., 2006a. Economic and Technical Analysis of Ethanol Dry Milling: Model Description, Staff Paper # 06-04, Purdue University. Dale, R.T.; Tyner, W.E., 2006b. Economic and Technical Analysis of Ethanol Dry Milling: Model User’s Manual. Staff Paper # 06-05, Purdue University. Ethanol Producer Magazine, 2007. Commodities. Available from:
<http://www.ethanolproducer.com/commodities.jsp> Accessed May, 2007. Hill, G.; Rozeboom, D.; Trottier, N; Mahan, D.; Adeoli, L; Cline, T.; Forsyth, D.; Richert, B., 1998. Tri-State Swine Nutrition Guide. Bulletin 869-98, The Ohio State University
Hosein, S.; Gallagher, P., 2005. USDA’s 2002 Ethanol Cost-of-Production Survey. Agricultural Economic Report Number 841. United States Department of Agriculture.
Kim, Y.; Mosier, N.; Ladisch, M.R., 2007. Simulation of Modified Dry Grind Ethanol Processes with Recycle of Pretreated and Enzymatically Hydrolyzed Distiller’s Grains. Bioresource Technol. Xx, xxx-xxx
Microsoft Corporation, 2003. Microsoft Excel 2003, SP2, Redmond, WA.
National Research Council, 1998. Nutrient Requirements of Swine: Tenth Revised Edition. National Academy Press, Washington D.C.
Thaler, B., 2002. Use of Distillers Dried Grains with Solubles (DDGS) in Swine Diets. Extension Extra 2035, Cooperative Extension Service, South Dakota State University.
CHAPTER 3. SPATIAL OPTIMIZATION AND ECONOMIES OF SCALE FOR CELLULOSIC TO ETHANOL FACILITIES IN INDIANA
3.1 Abstract
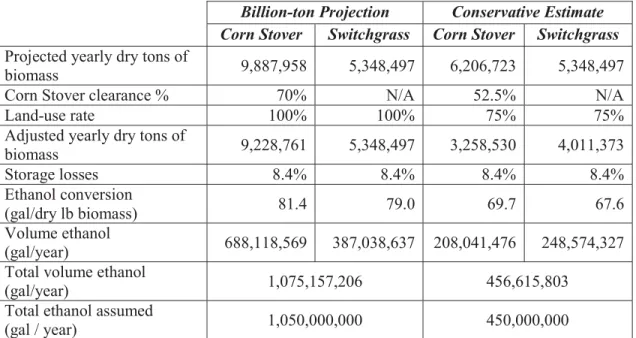
Based on cellulosic biomass yield projections of a recent national study, the optimal spatial distribution and size of cellulose to ethanol conversion facilities is determined for cellulose sources in Indiana to be converted to ethanol through a
biochemical conversion process. Such sources include corn stover and switchgrass. A cost minimization approach is implemented that optimizes over the raw material and transportation costs of the process, with economies of scale included for large facilities. Due to the abundance of corn stover and its current low cost as a byproduct of corn production, a high concentration of facilities in the northwest section of Indiana is ideal. Such plants would utilize high levels of corn stover and operate at relatively lower cost than other facilities in the state. Other regions of the state would have fewer facilities, several specializing in switchgrass and operating at a higher cost. Economies of scale similar to those found in corn to ethanol facilities are likely to support large sized plants given current yield projections. However, if more conservative biomass yield projections are expected due to lower collection or land utilization rates, the economies of scale needed to support large plant sizes nearly doubles, increasing the likelihood of an optimal strategy in which smaller facilities are more broadly distributed around the state.
3.2 Introduction
Ethanol output has grown significantly in recent years, both in Indiana and across the United States. With the desire to promote cleaner, renewable fuels, both the federal and state governments have instituted subsidies intended to increase output. In December 2007 Congress passed and the President signed the “Energy Independence and Security Act of 2007” which contains a renewable fuel standard (RFS) requiring 35 billion gallons of ethanol by 2022, of which at least 16 billion must come from cellulosic sources (U.S. Congress, 2007). Additionally, recent increases in gasoline prices compared to the historically low prices experienced in the United States likely will continue to put upward pressure on the demand for substitutes. As less expensive production technologies in ethanol manufacturing come online, ethanol substitution levels in fuel mixtures may continue to increase.
While there is much excitement about this ethanol boom and the potential for profit, there are also undesirable outcomes for participants in closely related markets. Specifically, with corn being the primary input for the ethanol production process, livestock producers dependent on corn as a feed ingredient have been negatively
impacted by rising corn prices. Such factors also impact food markets as higher costs for feed are passed on to consumers of chicken, eggs, dairy, beef, and pork through higher prices. Thus, while ethanol shows great potential as a cleaner fuel that could decrease U.S. dependence on foreign oil, there are concerns about how increased ethanol output levels and the induced demand for corn will impact the affordability of certain dietary staples.
Given the potential for adverse price effects in food markets, there is a desire to develop alternative sources of the raw materials needed for ethanol production. Materials rich in cellulose show great potential as ethanol feedstocks. Not only can they be
converted to the necessary precursors for ethanol production, but many cellulose sources are natural by-products of other farming and manufacturing processes. Corn stover and wood trimmings are two common examples of by-products of corn farming and logging respectively (Perlack et al., 2005). Furthermore, some high energy sources of cellulose that would be grown as primary crops can be grown on terrains hostile to corn and other
crops, thus in some cases being produced on currently uncultivated lands without having to displace food production.
Recently, the “Billion-ton” study investigated the potential for U.S. grown
biomass sources to provide enough ethanol to replace 30% of domestic fuel consumption (Perlack et al., 2005). In short, the authors conclude this would be feasible, with
cellulose based sources making up a substantial portion of the over 1.3 billion dry tons of biomass resources projected to be available for conversion to fuels.
The State of Indiana has benefited from the push for ethanol and other biomass based fuels. The large quantity of farmland dedicated to growing corn has made Indiana an attractive site for the construction of conventional corn to ethanol dry grind
manufacturing facilities. With the push for alternative biomass to produce ethanol, it is useful to begin assessing how Indiana can position itself to take advantage of cellulosic materials if the Billion-ton study projections are correct. The Billion-ton study
anticipates that 18.3 million dry tons of cellulose feedstocks would be available in Indiana given proper land utilization. As these sources are developed, and firms begin to construct facilities for conversion to ethanol, there will be many questions affecting the welfare of firms and citizens alike. For instance, where should manufacturing facilities be located and how large should they be? Which locations will best take advantage of the cellulose source materials with respect to minimizing costs? What impact will a
potentially large network of facilities have on our roads and highways? What will be the impact of new manufacturing facilities and some newly cultivated land on the Indiana job market and the environment?
The intent of this paper is to begin to answer some of these questions and to provide a framework for follow-up studies. Specifically, it seeks to determine an optimal spatial distribution of ethanol plants within the state of Indiana given the projections of biomass availability projected by the Billion-ton study and detailed cost information for harvesting, storing, and shipping biomass products (Brechbill and Tyner, 2008).
Additionally, this paper provides guidance regarding the optimal size of ethanol facilities based on economies of scale. One of the key assumptions is that conversion facilities will use all of the cellulose materials grown within Indiana, and only these materials, in
the production of ethanol. This is acknowledged to be a strong assumption, but one which should not dramatically alter the findings of the study. Since crop costs grow with increased shipping distances one would expect that only crops near the borders would be shipped across state lines, and there is no reason to believe that more crops would be shipped in one direction or the other. It is therefore believed that the impact of this assumption on the conclusions should be small.
Projections of optimal plant locations have been made in the past. Notably, Nelson projected plant locations across Indiana for 40 equal output sites (Nelson, 1981). However, Nelson focused on agricultural residues without taking into account cellulose source crops which are specifically grown for conversion to ethanol. Additionally, Nelson made regional assumptions of harvest rates not required here due to the detailed county level data provided by the Billion-ton study. Given expected residue and crop outputs in this data, a specific county level analysis can be performed by combining the yield data with inter-county distances and transportation costs. Additionally, this paper considers some of the larger throughput rates anticipated to benefit from economies of scale based on historical experience from fermentation of corn-based sugars (Dale et al., 2006).
Another series of papers exemplified by English et al. (2000) has a broader scope by investigating the impact of corn stover and other biomass output expectations on the economies of several corn-growing states including Indiana, even including output prices and other factors for sensitivity analyses. However, English et al. focuses on economy wide results at the state level as opposed to county level output decisions, the main focus of this paper’s spatial distribution plan. Additionally, this paper utilizes the most recent county yield estimates (Billion-ton study) and biomass cost information (Brechbill and Tyner, 2008) for Indiana.
This paper will focus on the anticipated 14.6 million dry tons per year of corn stover and switchgrass available to be processed by biochemical conversion (Perlack et al., 2005). This process breaks the cellulose down to simple sugars using enzyme hydrolysis, and then ferments the sugars to produce ethanol. Enzymatic hydrolysis and fermentation are currently used to convert corn to ethanol and would be conducive to the
cellulose sources considered in this study. These sources are corn stover, an agricultural residue from corn production, and switchgrass, a high energy primary crop (US DOE, 2006). In addition to considering the optimal spatial distribution and size of plants given the projections of the Billion-ton study, an additional scenario will be tested making more conservative assumptions with respect to collection rates of corn stover, as well as land utilization and biomass conversion rates for both corn stover and switchgrass.This is the second page of your chapter.
3.3 Methodology
Focusing on biochemical conversion facilities, it is assumed producers can utilize one of two plant sizes, a large plant (100 million gallons/year) or a small plant (50 million gallons/year), in order to convert Indiana’s projected corn stover and switchgrass into ethanol. It is also assumed that this conversion process will be robust enough to handle either of the two feedstocks in varying proportions within one plant. While this might assume an optimistic level of manufacturing robustness, the key components of each material which are hydrolyzed are similar. It seems feasible that enzyme mixtures, as well as technological modifications of the crops themselves, could be developed to provide such robustness. Finally, the following simplifying assumptions are made: (1) each county will have at most one manufacturing facility, (2) the construction and operating costs are identical for each plant except for the biomass raw material costs and an economy of scale factor which will be represented by an added per gallon cost for the smaller plant, and (3) cost differences exist only in the growing (switchgrass), harvesting, and transportation costs of the biomass raw material mixture which is input into the process.
The objective for firms is to maximize their profit, which is revenue less costs. Since plants of modest size are assumed, individual plants should not have an impact on the price of ethanol and unit revenues are thus assumed to be identical for each site
regardless of its location. Thus, to maximize profits, firms must focus on minimizing their costs. Since construction and operating costs are assumed to be identical for each site, optimization focuses on the production, harvesting and transportation costs of biomass. Specifically, how do the relative costs for each crop impact the choice of the input mix in order to minimize costs.
This model will assume that costs are minimized over all sites, even though each site may be owned by a different enterprise. While this appears to be more of a central planning solution than one of competitive firms maximizing profits, the general results should be similar, with plants locating based on the comparative advantages relative to surrounding counties (Nelson, 1981). In reality plants will likely contract for cellulose raw materials before the plant is even constructed. The early plants will locate in least cost areas and will contract for available raw material in those areas. Since the purpose of this exercise is to determine the use of all biochemically converted cellulose sources, it is assumed that the price of ethanol is sufficiently high that all plant sites are constructed and able to make a positive profit. Otherwise, not all sites would be constructed and continue operating. As sites are constructed to convert the total supply of materials, firms acting competitively will locate in order to minimize total costs.
The amount of dry biomass shipped between counties is designated Xijk, where i
is the set of counties where biomass is produced, j is the set of counties where ethanol is potentially produced, and k is the set of biomass feedstocks (corn stover and switchgrass). The relevant parameters for the cost minimization model are as follows:
pk – production cost for biomass feedstock k ($/dry ton shipped with profit)
sk– fixed shipping cost for biomass feedstock k ($/dry ton shipped)
f – freight rate for shipping biomass ($/dry ton shipped/mile)
dij – distance from county i to county j (miles)
Cp – added plant cost for a 50 Mgal facility (reflecting diseconomies of scale)
N – total plant capacity needed (100 Mgal/year)
l – fractional storage loss of biomass feedstock
bik – amount of biomass k produced in county i (dry tons/yr)
The binary (0-1) variables Ij50 and Ij100 represent the number of 50 million and 100
million gallon ethanol plants respectively in county j, and the model is optimized by minimizing the total cost C as follows:
50 100 50 , i , min = j j ijk p k k ij ijk j j k j x I I p s fd x I C C¦¦¦
¦
subject to: 50 100 1 2¦
j Ij¦
j Ij N (1) 50 100 1 j j I I d for each j (2) (1 ) ijk ik j x d l b¦
for each k and i (3)50 100 50 100 k ijk j j i k c x t I I
¦¦
for each j (4) 0 ijkx t for each i, j, and k (5)
50 0,1 j I for each j (6) 100 0,1 j I for each j (7)
The optimization problem has several constraints. Constraints 2, 6, and 7 imply that any county can have at most one plant of either size, 100 Mgal or 50 Mgal, and that fractional plants are not permitted. Constraint 1 requires that the total amount of ethanol produced will exactly exhaust the feedstock resource base. Finally, constraints 3, 4, and 5 require that the amount of biomass supplied by a county cannot exceed the amount available from the farms in that county after taking collection/storage losses into account, and the amount of biomass supplied to each manufacturing site must be sufficient to cover the production level. The problem is implemented using GAMS version 22.5 (Brooke et al, 2005).
To determine the sensitivity of the model to biomass availability and total
statewide ethanol output levels, several of the strong assumptions of the Billion-ton study are relaxed in a second application of the model, with each adjustment of assumptions resulting in lower ethanol yields for Indiana in what is considered a more conservative scenario. For instance, our base case assumes that all cropland is managed with no-till