Recommended citation: Djamasbi, Soussan (2014) “Eye Tracking and Web Experience,” AIS Transactions on Human-Computer Interaction, (6) 2, pp. 16-31.
Eye Tracking and Web Experience
Soussan Djamasbi
User Experience and Decision Making (UXDM) Lab Worcester Polytechnic Institute
Abstract
User experience research aims to understand a user’s point of view. Because eye tracking allows us to literally see through a user’s eyes, it can serve as a valuable tool in web studies, particularly in web design and development. To understand how eye tracking can be pivotal in website studies, this paper scientifically explains how the human visual system works and how eye tracker technologies can record what we register with our eyes. It then explains how web design can benefit from the data that eye tracking studies deliver. Finally, the paper discusses trends for eye tracking in future web experience research.
Keywords: Eye Tracking, Gaze Point, User Experience, Web Experience, Website, Webpage, Heat Maps, Gaze Plots, Areas of Interest (AOI), AOI maps, Fixation Duration, Fixation Frequency, Fixation Timing.
1. Introduction
“Eye tracking can provide unique insight into visual search tasks. Researchers often ask participants to think out loud and describe what they’re doing, but there are two potential downsides to this approach: 1), the participant can become distracted from the task, 2) the participant may not report everything that he or she sees, either as an omission or because the information is not observed at a conscious level. Eye tracking provides an objective measurement of participants’ visual patterns that allows us to determine what aspects of our designs draw attention first and most. For websites like ours, this is particularly valuable when educating a user on a complex topic, making it clear what the next step in a process is, or driving users towards a call to action.”
(Dr. Tom Tullis, VP of User Experience Research at Fidelity Investments, in Djamasbi and Hall-Phillips, 2014, p.34)
With rapid advances in information technologies (IT), websites have become an accepted and widely adopted communication medium. Because user experience is increasingly important in developing competitive and innovative products, understanding how users experiences a website is important in designing to drive behaviors. Recent research makes a compelling case for the business value of data-driven web experience design and its impact on product sales and revenue (Djamasbi et al., 2014b). Not surprisingly, in order to stay competitive in the market, more and more companies run user experience studies to design and/or improve their webpages (e.g., Albert & Tullis, 2013; Djamasbi et al, 2014b; Tullis & Siegel, 2013; Tullis, Siegel, & Sun, 2009). By investing in user experience research, companies create business value both during the web development life cycle and after their website is launched. When conducted during web development, user experience research helps inform a website’s design and thus increases the likelihood that it will be successful. Post-launch user experience research helps maintain market share (Djamasbi et al., 2014b; Albert & Tullis, 2013).
Because webpages are visual displays, being able to “see” a webpage from a user’s point of view provides a wealth of information about how a user experiences a website. One promising technology that allows us to literally “see” a webpage from a user’s point of view is eye tracking. By recording a continuous stream of gaze points, eye tracking devices can help us capture how users view webpages. Our eyes move constantly to select a subset of available information in our visual field1 and send it to our
brain for processing. By tracking eye movements on a webpage, we can capture the subset of information that a user’s eye prepares for the brain to make sense of it. This subset of information is typically formed by what the user’s visual system has recognized as relevant, important, or “eye-catching”.
In order to better understand why and how eye tracking information can be useful in web experience studies, I explain the human visual system in Section 2. In Section 3, I explain how most contemporary eye trackers capture eye movements. In Section 3, I also discuss several highly valued eye tracking measures in industry research and explain how scholars and practitioners can benefit from these measures. Finally, I conclude the paper in Section 4 and discuss future trends in eye tracking for web experience research.
2. Visual System: How Do We See?
In order to “see” an object, light has to reflect off an object and travel to our eyes. The light energy captured by our eyes is converted into electrical (neural) signals and then is sent to our brain for further processing. Thus, the first step in seeing an object starts with registering the light reflected from that object with our retina, a light-sensitive layer at the back of our eyes. There are two types of visual sensory receptor in retina: rods and cones. Rods are active in low light intensity environments such as in a dark room or at dusk without artificial illumination. They specialize in producing black and white images. Cones, on the other hand, specialize in producing color vision but they are active only under well-illuminated conditions such as in a well-lit room or in broad daylight. The retina features far fewer cones (about 7 million) than rods (about 120 million) (Duchowski, 2007). The majority of cones are located in the fovea, a small area at the center of the retina (Figure 1). Because of its densely packed array of cones, the fovea registers the external world far more sharply than any other part of the retina. Therefore, in order to see an object with 100 percent acuity, we adjust our eyes so that the light reflected from the object falls onto the fovea.
Figure 1. The Eye
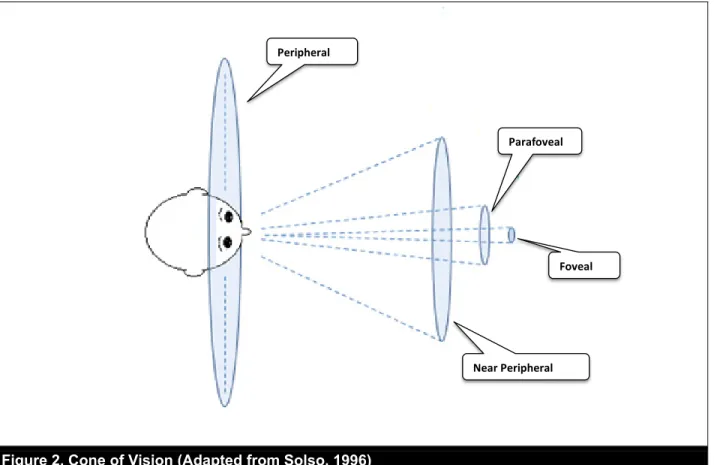
While our foveal vision is sharp and colorful, it covers only about 2 degrees of our visual field, a small area roughly the size of our thumbnail kept at an arm’s length from our body (Figure 2). Visual acuity falls
1 The visual field refers to the space in which we can see objects without moving our eyes (See Figure 2) (Lin et. al 2004).
Fovea Optic Nerve Cornea Retina Visual Axis Iris Lens
off drastically from the center of the gaze. For example, we can see only with about 50% acuity at 5 degrees. Our “useful” visual field is limited to about 30 degrees, and beyond that our retina is mostly used to detect motion (Duchowski, 2007; Solso, 1996).
Figure 2. Cone of Vision (Adapted from Solso, 1996)
To compensate for our narrow foveal vision, we constantly scan our visual field with rapid ballistic eye movements called saccades. Saccadic eye movements can be small (i.e., cover short distances) (e.g., during reading). They can also be large (i.e., cover longer distances) (e.g., looking around a room). We do not process visual information during saccades when our eyes move rapidly from one area to another. We process visual information between saccades, when we keep our gaze relatively steady for short periods to reposition a new image onto the fovea, or to take a “foveal snapshot” of an object. The short stops between saccades, which are called fixations, take up the majority of our viewing time (about 90 percent) (Duchowski, 2007).
3. Making the Invisible Visible: How Does Eye Tracking Work?
Eye tracking refers to capturing the focus of a viewer’s gaze on a stimulus at a given time. This is typically done by tracking a viewer’s eye movements. Most commercially available eye-tracking systems today can capture eye movements using an unobtrusive method known as video-based corneal reflection (Duchowski, 2007). Figure 3 provides examples of contemporary remote eye tracking systems.
Peripheral
Near Peripheral Parafoveal
d. Eye tracker for mobile devices a. Eye tracker with removable monitor
b. Eye tracker attached to a computer screen
c. Eye tracker attached to a laptop screen
Figure 3. Examples of Contemporary Remote Eye Tracking Devices
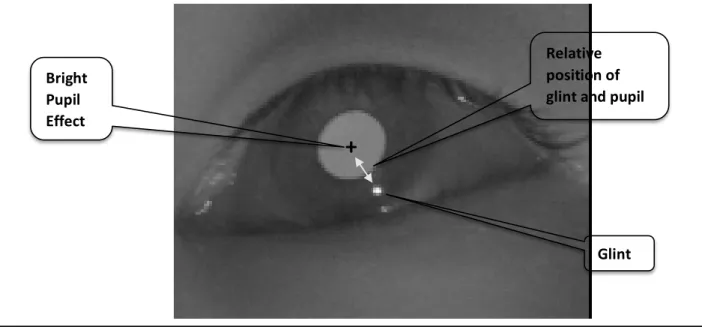
The video-based corneal reflection method of eye movement detection relies on image processing software to capture two specific ocular features: 1) the corneal reflection appearing as a small bright glint on the surface of the eye, and 2) the center of the pupil. The corneal reflection, or glint, is created by projecting infrared light into the eye, which also turns the pupil into a well-defined bright disc that makes its detection easier. The relative position of glint and pupil center, along with some trigonometric calculations, allows the eye tracking software to calculate a viewer’s gaze location on a stimulus such as a webpage. Figure 4 shows the bright pupil effect, glint, and the distance between glint and pupil center, which is essential in detecting the gaze point on a stimulus.
Figure 4. Video-Based Corneal Reflection Technique (Adapted from Meunier (2009) and Zhu and Ji (2007))
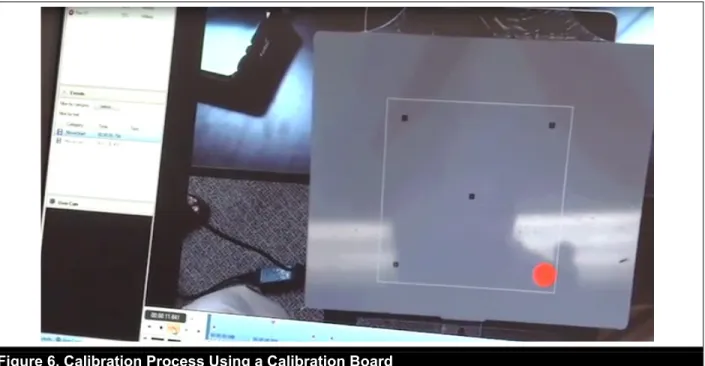
In order to provide valid data, the eye tracker must be calibrated for each viewer (Figure 4). During the calibration process, the eye tracker learns how certain coordinates on the stimulus (e.g., certain coordinates on a computer screen or a calibration plate) correspond to a viewer’s eye position. By asking the viewer to look at several dots (typically five to nine dots) on the computer screen or a calibration plate, the calibration process allows the eye tracker to associate the viewer’s glint/pupil data with known locations on the stimulus. Figure 5 shows an example of a calibration process on a desktop computer, where the user is asked to follow the movement of a red dot on the screen. Figure 6 shows the same process but for a calibration plate. During this process, the user is asked to fixate on one of the five points on the calibration plate. The red spot in Figure 6 shows where the user is fixated on the calibration plate on a computer screen.
Figure 5. Calibration Process Using Computer Screen
Glint Bright Pupil Effect Relative position of glint and pupil
Figure 6. Calibration Process Using a Calibration Board
Because our eyes move constantly, eye trackers must capture eye movements frequently to record gaze points properly. The frequency of an eye tracker’s data collection is denoted by the eye tracker’s sampling rate. For example, an eye tracking device with a 60Hz sampling rate can records gaze points every 16.6 milliseconds, which is an adequate sampling rate for web studies.
As discussed earlier, we process information only during fixations, short stops between saccades where we take foveal snapshots of objects. Therefore, information obtained from eye tracking is mostly about fixations. Fixations are formally defined as relatively stable gazes with a minimum time threshold and thus are calculated by aggregating a series of raw gaze points that cluster together in the specified minimum span of time. The relative stability in fixation definition is important because our eyes are never still. Even during fixations, our eyes exhibit small oscillations. The time-period during which the gaze is relatively stable is also important because our visual system tends to perceive different objects at various speeds. For example, the visual sensory system of most people can perceive words with as little as 50-60 milliseconds of exposure, while, for images, people tend to need at a minimum 150 milliseconds of exposure (Rayner, 2009). In other words, for textual web pages, 60 milliseconds can serve as a suitable threshold for fixations, but the same threshold may not be appropriate for fixations on webpages with complex scenery. Many web studies use a 100 millisecond fixation threshold to filter people’s gazes on various elements on webpages (e.g., Buscher, Dumais, & Cutrell, 2010; Buscher, Cutrell, & Morris, 2009). In order to identify features that capture longer sustained attention, many web studies use 300 milliseconds as the minimum threshold for fixations (e.g., Djamasbi, Siegel, & Tullis, 2010).
3.1. What are Fixation Patterns?
Fixation patterns refer to the visualization of fixation points on a stimulus. Fixation patterns can provide invaluable information about a user’s spatial distribution and order of foveal snapshots on the stimuli. Figure 7 displays an example of fixation pattern for a single user visualized as gaze plots on a webpage. The spots on the gaze plot represent fixations, with larger spots representing longer fixations. The numbers in the spots represent the order of fixations and the lines indicate saccades.
Figure 7. Example of a Gaze Plot
While gaze maps are useful in showing a user’s sequence of fixation, they become cluttered when we need to track fixation patterns for multiple users (Figure 8a). Heat maps provide a more user-friendly way for visualizing eye tracking data for multiple users. Similar to gaze plots, heat maps can not only show us objects that were registered by users’ eyes, but also indicate how intensely people looked at the objects. On heat maps, various colors represent different fixation intensities: red denotes the most intense fixations, yellow moderate ones, and green the least intense ones.. Areas with no color indicate that users did not fixate on those parts of the stimulus. Figure 8b displays an example of a heat map for a group of participants browsing a webpage. The large red spot on the top left corner of the heat map shows that the logo received the most intense fixation on the page. While heat maps represent the location and intensity of fixation for multiple users in a color-coded easy-to-understand way, they do not provide information for saccades nor do they give us any information about the order of fixations.
a. Aggregated gaze plots b. Aggregated heat map
Visualizing fixation data is invaluable for effectively and efficiently detecting opportunities for improvement. Therefore, maps that visualize aggregated fixation data are highly valued in web design. In Sections 3.2 to 3.4, I explain how web studies can benefit from heat maps. I also explain how aggregated fixation data can be visualized regionally to reveal viewing behavior for targeted areas on a webpage.
3.2. How Can Web Studies Benefit from Heat Maps?
Heat maps visualize viewer fixations (see Figure 8b). Industry values heat maps because they efficiently inform more effective web design (see the opening quote and other quotes from industry experts in Djamasbi and Hall-Phillips (2014)). Design decisions driven by heat maps are often later validated by web analytics. However, academic researchers tend not to pay as much attention to heat maps as their industry counterparts do. For example, heat maps are often not included in discussions about eye tracking measures (e.g., Poole & Ball, 2006). One reason for this is that heat maps typically cannot be used in statistical analysis (although, in Section 3.3, we see that there is a way to quantify viewing patterns on heat maps). In the following paragraphs, I discuss some ways in which heat maps were successfully used to design customer and/or employee facing pages.
As I explained in Section 3.1, users go through a chain of fixations to view a webpage. Eye movement data suggests that users tend to skim a page for an entry point—an anchor-like point on a webpage that allows them to collect information around that entry point. Designing webpages with distinct visual hierarchies can make navigating a webpage easier because it can help users to easily find entry points to the page (Djamasbi & Hall-Phillips, 2014; Djamasbi et al., 2011a). Heat maps can show us whether a webpage is successful in helping users find important entry points effectively and whether it encourages users to inspect the page thoroughly. The heat maps in Figure 9 provide examples of viewing patterns for two different types of webpages: a home page and a news page. The dispersed fixation pattern covering almost the entire page in Figure 9a indicates that this home page was thoroughly viewed. Similarly, the red and yellow color spots scattered throughout the page in Figure 9b indicate that users took foveal snapshots of the majority of headings and links on the news page. Because headings and links provide a summary of key information, such a viewing pattern is desirable on a news page: it suggests that the design was successful in enticing people to pay attention to key information on the page (Djamasbi & Hall-Phillips, 2014; Djamasbi et al., 2011b).
a. A home page b. A news page
Figure 9. Heat Maps Showing Dispersed Fixation Patterns
Heat maps can also help us to see the impact of specific perceptual elements on viewing behavior (Tullis et al., 2009; Djamasbi, Siegel, & Tullis, 2014a). For example, heat maps from various eye tracking experiments consistently and repeatedly show that people are drawn to faces, particularly when browsing a webpage. When human images are present on websites, viewers tend to focus mainly on faces. Given the importance of faces in non-verbal communication, this viewing pattern is not surprising (Djamasbi, Siegel, & Tullis, 2012b). Heat maps in Figure 10 display a few eye tracking examples of this phenomenon (note the red spots on faces).
Grounded in the argument that attention to faces has been important in humans’ survival and well-being, a recent eye tracking study used heat maps to show that faces, more than other images, can draw users’ attention (Djamasbi et al., 2012b). Because of this, faces on a webpage can have the unintended consequence of diverting attention away from information that is placed adjacent to them. For example, images of faces can have a significant negative impact on users’ performance of tasks that rely on information next to them (Djamasbi et al., 2012b). Thus, web designers should pay careful attention to images of faces and, when possible, use eye tracking or other user experience tests to see if they affect attention to their adjacent information. Additionally, they should make sure that images of faces support the content. Images of faces in the study discussed above were relevant to content. Mismatched images and content can have a serious negative impact on effective communication of a message. Therefore, when images of faces do not clearly support the content, they most likely produce unfavorable results. I have observed negative reaction to images of people when they did not clearly support the content in a number of my web design investigations.
Figure 10. Heat Maps Showing Attention to Faces
Heat maps can also help compare viewing behavior of groups of users. For example, Djamasbi, Siegel, Skorinko, and Tullis (2011a) used heat maps to compare viewing behavior of old and young users. The heat maps in the aforementioned study revealed that Baby Boomers, compared to Generation Y users, exhibit a more “patient” viewing pattern. The heat maps for older users contained more intense fixations (red spots). The colored spots on these heat maps spanned the entire page. The heat maps for Generation Y users, on the other hand, showed an “impatient” viewing behavior. The heat map for Generation Y had fewer red spots, which indicates that they had fewer intense fixations on the page. The smaller size of the colored areas on the heat maps for Generation Y showed that they looked at fewer items on the page. The concentration of colored spots on the top portion of the page indicated that Generation Y users showed little interest in viewing items that were placed below the fold (part of the page that required them to scroll the page). Figure 11 displays two heat maps, which provide an example of these differences.
a. Baby Boomer b. Generation Y
Figure 11. Example of Heat Maps for Baby Boomer and Generation Y Users
3.3. Can We Quantify Heat Maps?
Heat maps display viewing patterns as color-coded pictures. There is value in comparing these patterns statistically. One of the major contributions of Djamasbi et al.’s study (2011a) was that it provides a method for comparing viewing patterns quantitatively. By calculating the spatial distribution of fixations on heat maps (the area of fixations), the study provides a novel eye tracking metric to quantify viewing patterns. Because fixation patterns of careful and thorough viewers cover larger areas of a webpage, this metric serves as a suitable measure to compare differences in viewing behaviors. For example, Djamasbi et al. (2011a) used this metric to show that Baby Boomers were significantly more thorough in viewing webpages than their younger counterparts.
3.4. How Else Can We Visualize Data?
Aside from generating gaze plots and heat maps, fixation data can also be used to visualize information for targeted areas on a webpage. There are four types of fixation data that are particularly effective in revealing viewing behavior for targeted areas of a webpage: fixation duration, fixation frequency, fixation timing, and percentage of viewers. Fixation duration refers to the amount of time that someone has a perceptual element under foveal scrutiny. Fixation frequency is the number of times someone fixates on a perceptual element. Fixation timing reveals the order by which someone views a perceptual element. It can also show the speed at which someone detects a perceptual element. Percentage of viewers reflects the number of people who viewed a perceptual element. Fixation duration, frequency, timing, and percentage of viewers represent attention to web elements and thus provide invaluable information for designing targeted areas of a webpage.
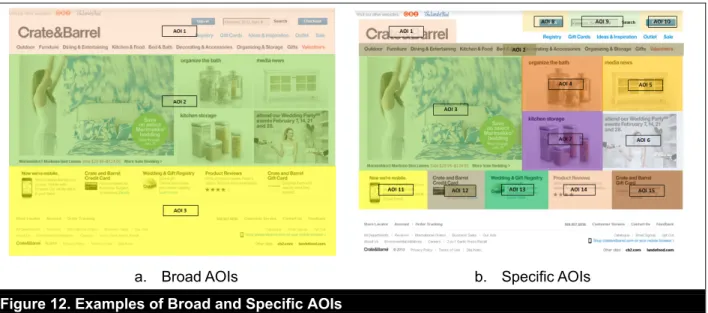
In order to create a map of fixation information for targeted areas, a webpage is grouped into regions. These regions are called areas of interest (AOIs) and can be created in various ways depending on the research question. For example, AOIs can be created to cover broad sections of the page or they can be created to encircle a specific perceptual element. Broad AOIs allow us to aggregate fixation information based on regions of the page (e.g., top, middle, and bottom). With specific AOIs, we can aggregate fixation information for specific elements (e.g., logo, image, or sign-in) (Figure 12).
a. Broad AOIs b. Specific AOIs
Figure 12. Examples of Broad and Specific AOIs
After organizing a webpage into distinct regions, AOI maps are created by reporting fixation data for each region (e.g., Figures 13 and 14). In addition to facilitating visual inspection of regional data, AOI maps allow us to compare and contrast the regional data quantitatively. For example, we can compare the AOI data for a broad region in various designs (e.g., compare the AOI data for the top section of the page for two different designs), or we can compare the AOI data between various designs for a specific perceptual element (e.g., compare the AOI data for two different designs of the “sign-in” button).
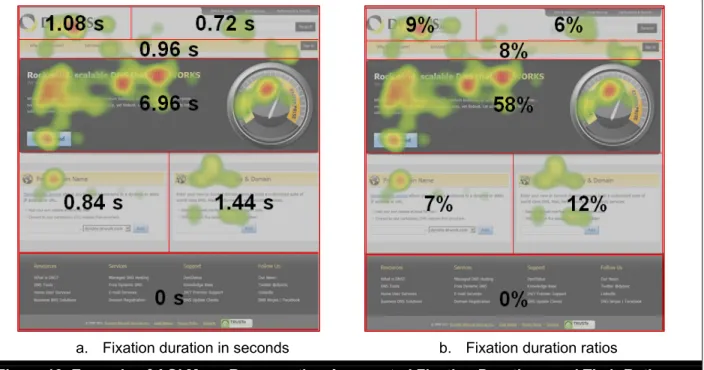
Because longer fixation durations can indicate higher levels of attention or interest (Poole & Ball, 2006; Cyr, Head, Larios, & Pan, 2009; Cyr & Head, 2013), AOI maps for fixation duration can help to identify regions of the page that adequately captured people’s attention and those that need improvement. Figure 13a displays the AOI map for aggregated fixation durations on various sections of a commercial webpage. This map shows a typical viewing behavior for webpages that create a distinct visual hierarchy using a large main image (Djamasbi et al., 2010; Djamasbi et al., 2011a). As Figure 13a shows, the main section of the page (the section with the large image of a dial) was viewed much longer than the rest of the page. The same information can also be visualized through fixation ratios. The AOI map in Figure 13b shows how aggregated fixation duration ratios were distributed among the 7 AOIs on the webpage. This data shows that the large main section of the page received 58 percent of total fixation duration. The logo,
the search bar, the navigation bar, and the two smaller informational windows below the main image received almost equal percentage of users’ fixation time, while the bottom part of the page received no fixation at all.
Fixation duration does not always indicate positive attention. Longer fixations could also indicate confusion. For example, viewers may look at an AOI longer if they cannot find their desired information (Djamasbi & Hall-Phillips, 2014; Poole & Ball, 2006). In this case, longer fixation durations and ratios may represent poor communication. Because we can interpret fixation duration in two diametrically opposed ways (attention or confusion), we need the context and additional data points such as surveys, interviews, and/or observations to correctly interpret a viewer’s duration of fixation on an AOI.
Similarly, AOI maps can use fixation frequency, or the frequency by which an AOI is visited, to provide valuable insight regarding attention to targeted areas on a webpage. If an area of a webpage is interesting, people are more likely to visit it more than one time. Thus, higher fixation frequencies for an AOI can indicate interest in the AOI. Similar to AOI maps for fixation duration ratios (Figure 13b), we can create AOI maps that reflect the ratio of fixation frequencies. Fixation frequencies, similar to fixation durations, can indicate two opposing concepts: interest or confusion. If someone is confused, they are likely to look around visiting the same areas over and over again with the hope of finding a suitable entry point. Again, here the context and additional data should be used to interpret the results correctly (Djamasbi et al., 2011a; Djamasbi & Hall-Phillips, 2014).
a. Fixation duration in seconds b. Fixation duration ratios
Figure 13. Example of AOI Maps Representing Aggregated Fixation Durations and Their Ratios
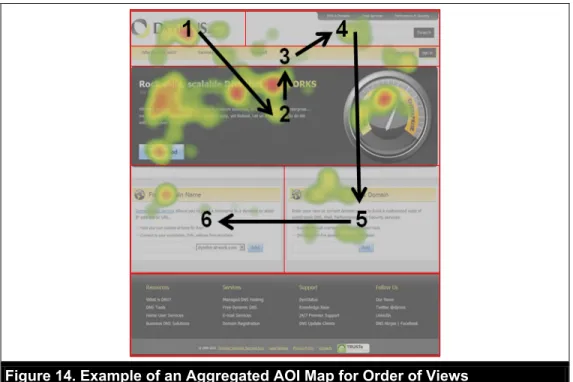
Fixation timing is another important metric for examining aggregated behavior for targeted areas on a webpage. The timing of fixations on each AOI can tell us the order by which users viewed the AOIs (Djamasbi et al., 2010). The order of views can provide valuable information about how users scan various sections of a page. For instance, Figure 14 shows that the logo served as an entry point to the page (i.e., users scanned the page by starting with the logo). After looking at the logo, users shifted attention to the main section of the page that contained a large image, then to the navigation bar, then to the search box, followed by the right informational window below the main section, and finally the left informational window below the main section.
Figure 14. Example of an Aggregated AOI Map for Order of Views
Fixation timing of a perceptual element can also show how quickly viewers notice an element. This information is helpful in capturing the banner blindness phenomenon (i.e., when users ignore provided information) ((Chatterjee, 2008; Djamasbi, Siegel, & Tullis, 2012a; Djamasbi et al., 2007; Djamasbi & Hall-Phillips, 2014; Dreze & Hussherr, 2003; Hervet et al., 2011). Studies have shown repeatedly that the same design techniques that can make a perceptual element salient (so that the element can serve as a suitable entry point to the page) can also trigger banner blindness (Djamasbi & Hall-Phillips, 2014). For example, even mild changes in background color of an informational window can have a significant impact on how quickly users notice it (Djamasbi et al., 2012a). Figure 15 provides an example of AOI maps for detecting banner blindness. Figure 15a displays two prototypes of the same page that differ only in the background color of one of their informational windows, marked in each prototype as an AOI. Figure 15b provides the aggregated fixation timing maps for the prototypes. While the informational window in the right website uses only a slightly more contrasting background color than the informational window on the left page, as revealed by the AOI maps, it took viewers significantly longer (4.92 seconds vs. 17.29 seconds) to look at the informational window with the more contrasting green background color (Djamasbi et al., 2012a).
a. AOIs on each prototype
b. Aggregated AOI maps showing the time (in seconds) that it took participants to notice the AOIs
Figure 15. Background Color and Noticeability of AOIs (Adapted from Djamasbi et al., 2012a)
Another way to visualize the regional distribution of attention on a webpage is by creating an AOI map for the number of people who viewed various areas of the page. The more attractive an AOI, the more likely it is for the AOI to get traffic from a larger number of users. We can visualize the aggregated unique visits to demonstrate the percentage of people who viewed various AOIs. For example, Figure 16 shows the percentage of users that viewed each of the 7 AOIs on the webpage. As Figure 16 shows, all participants viewed the large main section of the page, while only half of the participants viewed the informational windows below the main section. The logo, search box, and navigation bar drew almost half of the participants’ attention.
AOI AOI
Figure 16. Example of Aggregated AOI Maps for Percentage of Viewers
3.5. What Does the Future Hold for Using Eye Tracking in Web Studies?
Because eye tracking can help us capture what catches a user’s eye on a visual display, it can provide invaluable insight into consumer preferences and behaviors. Therefore, eye tracking has the potential to become an industry standard for designing and developing websites.
Before eye tracking can become mainstream in industry, these technologies have to become more researcher friendly. There has been a great deal of progress in eye tracking technologies to make them participant friendly. Contemporary eye trackers can collect data unobtrusively and remotely without requiring participants to wear special equipment (see Figure 3). This is an important improvement for website research because equipment can affect how a user interacts with a website. However, the eye tracking devices are still not as user friendly to researchers as they are to study participants. Eye trackers, unless they are built into monitors, require manual set up and measurements. When built into computer monitors, eye trackers are harder to use in field studies. While smaller portable eye trackers that use video-based corneal reflection techniques are becoming available for desktop and laptop screens, they still require special stands for collecting eye tracking data on mobile devices. In regard to portability (e.g., field studies), the mobile eye tracking stands are still relatively bulky and their set up is still fairly laborious (see Figure 3d).
Collecting, validating, and analyzing data can benefit from easier and more intuitive interfaces. In particular, there is a great deal of opportunity for improvement in streamlining the collection and analysis of eye tracking data on mobile devices. Currently, data analysis for mobile devices requires a great deal of manual processing, which makes analyzing mobile eye tracking data labor intensive and time-consuming.
In addition to becoming friendlier to researchers, eye tracking technologies need to become more affordable before they can be used on a larger scale in industry research labs. Once quality eye trackers become affordable, manufacturers are likely to build them into the next generations of computing devices. Furnishing consumer computers and mobile devices with built-in eye trackers can facilitate a new array of opt-in user studies enabling researchers to run large scale “online eye tracking” web studies in the same manner that online surveys are conducted today.
4. Conclusion
Designing for positive web experiences is no longer a luxury but a must for staying competitive in today’s business environment. Eye tracking can play an important role in designing successful and effective websites and, as such, it has the potential to become an industry standard in best practices for website design. This potential promises a new and productive line of research for user experience scholars and practitioners.
References
Albert, W., & Tullis, T. (2013). Measuring the user experience: Collecting, analyzing, and presenting usability metrics (2nd edn). Waltham, MA: Morgan Kaufmann.
Buscher, G., Dumais, S. T., & Cutrell E. (2010). The good, the bad, and the random: An eye-tracking study of ad quality in web search. Proceedings of the 33rd International ACM SIGIR Conference on Research and Development in Information Retrieval, 42–49.
Buscher, G., Cutrell, E., & Morris, M. R. (2009). What do you see when you’re surfing? Using eye tracking to predict salient regions of web pages. Proceedings of the SIGCHI Conference on Human Factors in Computing Systems, ACM, 21-30.
Chatterjee, P. (2008). Are unclicked ads wasted? Enduring effects of banner and pop-up ad exposures on brand memory and attitudes. Journal of Electronic Commerce Research, 9(1), 51-61.
Cyr, D., & Head, M. (2013). The impact of task framing and viewing time on user website perceptions and viewing behavior. International Journal of Human Computer Studies, 71(12), 1089–1102.
Cyr, D., Head, M., Larios, H., & Pan, B. (2009). Exploring human images in website design: A multi-method approach. MIS Quarterly, 33(3), 539–566.
Djamasbi, S., McAuliffe, D., Gomez, W., Kardzhaliyski, G., Liu, W., & Oglesby, F. (2014b). Designing for success: Creating business value with mobile user experience (UX). Lecture Notes in Computer Science, 8527, 299–306.
Djamasbi, S., Siegel, M., & Tullis, T. (2014a). Can fixation on main images predict visual appeal of homepages? Proceedings of the Forty-Seventh Annual Hawaii International Conference on System Sciences, 371-375.
Djamasbi, S., & Hall-Phillips, A. (2014). Visual search. In A. Schall & J. R. Bergstrom (Eds.), Eye tracking in user experience design (pp. 27-43). Waltham, MA: Morgan Kaufman.
Djamasbi, S., Siegel, M., & Tullis, T. (2012a). Designing noticeable bricklets by tracking users’ eye movements. Proceedings of the Forty-Fifth Annual Hawaii International Conference on System Sciences, 525-532
Djamasbi, S., Siegel, M., & Tullis, T. (2012b). Faces and viewing behavior: An exploratory investigation. Transactions on Human-Computer Interaction, 4(3), 190-211.
Djamasbi, S., Siegel, M., Skorinko, J., & Tullis, T. (2011a). Online viewing and aesthetic preferences of generation y and the baby boom generation: Testing user web site experience through eye tracking. International Journal of Electronic Commerce, 15(4), 121-158.
Djamasbi, S., Siegel, M., & Tullis, T. (2011b). Visual hierarchy and viewing behavior: An eye tracking study. Lecture Notes in Computer Science, 6761, 331-340.
Djamasbi, S., Siegel, M., & Tullis, T. (2010). Generation Y, web design, and eye tracking. International Journal of Human-Computer Studies, 68(5), 307-323.
Djamasbi, S., Tullis, T., Hsu, J., Mazuera, E., Osberg, K., & Bosch, J. (2007). Gender preferences in web design: Usability testing through eye tracking. Proceedings of the 13th Americas Conference on Information Systems, 1-8.
Dreze, X., Hussherr, F. (2003). Internet advertising: is any-body watching? Journal of Interactive Marketing, 17(4), 8-23.
Duchowski, A. (2007). Eye tracking methodology: Theory and practice. Springer, Berlin Heidelberg. Hervet, G., Guérard, K., Tremblay, S., & Chtourou, M. S. (2011). Is banner blindness genuine? Eye
tracking Internet text advertising. Applied Cognitive Psychology, 25(5), 708-716.
Lin, Y., Chen, W., Chen, D., & Shao, H. (2004). The effect of spectrum on visual field in road lighting. Building and Environment, 39(4), 433-439.
Meunier, F. (2009). On the automatic implementation of the eye involuntary reflexes measurements involved in the detection of human liveness and impaired faculties. In Y.-S. Chen (Ed.), Image processing. Retrieved from
http://www.intechopen.com/books/image-processing/on-the-automatic-implementation-of-the-eye-involuntary-reflexes-measurements-involved-in-the-detecti Poole, A., & Ball, L. J. (2006). Eye tracking in human-computer interaction and usability research: Current
status and future prospects. In C. Ghaoui (Ed.), Encyclopedia of human computer interaction, 211–219. Pennsylvania, PA: Idea Group.
Rayner, K. (2009). Eye movements and attention in reading, scene perception, and visual search. The Quarterly Journal of Experimental Psychology, 62(8), 1457-1506.
Solso, R. L. (1996). Cognition and the visual arts. Cambridge, MA: MIT Press.
Tullis, T., Siegel, M., & Sun, E. (2009). Are people drawn to faces on webpages? CHI'09 Extended Abstracts on Human Factors in Computing Systems, ACM, 4207-4212.
Tullis, T., & Siegel, M. (2013, April). Does ad blindness on the web vary by age and gender? CHI'13 Extended Abstracts on Human Factors in Computing Systems, ACM, 1833-1838.
Zhu, Z., & Ji, Q. (2007). Novel eye gaze tracking techniques under natural head movement. IEEE Transactions on Biomedical Engineering, 54(12), 2246-2260.