Brussels Metropolitan Region
Benchmarking Analysis 2007
Editor
BAK Basel Economics Project Management Martin Eichler Editorial Staff Martin Eichler Ueli Grob Address
BAK Basel Economics Güterstrasse 82 CH-4002 Basel Tel. +41 61 279 97 00 Fax +41 61 279 97 28 [email protected] http://www.bakbasel.com
Contents
Contents
1 Introduction ...4
Cities as nodes in global networks ...4
Benchmarking cities and regions...4
The concept of functional city regions ...5
Defining the Brussels Metropolitan Region...5
Choosing international benchmarking regions...6
The key industries...8
2 The Brussels Metropolitan Region...10
3 Brussels Metropolitan Region under the International Benchmarking Lens ...19
3.1 Economic Performance...19
3.2 The Driver Sectors ...29
3.3 The BMR’s Key Industries...36
4 The Benchmarking of Location Factors ...57
4.1 Innovation Resources ...57
4.2 Regulation ...66
4.3 Taxation...68
4.4 Accessibility...71
5 Summary and Conclusions...73
6 References ...76
7 Appendix ...77
7.1 Detailed definition of the benchmark regions...77
7.2 The principle of the driver sectors...78
Figures
Figure 1-1 The Brussels Metropolitan Region... 6
Figure 1-2 The Benchmark Regions ... 8
Figure 2-1 Growth of real GDP, Employment and Population, Brussels Metropolitan Region.... 10
Figure 2-2 Growth of real GDP, Employment and Population, Brussels Capital Region... 11
Figure 2-3 Growth of real GDP, Employment and Population, Brabant Walloon and Halle-Vilvoorde ... 12
Figure 2-4 Share of the five driver sectors in nominal GDP... 13
Figure 2-5 Share of the five driver sectors in total employment... 14
Figure 2-6 The BMR’s five driver sectors 1980-2000, 2000-2006 ... 16
Figure 2-7 Share of the ten key industries in nom. GDP ... 17
Figure 2-8 The BMR’s ten key industries 1980-2000, 2000-2006 ... 18
Figure 3-1 Population 2006 ... 19
Figure 3-2 Growth of population 1995-2000, 2000-2006 ... 20
Figure 3-3 Growth of real GDP 1995-2000, 2000-2006... 21
Figure 3-4 Nominal GDP per capita in 2006 ... 22
Figure 3-5 Growth of real GDP per capita 1995-2000, 2000-2006 ... 23
Figure 3-6 Growth of employment 1995-2000, 2000-2006 ... 24
Figure 3-7 Growth of real GDP and employment 1995-2006 p.a ... 25
Figure 3-8 Nominal employment productivity 2006... 26
Figure 3-9 Nominal hourly productivity in regions (large pillar) and corresponding countries (small pillar) 2006 ... 27
Figure 3-10 Growth of hours worked and real hourly productivity ... 28
Figure 3-11 Urban Sector: Contribution to real GDP growth 1995-2006 ... 30
Figure 3-12 Urban sector: Contribution to employment growth 1995-2006... 31
Figure 3-13 Political Sector: Contribution to real GDP growth 1995-2006 ... 32
Figure 3-14 New Economy: Contribution to real GDP growth 1995-2006 ... 33
Figure 3-15 Traditional Sector: Contribution to real GDP growth 1995-2006 ... 34
Figure 3-16 Old Economy: Contribution to real GDP growth 1995-2006... 35
Figure 3-17 Business services excluding real estate: Contribution to real GDP growth 1995-2006 ... 36
Figure 3-18 Business services excl. real estate: Contribution to employment growth 1995-2006 ... 37
Figure 3-19 Banking and insurance: Contribution to real GDP growth 1995-2006... 38
Figure 3-20 Banking and insurance: Contribution to employment growth 1995-2006... 39
Figure 3-21 Real estate: Contribution to real GDP growth 1995-2006 ... 40
Figure 3-22 Knowledge services: Contribution to real GDP growth 1995-2006 ... 41
Figure 3-23 Transport: Contribution to real GDP growth 1995-2000 ... 42
Figure 3-24 Transport: Contribution to real GDP growth 2000-2006 ... 43
Figure 3-25 Transport: Contribution to employment growth 1995-2006 ... 44
Figure 3-26 Health and social services: Contribution to real GDP growth 1995-2006 ... 45
Figure 3-27 Health and social services: Contribution to employment growth 1995-2006... 46
Figure 3-28 Hotels, restaurants, entertainment, culture and sport: Contribution to real GDP growth 1995-2006 ... 47
Figure 3-29 Hotels, restaurants, entertainment, culture and sport: Contribution to employment
growth 1995-2006 ... 48
Figure 3-30 Chemicals and chemical products: Contribution to real GDP growth 1995-2006 ... 50
Figure 3-31 Interest groups and other associations : Contribution to real GDP growth 1995-2006 ... 52
Figure 3-32 Precision and optical equipment, watches: Contribution to real GDP growth 1995-2006 ... 53
Figure 3-33 Trade and repair: Contribution to real GDP growth 1995-2006... 54
Figure 3-34 Trade and repair: Contribution to employment growth 1995-2006... 55
Figure 3-35 Postal service and telecommunications: Contribution to real GDP growth 1995-2006 ... 56
Figure 4-1 Share of highly qualified and not qualified employment in total employment 2006... 58
Figure 4-2 Share of expenditure on R&D in nominal GDP 1995 and 2004 ... 60
Figure 4-3 Patent density (patents/1’000'000 inhabitants)... 61
Figure 4-4 The research quality of universities 2006 ... 63
Figure 4-5 Number of academic publications and number of academic publications per 1'000'000 inhabitants 2006 ... 64
Figure 4-6 Academic publications per sector 2006... 65
Figure 4-7 Regulation of labour markets and product markets 2004... 67
Figure 4-8 Company taxation and taxation of highly qualified* manpower 2007... 69
Figure 4-9 Company taxation 2005 and 2007... 70
1 Introduction
Introduction
Cities as nodes in global networks
Cities have become crucial actors in today’s integrated world. Historically, cities have often played important roles as drivers of economic development, but, in the second part of the last century, many lost their attractiveness and dynamism. Today, one can again speak of a revi-talisation of the function of cities as motors of a globalized economy. One indicator of the increased economic importance is the on-going urbanization process not only in the Third World, but also in cities within highly industrialised countries.
One main driver for this regained importance of cities is the process of globalisation, together with an augmented and internationally organised division of labour. “The current round of globalization is characterized by places selectively functioning as nodes within global net-works” (Felsenstein et al. 2002), describing the regained importance of cities. Also, the path towards the knowledge driven economy goes along with increasing advantages of density, an asset specifically offered by cities.
How successful are cities in their function as nodes in the worldwide economic network? Are they competitive in the long run? What kind of factors play a crucial role and how can those factors be influenced and improved? To foster economic growth and to maintain regional prosperity, it is important for cities to become aware of the special role they play in the global economy and to know their deficits and strengths very well. An International Regional Benchmarking as provided by BAK Basel Economics can help a region evaluate its position in international competition, assess its strength and weaknesses, and shape its future strate-gic development and policy.
Benchmarking cities and regions
Benchmarking is understood as a process that leads to the identification of different bench-marks and to the comparison of the focus region to those benchbench-marks. The explicit aims of benchmarking are to identify the best performer, to enumerate the differences between the best and the rest and to clarify which factors make the best so successful. At the end, the gained knowledge is transferred into reality, e.g. into politics and policy decisions. The method of International Regional Benchmarking applied by BAK Basel Economics is to de-fine the best regions which should be compared (city regions, metropolitan regions) and then to identify the ‘best performers in a peer group of regions’ following a set of criteria such as size, population density, economic structure, innovation degree, geographical location or other certain particularities (e.g. harbour cities, capitals, financial centres, etc.).
This report is the result of an international Regional Benchmarking of the Brussels Metropoli-tan Region produced by BAK Basel Economics on behalf of the Flanders' Chamber of Com-merce and Industry and the Union des Entreprises de Bruxelles. It is meant to contribute to the discussion of the strengths and weaknesses of Brussels and its future development op-portunities as one of Europe’s leading metropolitan regions.
The concept of functional city regions
To achieve a high quality of regional benchmarking, it is essential to choose the right defini-tion of a region, a parameter in which economic actors cooperate; workforce flows and new ideas pass the innovation chain to saleable products.
Today, a city relies more than ever on its economic surrounding areas. Like in the late Middle Ages, there is mutual support between the core city and its surrounding areas. However, in contrast to the sectoral split in former times,, today the core city can provide those areas with high quality jobs, higher education infrastructure like universities, efficient public transport infrastructure, cultural facilities (theatres, museums) and other lifestyle amenities. On the other hand, the surrounding areas provide places to live for the people working in the city, areas for production or for down streamed functions that don’t find space in the city’s dense core.
Often administrative and political responsibilities differ widely from these functionally defined and interrelated regions. This is especially true for large metropolitan regions in Europe, where political regions are usually smaller than functional relationships.
The cooperation and interplay between economic actors as well as policy makers is therefore essential for the success of a functional interwoven area. In the following report, this area will be called a metropolitan region, consisting of the core city itself and the functionally associ-ated surrounding areas that heavily depend on one another.
There are three main standard approaches for defining functional city regions:
• The US Metro area concept, which has a long period of development and is therefore well established (also in Canada). Disadvantage: the thresholds used are, due to the different historic evolution, hardly transferable into the European context • The GEMACA approach, which was done for many European countries and therefore fits for the European context.
Drawback: not extended beyond Europe.
• The Urban Audit Larger Urban Zones (LUZ), which covers most of Europe. Disadvantage: Definition is too much based on local judgements, not on the economic reality.
All of these different functional approaches have two things in common. They define a core city region and an area of commuting containing people that regularly travel into the core.
To foster long term economic growth and innovation it is very important for a city region to understand and define itself as one (functional) entity. Also a common identity, which is often underestimated with regards to economic behaviour, can more easily be created with a com-mon definition.
restricted by administrative units for which data is available at actable quality and costs; in the case of Brussels that meant sticking with Arrondissements (Nuts 3). This resulted in a definition of the Brussels Metropolitan Region (denoted as BMR) consisting of three adminis-trative units: the Brussels Capital Region (Nuts 1), Brabant Walloon (Nuts 2) and Halle-Vilvoorde (Nuts 3) (fig. 1-1).
Figure 1-1 The Brussels Metropolitan Region
Choosing international benchmarking regions
Averages provide much information, but they can mask important information as well. There are regions performing far better than the metro average, and other regions performing much worse. Under such circumstances, even if the BMR performs better than the average, it can still learn from the top performing regions. Furthermore, the “average” strategy of successful regions might not be a promising strategy at all. Instead, the average can hide two (or more) strategies with completely different – and possibly opposing – focal issues both of which might be successful. This would, for example, be the case if regions based their strategies on clusters, but in different industries for which different location factors are important.
Therefore, the International Regional Benchmarking analysis focuses on comparing the BMR with specific international competitors instead of an average development. The selection of the regions to be used in the benchmarking has to fulfil two contradictory requirements. On the one hand, regions selected should be similar enough to the BMR to avoid comparing apples with oranges. On the other hand, they should differ enough to reflect a wide variety of economic settings, structures, strategies and levels of success. The regions were selected taking the following issues into account:
Brussels Capital Region
Brabant Walloon Halle-Vilvoorde
• First of all, all regions selected follow a concept of functional metropolitan areas. There is no sense in comparing regions that constitute only a part of a metropolitan region as any analysis of their performance and location factors would be biased.
• The regions are in some way ‘similar’ to the BMR. This includes issues as the size, the economic structure (at minimum, all regions are from highly industrialised coun-tries and have a strong core city at the centre), but also issues like the capital function and specific sectorial strength of the BMR (e.g. financial sector) were taken into ac-count.
• Although there is data available for some regions, it is known that the definition of the region dose not correspond well with the concept of the functional region. Therefore, these regions are not chosen for benchmarking the BMR.
• Finally, the regions selected reflect a variety of more and less successful regions, al-though there is some emphasis on more successful metro regions because one goal of benchmarking is to learn from the best.
The following figure shows the regions chosen for the benchmarking analysis. For the pre-cise definition of these regions, please see the appendix.
Figure 1-2 The Benchmark Regions
The key industries
The benchmark analysis focuses on economic structure and performance, as well as on the most important location factors, the basis of a successful economic development.
A special focus of the benchmark lies on the analysis of the key industries which are the most important drivers of the economy of the BMR. For a detailed analysis the following ten key industries have been identified a priori (ranked by their weight, measured as share of total economy):
• Business services excluding real estate (NACE 71-74)
• Banking and insurance (NACE 65-67)
• Real estate (NACE 70)
• Knowledge services (NACE 73 and 80)
• Transport (NACE 6063) B r u s s e l - H o o f d s t a d V l a a ms Ge we s t R e g i o n Wa l l o n n e Stoc k h olm s lä n Upp s a la lä n Söd e rm a n la nd s lä n Ös te rg ötla nd s lä n J önk öp in gs lä n Kro nob e rg s lä n Ka lm a r lä n Gotla n ds lä n Ble k ing e lä n Sk å n e lä n Ha lla nd s lä n Vä s tra Gö ta la nd s lä n Vä rm la n ds lä n Öre bro lä n Vä s tm a nla n ds lä n Da la rna s lä n Zurich Dublin Edinburgh Randstad London Stokholm Berlin Frankfurt Vienna Luxembourg Milan Paris Lyon Madrid Brussels Metropolitan Region
• Hotels, restaurants, entertainment, culture and sport (NACE 55 and 92)
• Chemicals and chemical products (NACE 24)
• Interest groups and other associations (NACE 91)
• Precision and optical equipment, watches (NACE 33)
The analysis is primarily done for the period 1995-2006 or for the most recent year 2006. Sometimes this period will be split up into the sub-periods 1995-2000 and 2000-2006. In or-der to give a more complete overview, the analysis covers the period 1980-2006 in chapter 2. In chapter 4, the analysis is orientated to the availability of the data and, therefore, focuses on the most recent possible period or year.
The report is organised as follows. In chapter 2, the most important economic indicators of the BMR are analysed. Chapter 3 focuses on the benchmarking of the performance of the most important economic indicators as well as on the benchmarking of the ten key industries. In chapter 4, the location factors are put under the benchmark lens. Chapter 5 sums up the most important findings and concludes.
2 The Brussels Metropolitan Region
The Brussels Metropolitan Region
The objective of this chapter is to provide an overview of the development of the main eco-nomic indicators and of the industry structure of the BMR.
Figure 2-1 Growth of real GDP, Employment and Population, Brussels Metropolitan Region
90 100 110 120 130 140 150 160 170 180 Real GDP Po pulatio n Employment
Note: growth rates p.a., in USD at 2000 prices and 1997 PPP
Source: BAK Basel Economics
• Fig. 2-1 shows the standardised (1980 = 100) development of real GDP, employment and population between 1980 and 2006.
• Real GDP grew with a relatively constant rate over the whole time period.
• In contrast, employment decreased in the 1980s and only returned to the level of 1980 at the end of the 1990s. Employment then developed well, with an average growth rate of 2.2% p.a. between 1997 and 2001. Afterwards, there was practically no increase in employment, indicating that the GDP growth since 2000 was mostly driven by productivity gains and not by employment growth (so-called “jobless growth”).
• The BMR’s population developed very cautiously. Between 1980 and the mid-1990s, there was just a horizontal development. Thereafter, population grew at a constant, but low, rate (on average 0.7% p.a. between 1995 and 2006).
• The stagnation of employment since 2000 combined with substantial growth in both real GDP and in population indicates that the GDP growth was mostly driven by growth in productivity and not by an expansion of employment. Consequently, the im-pact of this development on the unemployment rate was rather negative.
Figure 2-2 Growth of real GDP, Employment and Population, Brussels Capital Region
80 90 100 110 120 130 140 150 160 Real GDP Po pulatio n Employment
Note: growth rates p.a., in USD at 2000 prices and 1997 PPP
Source: BAK Basel Economics
• If the development in the BMR is split up into the development in each of its sub-regions, one can see that all the indicators performed far weaker in the Brussels Capital Region than in the BMR. Even though employment has grown consistently since the mid-1990s, it has not yet reached the level of 1980.
Figure 2-3 Growth of real GDP, Employment and Population, Brabant Walloon and Halle-Vilvoorde
90 100 110 120 130 140 150 160 170 180 190 200 210 220 230 240 250 260 270 Real GDP Po pulation Emplo yment
Note: growth rates p.a., in USD at 2000 prices and 1997 PPP
Source: BAK Basel Economics
• The growth in GDP, employment and population was much more substantial in the sub-regions and Halle-Vilvoorde than in the Brussels Capital Region. Therefore, Bra-bant Walloonand Halle-Vilvoorde provided very important impulses for the economy of the BMR even though their share of the economy of the BMR is smaller than that of the core city.
• The stagnation in employment after 2001 in these two sub-regions indicates that the growth in GDP since then was also a “jobless growth”.
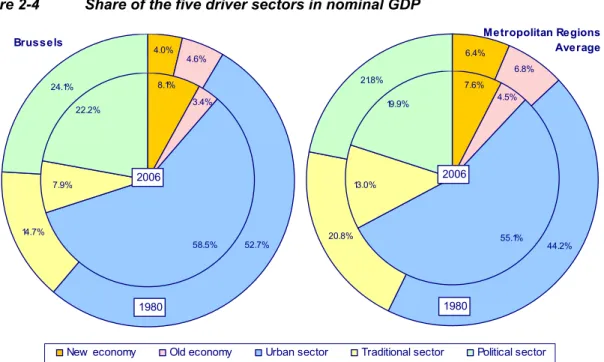
Figure 2-4 Share of the five driver sectors in nominal GDP 20.8% 44.2% 6.8% 6.4% 21.8%
New economy Old economy Urban sector Traditional sector Political sector
1980 Metropolitan Regions Average 24.1% 4.0% 4.6% 52.7% 14.7% 1980 Brussels 13.0% 55.1% 4.5% 7.6% 19.9% 2006 22.2% 8.1% 3.4% 58.5% 7.9% 2006
Note: in %,based on USD at current prices and exchange rates
Source: BAK Basel Economics
• Fig. 2-4 shows the share of the five driver sectors in nominal GDP in 2006 (inner cir-cle) and 1980 (outer circir-cle) for the BMR and for the Metro Average (average of the aggregate of the most important European Metropolitan Regions). For a description of BAK’s concept of the driver sectors, please see the Appendix.
• Because the BMR is a metropolitan region and is also the capital of Belgium, the dominance of the urban and the political sectors as well as the substandard presence of the old economy and the traditional sector are no surprise.
• The comparison between the two time points reveals that the importance of the urban sector and the new economy grew over time; the new economy even doubled its share of GDP. On the other side, the traditional sector’s importance was cut in half between 1980 and 2006.
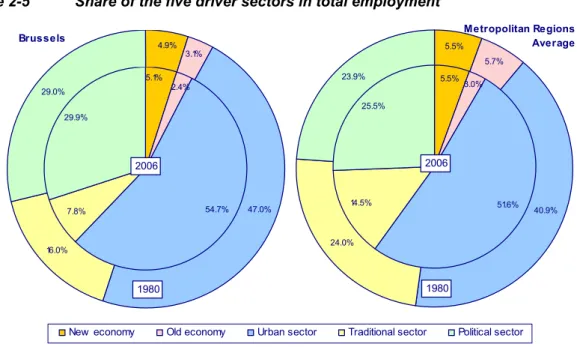
• Note the substantially stronger increase of the new economy in the BMR as com-pared to the Metro Average. While in 1980 its share in the BMR was significantly be-low the share found in the Metro Average, today it surpasses the Metro Average by a clear margin. Interestingly, this pattern cannot be seen when looking at employment shares (fig. 2-5). Here, no change of shares can be observed over time, neither in the BMR nor in the Metro Average. Consequently, while in both regions the labour
pro-Figure 2-5 Share of the five driver sectors in total employment 24.0% 40.9% 5.7% 5.5% 23.9%
New economy Old economy Urban sector Traditional sector Political sector 1980 Metropolitan Regions Average 29.0% 4.9% 3.1% 47.0% 16.0% 1980 Brussels 14.5% 51.6% 3.0% 5.5% 25.5% 2006 29.9% 5.1% 2.4% 54.7% 7.8% 2006 Note: in %
Source: BAK Basel Economics
• The dominance of the urban and the political sectors is even more substantial when comparing the share of total employment.
• The growth of the new economy concerning its share of nominal GDP (seen in Fig. 2-4) had no significant impact on its share of total employment.
• Concerning the development of the traditional sector, one can see that the decrease of its share of employment was more substantial in relative terms than the decrease in the Metro Average.
The following analysis of the structure of the driver sectors is done by means of so-called “bubble charts.” Later, the same principle is used in order to analyse the industrial structure. Because this is a central tool of the analysis, we will take a closer look at the underlying con-cept of these charts.
Interpretation example for a growth contribution “bubble chart”:
The contribution of a sector (industry, firm, region, etc.) to the growth of an economy (sector, region, country, etc.) depends on its weight within the total (share) and on its growth rates. A large contribution to economic growth can be due to a high share and moderate growth or a smaller share but more dynamic development.
Figures like the ones following do provide all this information. Here, they focus on the contribution of the driver sectors and the key industries to GDP growth of a region. The x-axis holds information on the share (in percent). The y-axis reflects the average annual growth (in percentage points). Therefore, the growth contribution of a driver sector or a key industry increases when moving from the lower left corner towards the right and/or upwards. As the relationship is nonlinear, the growth contribution is also given in the graph: the size of the bubbles reflects the growth contribution. Negative contributions are marked with grey bubbles.
For example, consider the Political Sector in the BMR. It made up 22 percent of the economy in 1995. From 1995 to 2006, it increased on average more than 2 percent a year. Combining these, the Political Sector contributed 0.45 percentage points to the growth of the BMR economy annually. Or in other words, had the Political Sector in the BMR just not existed, annual economic growth would have been ½ of a percentage point lower.
Figure 2-6 The BMR’s five driver sectors 1980-2000, 2000-2006 -2% 0% 2% 4% 6% 8% 0% 5% 10% 15% 20% 25% 30% 35% 40% 45% 50% 55% 60%
Average share in nom. GDP
G row th of r eal G V A p. a. Traditional Industries
italics: negative contribution to growth
New Economy Old Economy Political Sector Urban Sector Contribution 5 driver sectors 1980-2006 2% 0.75% 0.3% 1.2%
Note: in %,based on USD at 2000 prices and 1997 PPP
Source: BAK Basel Economics
• Unfortunately, the urban sector, the most important of all the sectors, lost some drive in the period 2000-2006 when compared to the period 1980-2000. As its share of GDP is very high, this sector still remains by far the most important contributor to GDP growth (0.95 percentage points which adds up to 46% of the GDP growth).
• Otherwise, the development of the new economy provides very good news to the BMR. The growth rate of this sector accelerated in 2000-2006 when compared to the period before and added up to 6.1% on average. Even if its share of GDP is still rather small, its contribution to GDP growth was the same as that of the much bigger political sector and about half of that of the urban sector.
• Furthermore, fig. 2-6 provides some evidence of a downturn in the old economy and the regaining of a respectable amount of force in the traditional sector.
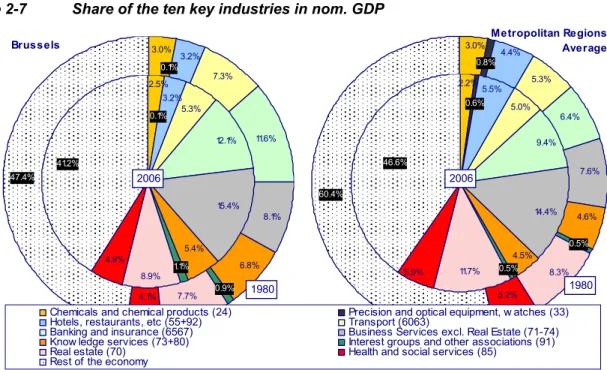
Figure 2-7 Share of the ten key industries in nom. GDP 47.4% 7.7% 6.8% 8.1% 4.1% 0.9% 7.3% 3.2% 0.1% 3.0% 11.6% Brussels 1980 4.6% 0.5% 8.3% 5.2% 6.4% 3.0% 0.8%4.4% 5.3% 7.6% 60.4%
Chemicals and chemical products (24) Precision and optical equipment, w atches (33) Hotels, restaurants, etc (55+92) Transport (6063)
Banking and insurance (6567) Business Services excl. Real Estate (71-74) Know ledge services (73+80) Interest groups and other associations (91) Real estate (70) Health and social services (85)
Rest of the economy
1980 Metropolitan Regions Average 41.2% 4.9% 8.9% 1.1% 5.4% 15.4% 12.1% 2.5% 0.1% 3.2% 5.3% 2006 46.6% 9.4% 2.2% 0.6% 5.5% 5.0% 14.4% 4.5% 0.5% 11.7% 5.9% 2006
Note: in %,based on USD at current prices and exchange rates
Source: BAK Basel Economics
• Fig. 2-7 shows the share of the ten key industries in GDP in 1980 and 2006 for the BMR and the Metro Average.
• In both time periods, these industries count for a larger and more important part of the aggregate economy in the BMR than in the Metro Average. On the level of individual industries, banking and insurance occupies a larger share of the aggregate economy in the BMR than in the Metro Average. Whereas, the BMR’s most significant lag be-hind the average can be detected in its share of hotels, restaurants and tourism.
• It is very interesting to observe that the share of GDP of the ten key industries did not increase much in the BMR. Already in 1980, the key industries were of major concern in the BMR. This is different for the Metro Average, where quite a significant rise in the share of GDP of these industries took place between 1980 and 2006.
Figure 2-8 The BMR’s ten key industries 1980-2000, 2000-2006 -4% -2% 0% 2% 4% 6% 8% 10% 12% 14% 0% 2% 4% 6% 8% 10% 12% 14% 16% 18% 20% 22% 24%
Average share in nom. GDP
G row th of r eal G V A p. a. Contribution to GDP growth 1980-2006 1% 0.3% 0.1% 0.6%
Business services excl. real estate
Banking and insurance
Real estate
Transport Know ledge services
Hotels, restaurants, etc Health and social services Chemicals and chemical products Precision and optical equipment, w atches
Interest groups and other ass.
Note: in %,based on USD at 2000 prices and 1997 PPP
Source: BAK Basel Economics
• The bubble chart reveals that most of the BMR’s key industries performed much less dynamically in the period 2000-2006 than in the previous period.
• One of the most painful decreases took place in business services which, in the most recent period, was no longer the industry with the highest contribution to GDP growth. The leading position was lost to the financial services which lost some drive as well but much less pronounced.
• Another striking finding is the development in transport and tourism. In these two in-dustries the growth rate sharply decreased between the two periods and became sig-nificantly negative in the latter period.
3 Brussels Metropolitan Region under the International
Benchmarking Lens
The International Benchmarking Lens
In this chapter, the performance of the main economic indicators as well as the performance and the importance of the key industries of the BMR are compared to a set of European Met-ropolitan Regions, the benchmark regions.
3.1 Economic Performance Figure 3-1 Population 2006 0 1'000 2'000 3'000 4'000 5'000 6'000 7'000 8'000 9'000 10'000 11'000 12'000 Note: in 1'000
Source: BAK Basel Economics
• Fig. 3-1 gives an idea of the size of the benchmark regions. The ranking reveals the wide disparity between the largest and the smallest regions. The BMR lies some-where in the middle, but clearly belongs to the smaller regions in this benchmarking.
• Because of this size disparity, we will most often use relative indicators in the analysis that don’t depend on the size of a region. Nevertheless, for the interpretation of some of the following results, it might be useful to keep the size of the regions in mind.
Figure 3-2 Growth of population 1995-2000, 2000-2006 -0.6% -0.4% -0.2% 0.0% 0.2% 0.4% 0.6% 0.8% 1.0% 1.2% 1.4% 1.6% 1.8% 2.0% 2.2% 1995-2000 2000-2006 1995-2006
Note: growth rates in % p.a.
Source: BAK Basel Economics
• Fig. 3-2 shows the development of the population for the three periods 1995-2000 (dark blue pillar), 2000-2006 (light blue pillar), and 1995-2006 (red bar).
• While the BMR belonged to the regions with a weaker population development be-tween 1995 and 2000, more recently, there seems to have been a break through. Be-tween 2000 and 2006, the BMR was among the strongest regions, although the growth rate didn’t reach a particularly high level (0.9% p.a.) and couldn’t keep up with the most dynamic regions, Madrid and Dublin.
• Actually, when taking a longer perspective, the success of the BMR with respect to attracting population since 2000 is even more pronounced. From 1980 to 2000, the BMR was in fact amongst the weakest performing regions (just in front of the even weaker Edinburgh, Vienna and Milan).
Figure 3-3 Growth of real GDP 1995-2000, 2000-2006 -1% 0% 1% 2% 3% 4% 5% 6% 7% 8% 9% 1995-2000 2000-2006 1995-2006
Note: growth rates in % p.a., in USD at 2000 prices and 1997 PPP
Source: BAK Basel Economics
• Concerning the growth rate of GDP, the BMR is placed in the middle of the field. The growth rates reached a respectable level, but the gap to the most dynamic city re-gions is considerable. Still, especially in the later period, the BMR outpaced other leading regions such as Paris, Milan, Zurich and Berlin.
• The analysis reveals that the GDP growth in the BMR was much higher between 1995 and 2000 than in the most recent period. As the benchmarking shows, this loss of vitality can be seen in most of the other city regions as well and is closely linked to the overall recession at the beginning of this decade. So it is not a specific BMR fail-ure and should not be taken too critically.
Figure 3-4 Nominal GDP per capita in 2006 0 5'000 10'000 15'000 20'000 25'000 30'000 35'000 40'000 45'000 50'000 55'000 60'000 65'000 70'000 75'000 80'000
Note: in USD PPP 1997, current prices
Source: BAK Basel Economics
• Although based on production instead of income, for most countries and regions, nominal GDP per capita is a good measure of the wealth of the regions. Other indica-tors are often statistically less well-supported and therefore inferior. Within the sample of benchmark regions, it is especially Dublin (wealth overestimated) and Zürich (wealth underestimated) where production, measured with GDP per capital, and in-come do not correspond well. Note that GDP per capita does not provide any infor-mation on the distribution of the wealth of a region among the region and its inhabi-tants.
• The comparison of the GDP per capita for 2006 reveals the strength of the BMR. The level of generated value added in relative terms is just surpassed by Luxembourg with its very productive financial sector. Even London and Zurich, generally known as cities with a high ratio of GDP per capita, are placed behind the BMR.
• When comparing GDP per capita there could be a bias. While GDP is a production based concept, capita follows the concept of place of residence. A large number of net commuters increases the GDP per capita level in a region. As long as one is com-paring city regions – as is done in this benchmarking – the bias should not be too large: all regions are defined to cover the complete metropolitan areas, which already reduces net commuting substantially. Furthermore, all metropolitan regions used here do profit from some net commuting. Therefore, comparing them should not be largely biased with a few exceptions where the definition of the regions is known to be too narrow: Luxembourg, Vienna and Berlin are expected to be upward biased compared to the other regions with respect to GDP per capita levels.
Figure 3-5 Growth of real GDP per capita 1995-2000, 2000-2006 -2% -1% 0% 1% 2% 3% 4% 5% 6% 7% 8% 1995-2000 2000-2006 1995-2006
Note: growth rates in % p.a., in USD at 2000 prices and 1997 PPP
Source: BAK Basel Economics
• Similar to the development of the population and the GDP, the growth of the GDP per capita in the BMR is placed in the middle range of the benchmarking.
• This finding indicates that the high level of GDP per capita in 2006 in the BMR is not primarily a result of the explosive development of the GDP per capita in recent years. The comparison of the GDP per capita for the year 1990 (not shown in the chart) in-deed reveals that already in 1990 the BMR was ranked third best in the benchmark-ing.
Figure 3-6 Growth of employment 1995-2000, 2000-2006 -2% -1% 0% 1% 2% 3% 4% 5% 6% 7% 1995-2000 2000-2006 1995-2006
Note: growth rates in % p.a.
Source: BAK Basel Economics
• The analysis now turns to employment. Due to the different sizes of the regions, only employment growth can be compared. Because the employment data is based on the place of work, the development can be analysed in relation to GDP.
• The overall picture of the development of employment is much less homogeneous over the time periods than, for example, the development of the population. Since this is due to cyclical reasons, in general, we can see a larger expansion in the boom pe-riod at the end of the 1990s than at the beginning of the present decade.
• It has to be mentioned that the BMR never belonged to the leading regions of em-ployment growth. However, in contrast to other regions, there has never been a re-duction in employment in the BMR either.
• Unfortunately, the decline in employment growth between the two periods 1995-2000 and 2000-2006 has been more significant in the BMR than in other regions, so that the BMR slipped closer to the end of the ranking in the most recent period.
• Such a pattern was not observed for GDP growth; the BMR actually ranks slightly better in GDP growth in 2000-2006 than in 1995-2000. Therefore, here again, we find a sign of jobless growth in the BMR from 2001 on, something not observed to the same extent in the other benchmark regions. Of course, the differences between the regions are far from extreme and should not be overly interpreted.
• And finally, the red bar indicates that the employment growth in the BMR performed very similarly to that in the Metro Average during the whole period 1995-2006.
Figure 3-7 Growth of real GDP and employment 1995-2006 p.a Brussels Paris London Berlin Frankfurt Milan Randstad Vienna Dublin Stokholm Lyon Madrid Zürich Edinburgh Luxembourg MEAV -1.0 -0.5 0.0 0.5 1.0 1.5 2.0 2.5 3.0 3.5 4.0 4.5 5.0 5.5 6.0 6.5 7.0 -0.5 0.0 0.5 1.0 1.5 2.0 2.5 3.0 3.5 4.0 4.5
Growth of employment 1995-2006 p.a
Gr o w th of r e al GDP 1 9 9 5 -2 00 6 p. a .
Note: GDPbased on USD at 2000 prices and 1997 PP
Source: BAK Basel Economics
• Fig. 3-7 combines the growth in real GDP and the growth in employment. Three main groups of regions can be identified: the leading regions with high growth rates in both indicators (Dublin, Luxembourg and Madrid), the regions with a high growth rate in GDP but with a more moderate growth rate in employment (London and Stockholm), and the regions with more moderate but still remarkable growth rates in both indica-tors (all the other regions apart from Berlin).
• Within this last group, the BMR clearly belongs to the leaders. Furthermore, its posi-tion close to the trend line indicates that the relaposi-tion between GDP and employment growth is very similar to the average found in the benchmarking.
Productivity:
Two measures of productivity are usually used in economic analyses: hourly productivity and employment productivity. Hourly productivity is defined as output per hour of labour input in the economy. Employment productivity is the output per employee (including the self-employed). Output is measured as GDP or value added.
Although basically providing the same information, the measures can differ from one another. Reasons for differences are especially found in the usual hours worked and the part-time employment structures. Other issues like overtime, holidays, average sick leave duration and similar issues influence the results as well. The differences can be observed in the levels as well as in the dynamics of the indicators.
Neither of the indicators can be regarded as the superior one. Depending on the question asked, one can be more suited to the analysis than the other. For many economic questions analysing differences in the economic development, hourly productivity is regarded as more precise because it is not influenced by labour market issues like part-time structures. However, data availability is often better for employment productivity. Furthermore, employment productivity does more directly fit into one analysis with figures like GDP per capita or the number of jobs.
Figure 3-8 Nominal employment productivity 2006
0 20 40 60 80 100 120
Note: in USD PPP 1997, current prices
Source: BAK Basel Economics
• Next, we will have a look at productivity. Employment productivity is an indicator of the efficiency of the economy as well as its capital intensity and industry mix.
• The benchmark of the employment productivity points out the leading position of the BMR within a group of some of the most competitive European city regions.
• The good position of the BMR confirms the results derived with GDP per capita that the BMR is quite a rich region in this benchmarking sample. The productivity indicates that this earlier finding is not biased due to specific commuting structures in the BMR.
Figure 3-9 Nominal hourly productivity in regions (large pillar) and corresponding coun-tries (small pillar) 2006
0 10 20 30 40 50 60 70 80 90 100 0 10 20 30 40 50 60 70 80 90 100
Note: in USD PPP 1997, current prices
Source: BAK Basel Economics
• A comparison of employment productivity is influenced by differences in working hours (due to different weekly hours, different yearly working days, and part-time working structures). We want to compare the efficiency of the use of labour input, so we turn to hourly productivity.
• The levels of nominal output per working hour in the benchmarking regions and the corresponding countries in 2006 are compared.
• When comparing hourly productivity, the judgement for the BMR gets even better than when comparing employment productivity. The hourly productivity in the BMR is by far higher than in any of the other benchmark regions.
• Furthermore, fig. 3-9 reveals that in general the output per hour worked is superior in the metropolitan regions than in the corresponding countries. This is particularly pro-nounced for the BMR which indicates that the high hourly productivity in the BMR cannot be explained only by a national pattern. The leading position of the BMR in the ranking of hourly productivity clearly is due to its favourable industry structure and other regional specificities.
Figure 3-10 Growth of hours worked and real hourly productivity -2% -1% 0% 1% 2% 3% 4% 5% 6% 7% 8% 9% Ho urly Productivity Ho urs worked Real GDP
Note: First pillar: 1995-2000, second pillar: 2000-2006, based on USD at 2000 prices and 1997 PPP
Source: BAK Basel Economics
• This chart divides the GDP growth into the growth of total hours worked and the growth of the hourly productivity in the two sub-periods 1995-2000 and 2000-2006.
• In most of the metropolitan regions, including the BMR, the GDP growth was realized to a large extent by means of an expansion of hourly productivity than by means of an expansion of total hours worked.
• In the BMR, the growth of hours worked was smaller in the second sub-period than in the first sub-period which is closely linked to the weaker employment growth between 2000 and 2006. Otherwise, the growth of the hourly productivity was stronger in the second than in the first sub-period (1.9% vs. 1.5%).
Summing up the findings from the international benchmarking of economic performance, the BMR turns out to be a rich and very productive region. GDP per capita is amongst the high-est, only beaten by Luxembourg. As its very good position in productivity proves, this is not a biased result, e.g. one due to commuting patterns or the like.
Turning to the growth performance since 1995, the BMR is not in a position as good as with respect to levels. But it is also not lagging behind: The BMR is positioned in the middle of the benchmarking sample which is, notably, a sample of rather successful regions! Given the already high level of economic performance, its growth achievements should be quite satisfy-ing to the BMR. If anythsatisfy-ing is to be mentioned critically, then it is the fact that employment is not keeping track with economic growth. Although the differences are not large, the BMR is not using the available labour input as well as other regions. As this lack of employment dy-namics has worsened in the more recent time period, it should be watched carefully in the future. It should be mentioned that the lack of employment dynamics seems not to be due to
a labour shortage, at least, not due to a general labour shortage. Unemployment is still sub-stantial and the population did grow at an increased rate in recent years.
3.2 The Driver Sectors
The previous analysis revealed a lot of information about the position and development of the BMR in an international comparison with regions facing similar situations and challenges. It showed that the BMR is doing quite well. To understand in more detail why the BMR is doing so well and to identify the stronger and weaker parts of the economy more precisely, the fol-lowing part will compare individual industries between the benchmark regions.
This will provide information on the influence of the industry mix in the BMR on the economic performance. This is important in the interpretation of the previously discussed results. If the success of a region relies on its advantageous industry mix only, but these industries are not doing better than their international competitors and are losing competitiveness, then regard-less of the overall good performance of the region, this reveals the dangers to future devel-opment. An industry specific analysis can reveal such a pattern.
Before starting with the analysis of the key industries, we first focus on the five driver sectors. The order of the analysis is oriented towards the share of the sector/industry in GDP, starting with the most important one.
In the end, we will also analyse the trade and repair services as well as the postal and tele-communication services, two industries which do not belong to the key industries but are still of significant importance for the economy of the BMR.
The focus lies on the analysis of the gross value added. For some of the industries that are crucial for the development of the labour market, the analysis is performed for the employ-ment as well.
Figure 3-11 Urban Sector: Contribution to real GDP growth 1995-2006 Brussels Paris London Berlin Frankfurt Milan Randstad Vienna Dublin Stokholm Lyon Madrid Zürich Edinburgh Luxembourg MEAV -1% 0% 1% 2% 3% 4% 5% 6% 7% 8% 9% 44% 46% 48% 50% 52% 54% 56% 58% 60% 62% 64% 66% 68%
Average share in nom. GDP 1995-2006
G row th of r e al G V A 1995-2006 p. a. 3% 2% 1% 0.5% Contribution to GDP growth 1995-2006
italics: negative contribution to growth
Note: based on USD at 2000 prices and 1997 PPP
Source: BAK Basel Economics
• The benchmarking shows the importance of the urban sector for the economy in the BMR. Even among the set of city regions there are just few regions with a higher share of this sector.
• In addition, the wide range of the share of the urban sector in the benchmark regions reveals that there are city regions that don’t have such a distinct focus on this sector.
• Although the urban sector is of great importance to the BMR, its contribution to the GDP growth lies clearly below average. This is due to a relatively weak growth rate between 1995 and 2006. Within the benchmarking, there are just four regions with a weaker progression.
• In total, the contribution of the urban sector to the GDP growth in the BMR between 1995 and 2006 is 1.2 percentage points which makes up about 45% of the growth of the whole economy.
• Because the urban sector consists of a large set of industries, the following analysis of the key industries will shed more light on the question of why this sector didn’t per-form better.
• Nevertheless, a general conclusion can be drawn from the analysis of this driver sec-tor. The urban sector is very important for the BMR, but it did not grow as much as it could have grown. The urban sector of city regions with a similar starting position to the BMR performed better than the BMR’s urban sector. Their superior performance proves there is abundant, but as yet unrealized, potential for growth in the urban sec-tor in the BMR.
Figure 3-12 Urban sector: Contribution to employment growth 1995-2006 Brussels Paris London Berlin Frankfurt Milan Randstad Vienna Dublin Stokholm Lyon Madrid Zürich Edinburgh Luxembourg MEAV 0% 1% 2% 3% 4% 5% 40% 42% 44% 46% 48% 50% 52% 54% 56% 58% 60% 62% 64%
Average share in total employment 1995-2006
G row th of em pl o y m e nt 1995-2006 p. a. 3% 2% 1% 0.5% Contribution to employment growth 95-06 Note: in % p.a.
Source: BAK Basel Economics
• As fig. 3-12 shows, the majority of the labour force of the BMR is employed in the ur-ban sector. London is the only benchmark region where the share of the urur-ban sector in total employment is significantly higher than in the BMR.
• But, similar to the growth of GVA, the growth of employment was clearly below aver-age in the BMR. This indicates a lack of momentum of this sector in the labour market and, therefore, is one important reason for the rather weak overall employment growth in the BMR.
Figure 3-13 Political Sector: Contribution to real GDP growth 1995-2006 Brussels Paris London Berlin Frankfurt Milan Randstad Vienna Dublin Stokholm Lyon Madrid Zürich Edinburgh Luxembourg MEAV -1% 0% 1% 2% 3% 4% 5% 11% 12% 13% 14% 15% 16% 17% 18% 19% 20% 21% 22% 23% 24% 25% 26% 27%
Average share in nom. GDP 1995-2006
G row th of r e al G V A 1995-2006 p. a. Contribution to GDP growth 1995-2006 1% 0.3% 0.1% 0.6%
italics: negative contribution to growth
Note: based on USD at 2000 prices and 1997 PPP
Source: BAK Basel Economics
• Even if the weight is much smaller than that of the urban sector, the political sector nonetheless plays an important role in most of the benchmark regions. Given that the political sector usually is not an innovative nor highly productive sector – because the production is labour intensive – it is characterized by small or even negative growth rates. And this is what the bubble chart depicts. In most of the regions, the growth rate of the political sector lies below two percent, and, therefore, in most cases, lies significantly below the average growth rate of the economy.
• Furthermore, it is shown that the share of the political sector in total GDP in the BMR as well as its growth rate are above the benchmark average for 1995-2006, meaning that the contribution of this sector to the GDP growth is above average as well.
• For most regions, having a large political sector is, in terms of economic growth, not particularly good news. For the BMR, it is, at least, not particularly bad news (contri-bution of 0.45 percentage points which makes up 1/6 of the whole economy’s growth).
Figure 3-14 New Economy: Contribution to real GDP growth 1995-2006 Brussels Paris London Berlin Frankfurt Milan Randstad Vienna Dublin Stokholm Lyon Madrid Zürich Edinburgh Luxembourg MEAV 1% 3% 5% 7% 9% 11% 13% 15% 17% 19% 4% 5% 6% 7% 8% 9% 10% 11% 12%
Average share in nom. GDP 1995-2006
G row th of r e al G V A 1995-2006 p. a. Contribution to GDP growth 1995-2006 2% 0.75% 0.3% 1.2%
Note: based on USD at 2000 prices and 1997 PPP
Source: BAK Basel Economics
• The new economy sector consists mostly of very innovative industries which feature high growth rates. As the name of this sector already indicates, it is generally a rather young sector which does not, therefore, make up a major part of the overall economy. Still, due to its dynamism and future growth potential, this sector could be important for a region’s development.
• Not very weighty but very dynamic – this fits quite well for the new economy sector in the BMR. It is particularly impressive to see that there are only two regions in which the new economy sector really expanded more dynamically than in the BMR.
• For the BMR, it is a precious asset to possess such a powerful new economy sector. Between 1995 and 2006, this sector contributed 0.6 percentage points to the whole GDP growth, more than the much weightier political sector did. Furthermore, if this sector continues to grow as it has recently, its importance will steadily augment as will its contribution to GDP growth.
• The more detailed analysis reveals that the growth was mainly driven by postal and telecommunication services which grew by 9.7% p.a. in real terms between 1995 and 2006.
Figure 3-15 Traditional Sector: Contribution to real GDP growth 1995-2006 Brussels Paris London Berlin Frankfurt Milan Randstad Vienna Dublin Stokholm Lyon Madrid Zürich Edinburgh Luxembourg MEAV -5% -4% -3% -2% -1% 0% 1% 2% 3% 4% 8% 9% 10% 11% 12% 13% 14% 15% 16% 17% 18% 19% 20% 21%
Average share in nom. GDP 1995-2006
G row th of r e al G V A 1995-2006 p. a. Contribution to GDP growth 1995-2006 1% 0.3% 0.1% 0.6%
italics: negative contribution to growth
Note: based on USD at 2000 prices and 1997 PPP
Source: BAK Basel Economics
• The traditional sector presents itself quite heterogeneously over the benchmarking. In some regions, it plays an important role, while in other regions, the traditional sector is rather negligible (depending on its growth performance, this can be both positive or negative).
• Generally, the traditional sector is characterized by radical structural adaptation which means that, on average, the growth performance of this sector often is neutral or even negative. Because we expect this general trend of such a labour intensive and less innovative sector to continue, it is more of an advantage than a disadvantage for the BMR that the share of the traditional sector in GDP is the smallest of all the benchmark regions.
• The small but positive contribution to GDP growth signifies that the structural adapta-tions in the traditional sector took place in a less dramatic way in the BMR than in some of the benchmark regions where the contribution to GDP growth was clearly negative between 1995 and 2006.
• In addition, the analysis of the sub-periods 1995-2000 and 2000-2006 reveals that there was a rupture between 1995 and 2006. While the growth rate of the traditional sector was negative in 1995-2000 (-1.4%), in 2000-2006 the growth rate was positive (+1.7%). This indicates that, contrary to many other regions, the traditional sector of the BMR achieved a veritable turnaround.
Figure 3-16 Old Economy: Contribution to real GDP growth 1995-2006 Brussels Paris London Berlin Frankfurt Milan Randstad Vienna Dublin Stokholm Lyon Madrid Zürich Edinburgh Luxembourg MEAV -4% -2% 0% 2% 4% 6% 8% 10% 12% 14% 0% 1% 2% 3% 4% 5% 6% 7% 8% 9% 10%
Average share in nom. GDP 1995-2006
G row th of r e al G V A 1995-2006 p. a. Contribution to GDP growth 1995-2006 2% 0.75% 0.3% 1.2%
italics: negative contribution to growth
Note: based on USD at 2000 prices and 1997 PPP
Source: BAK Basel Economics
• Except for a few cases in the benchmarking, the old economy sector doesn’t play an important role in the economies of most of today’s city regions. This also holds true for the BMR.
• It is important to notice that this is partly due to the selection of benchmarking re-gions. While the largest metropolitan regions do not generally focus on this part of the economy, it is the focus for a number of successful regions in the second row the driver of growth (examples are: Stuttgart, Gothenburg or Basel).
• Fortunately, the old economy in the BMR is very well positioned as seen by the clearly above-average growth rate of this sector.
• Comparing the old economy sector to the other sectors reveals that, in terms of growth rates, only the new economy sector performed better in the BMR.
• As a consequence, the BMR gets substantially more impulses from this industrial sector than most of the other benchmark regions.
• Although growth was good, it is obvious that the BMR does not rely on the old econ-omy. The share is far too small. The old economy is a successful niche for the BMR but not its main driver of economic success.
3.3 The BMR’s Key Industries
Figure 3-17 Business services excluding real estate: Contribution to real GDP growth 1995-2006
Brussels Paris London Berlin Frankfurt Milan Randstad Vienna Dublin Stokholm Lyon Madrid Zürich Edinburgh Luxembourg MEAV 0% 2% 4% 6% 8% 10% 7% 8% 9% 10% 11% 12% 13% 14% 15% 16% 17% 18% 19% 20%
Average share in nom. GDP 1995-2006
G row th of r eal G V A 1995-20 06 p. a. Contribution to GDP growth 1995-2006 2% 0.75% 0.3% 1.2%
Note: based on USD at 2000 prices and 1997 PPP
Source: BAK Basel Economics
• The industry aggregate business services excluding real estate is the most important key industry, when ranked in terms of the share in GDP in 2006. Basically this key in-dustry covers the following four 2-digit industries: leasing of movables without operat-ing personnel (NACE 71), IT services (NACE 72), research and development (NACE 73) and commercial services (NACE 74).
• As in other metropolitan regions, in the BMR in 2006 by far the most important of these four industries were the commercial services. The leasing of movables and the IT services have about the same weight and the importance of research and devel-opment is very small for the whole key industry.
• The benchmarking brings out the enormous variation of the importance of the busi-ness services in the regions, the range goes from 7.5% up to almost 20%.
• As fig. 3-17 depicts, there is just the Paris region where business services clearly make up a more important part of the whole economy than in the BMR.
• On the growth-side, the analysis reveals that even though the BMR’s growth rate reaches a considerably high level of 4%, it is unfortunately still lagging behind. Since this rate is much higher than the overall growth rate of the urban sector (2.1%) and since the most important part of the business services belong to the urban sector, the below average performance of the urban sector is not due to underperformance of the business services. In total, the contribution of this key industry to GDP growth
constitutes 0.6 percentage points which are more than 20% and a remarkable amount for a single key industry.
• Nevertheless, it has to be pointed out that there are just three regions where the busi-ness services perform significantly worse. While the BMR is in the middle group, seven regions are growing substantially faster. As the next figure shows, this is partly due to a lack of employment productivity. Relative to other regions, the employment grew faster than the value added, indicating that the growth in employment productiv-ity in the BMR was inferior to that in the other benchmark regions.
Figure 3-18 Business services excl. real estate:
Contribution to employment growth 1995-2006
Brussels Paris London Berlin Frankfurt Milan Randstad Vienna Dublin Stokholm Lyon Madrid Zürich Edinburgh Luxembourg MEAV 2% 3% 4% 5% 6% 7% 8% 9% 10% 10% 11% 12% 13% 14% 15% 16% 17% 18% 19% 20%
Average share in total employment 1995-2006
G row th of em pl o y m e nt 1995-2006 p. a. Contribution to employment growth 95-06 2% 0.75% 0.3% 1.2% Note: in % p.a.
Source: BAK Basel Economics
• Even if the growth in employment wasn’t very high compared to the benchmark re-gions, the business services still provided important impulses to the labour market of the BMR. The growth rate added up to 3.7% between 1995 and 2006. This clearly lies above the average growth rate of the aggregate economy (1.1%) and above the growth rate of the urban sector (1.2%) as well.
Figure 3-19 Banking and insurance: Contribution to real GDP growth 1995-2006 Brussels Paris London Berlin Frankfurt Milan Randstad Vienna Dublin Stokholm Lyon Madrid Zürich Edinburgh Luxembourg MEAV -4% -2% 0% 2% 4% 6% 8% 10% 12% 4% 6% 8% 10% 12% 14% 16% 18% 20% 22% 24% 26%
Average share in nom. GDP 1995-2006
G row th of r e al G V A 1995-2006 p. a. Contribution to GDP growth 1995-2006 2% 0.75% 0.3% 1.2%
italics: negative contribution to growth
Note: based on USD at 2000 prices and 1997 PPP
Source: BAK Basel Economics
• The bubble chart showing the development and the weight of the financial services (NACE 65-67) points out the importance of this industry for the BMR. Obviously, the financial services in the BMR don’t reach the relative importance as in the two well known financial centres Zurich or Luxembourg. But interestingly, the BMR is not lo-cated that far behind London and even well in front of the German financial centre Frankfurt.
• Looking at the growth rate, the story is quite good for the BMR as well: The financial services of the BMR are one of the best performing among all the benchmark re-gions! Between 1995 and 2006 the dynamism of this key industry was superior to that of Zurich, Luxembourg and Frankfurt.
• The combination of high share in GDP and dynamic growth is reflected in the contri-bution to GDP growth which is 0.7 percentage points and, therefore, surpasses the contribution of the business services. According to the contribution to GDP growth, the financial services are the most important key industry in the BMR.
• This finding reveals that the performance of the financial services is one of the main drivers of the success of the BMR. Therefore, it must be a crucial issue for the rele-vant actors of the BMR to ensure business conditions that allow a further strengthen-ing of the competitive positionstrengthen-ing of the financial services. One very important aspect is the availability of highly qualified manpower which, at the moment, seems to be guaranteed, as the analysis in the next chapter will reveal.
Figure 3-20 Banking and insurance: Contribution to employment growth 1995-2006 Brussels Paris London Berlin Frankfurt Milan Randstad Vienna Dublin Stokholm Lyon Madrid Zürich Edinburgh Luxembourg MEAV -3% -2% -1% 0% 1% 2% 3% 4% 5% 2% 3% 4% 5% 6% 7% 8% 9% 10% 11%
Average share in total employment 1995-2006
G row th of em pl o y m e nt 1995-2006 p. a. Contribution to employment growth 95-06 1% 0.3% 0.1% 0.6%
italics: negative contribution to growth
Note: in % p.a.
Source: BAK Basel Economics
• Fig. 3-20 shows that the importance of the financial services is far smaller for the la-bour market than it is for the generation of value added (7.3% of the share in total employment compared to 12.5% of the share of GDP).
• While the growth in employment was about the same as in other regions with a spe-cific focus on financial services, this growth in employment was too small to provide significant impulses to the labour market.
• The combination of the dynamic growth in GVA with the negligible growth in employ-ment indicates the substantial productivity growth that has been realized in this key industry.
Figure 3-21 Real estate: Contribution to real GDP growth 1995-2006 Brussels Paris London Berlin Frankfurt Milan Randstad Vienna Dublin Stokholm Lyon Madrid Zürich Edinburgh Luxembourg MEAV -3% -1% 1% 3% 5% 7% 9% 11% 13% 0% 2% 4% 6% 8% 10% 12% 14% 16% 18% 20%
Average share in nom. GDP 1995-2006
G row th of r e al G V A 1995-2006 p. a. Contribution to GDP growth 1995-2006 1% 0.3% 0.1% 0.6%
italics: negative contribution to growth
Note: based on USD at 2000 prices and 1997 PPP
Source: BAK Basel Economics
• The third largest of the key industries is real estate (NACE 70). Before going into the analysis of this industry, a few remarks are necessary. This industry does not only in-clude the ‘commercial services’ side of real estate (real estate brokerage, facility management) and the commercial investment in real estate, but also private renting. As the latter is the most important part with respect to gross value added, societal preferences like home ownership rates and the organisation of private renting mar-kets heavily influence the industries share and development. Furthermore, although there are international standards for deriving the statistics on real estate, some doubts remain if private renting is indeed covered to a comparable extent internation-ally. When interpreting the results, this should be kept in mind.
• The reason why the contribution to GDP-growth of this industry is just 0.1 percentage point definitely is an outcome of a lack of dynamism. On average, the growth rate in the period under consideration was just 1.3%, clearly below the performance of most of the benchmark regions.
• However, the chart reveals that in most of the benchmark regions real estate cannot be considered as a major engine of growth either. There are just five regions where real estate really is an important contributor to the GDP-growth.