Calhoun: The NPS Institutional Archive
Theses and Dissertations Thesis Collection
2012-03
Expertise on Cognitive Workloads and Performance
During Navigation and Target Detection
Neboshynsky, Christopher M.
Monterey, California. Naval Postgraduate School
NAVAL
POSTGRADUATE
SCHOOL
MONTEREY, CALIFORNIA
THESIS
This thesis was performed at the MOVES Institute Approved for public release; distribution is unlimited
EXPERTISE ON COGNITIVE WORKLOADS AND PERFORMANCE DURING NAVIGATION AND TARGET
DETECTION
by
Christopher M. Neboshynsky March 2012
Thesis Advisor: Quinn Kennedy
Thesis Co-Advisor: Ji Hyun Yang
i
REPORT DOCUMENTATION PAGE Form Approved OMB No. 0704–0188
Public reporting burden for this collection of information is estimated to average 1 hour per response, including the time for reviewing instruction, searching existing data sources, gathering and maintaining the data needed, and completing and reviewing the collection of information. Send comments regarding this burden estimate or any other aspect of this collection of information, including suggestions for reducing this burden, to Washington headquarters Services, Directorate for Information Operations and Reports, 1215 Jefferson Davis Highway, Suite 1204, Arlington, VA 22202–4302, and to the Office of Management and Budget, Paperwork Reduction Project (0704–0188) Washington DC 20503.
1. AGENCY USE ONLY (Leave blank) 2. REPORT DATE March 2012
3. REPORT TYPE AND DATES COVERED
Master’s Thesis
4. TITLE AND SUBTITLE Expertise on Cognitive Workloads and Performance During Navigation and Target Detection
5. FUNDING NUMBERS
6. AUTHOR(S) Christopher M. Neboshynsky
7. PERFORMING ORGANIZATION NAME(S) AND ADDRESS(ES)
Naval Postgraduate School Monterey, CA 93943–5000
8. PERFORMING ORGANIZATION REPORT NUMBER
9. SPONSORING /MONITORING AGENCY NAME(S) AND ADDRESS(ES)
N/A
10. SPONSORING/MONITORING AGENCY REPORT NUMBER
11. SUPPLEMENTARY NOTES The views expressed in this thesis are those of the author and do not reflect the official policy or position of the Department of Defense or the U.S. Government. IRB Protocol number NPS.2012.0012-IR-EP6-A.
12a. DISTRIBUTION / AVAILABILITY STATEMENT Approved for public release; distribution is unlimited
12b. DISTRIBUTION CODE
A
13. ABSTRACT (maximum 200 words)
Today’s military pilots are required to perform multiple tasks simultaneously, including maintaining control of the aircraft, navigating, communicating, and detecting targets. Mental workload may affect a pilot’s ability to effectively learn to manage these tasks. Studies have shown that there are certain involuntary, physiological changes in eye gaze patterns, such as blink rate, frequency of fixations, and saccade rate that indicate increased mental workload. We hypothesize that experienced pilots, defined by total flight hours, would show more efficient eye scan patterns (higher frequency of fixations, lower dwell durations, and higher frequency of saccades per minute) during simulated tasks that required navigation and target detection and identification (tD&I). This would therefore lead to better performance in tD&I tasks.
Fourteen active duty military pilots completed three different scenarios while operating the flight controls in a helicopter flight simulator: overland navigation, tD&I while on autopilot, and tD&I while completing overland navigation. Eyetracking data were collected while the pilots completed the scenarios. Flight experience did not correlate to scan pattern or task performance. It did, however, show an interaction with cognitive workload as judged by blink rate. Results indicate that implementing eyetracking information into current aviation training programs could improve training effectiveness and efficiency.
14. SUBJECT TERMS Navigation, target detection, identification, expertise, pilot, flight, experience 15. NUMBER OF PAGES 143 16. PRICE CODE 17. SECURITY CLASSIFICATION OF REPORT Unclassified 18. SECURITY CLASSIFICATION OF THIS PAGE Unclassified 19. SECURITY CLASSIFICATION OF ABSTRACT Unclassified 20. LIMITATION OF ABSTRACT UU
NSN 7540–01–280–5500 Standard Form 298 (Rev. 2–89)
ii
iii
Approved for public release; distribution is unlimited
EXPERTISE ON COGNITIVE WORKLOADS AND PERFORMANCE DURING NAVIGATION AND TARGET DETECTION
Christopher M. Neboshynsky Lieutenant, United States Navy B.S., United States Naval Academy, 2004
Submitted in partial fulfillment of the requirements for the degree of
MASTER OF SCIENCE IN
MODELING, VIRTUAL ENVIRONMENTS, AND SIMULATION (MOVES)
from the
NAVAL POSTGRADUATE SCHOOL March 2012
Author: Christopher M. Neboshynsky
Approved by: Quinn Kennedy Thesis Advisor Ji Hyun Yang Thesis Co-Advisor Harrison Schramm Second Reader Chris Darken
iv
v
ABSTRACT
Today’s military pilots are required to perform multiple tasks simultaneously, including maintaining control of the aircraft, navigating, communicating, and detecting targets. Mental workload may affect a pilot’s ability to effectively learn to manage these tasks. Studies have shown that there are certain involuntary, physiological changes in eye gaze patterns, such as blink rate, frequency of fixations, and saccade rate that indicate increased mental workload. We hypothesize that experienced pilots, defined by total flight hours, would show more efficient eye scan patterns (higher frequency of fixations, lower dwell durations, and higher frequency of saccades per minute) during simulated tasks that required navigation and target detection and identification (tD&I). This would therefore lead to better performance in tD&I tasks.
Fourteen active duty military pilots completed three different scenarios while operating the flight controls in a helicopter flight simulator: overland navigation, tD&I while on autopilot, and tD&I while completing overland navigation. Eyetracking data were collected while the pilots completed the scenarios. Flight experience did not correlate to scan pattern or task performance. It did, however, show an interaction with cognitive workload as judged by blink rate. Results indicate that implementing eyetracking information into current aviation training programs could improve training effectiveness and efficiency.
vi
vii
TABLE OF CONTENTS
I. INTRODUCTION ... 1
A. PROBLEM STATEMENT ... 1
B. PURPOSE OF THE THESIS ... 2
C. RESEARCH QUESTIONS ... 3
D. HYPOTHESES ... 4
E. THESIS ORGANIZATION AND TABLE OF CONTENTS ... 5
II. BACKGROUND ... 7 A. INTRODUCTION ... 7 B. ASSESSMENT OF WORKLOAD ... 8 1. Performance Measures ... 8 2. Subjective Measures ... 10 a. Cooper-Harper ... 11 b. SWAT ... 11 c. NASA-TLX ... 11 3. Psychophysiological Measures ... 12 a. Brain Activity ... 12
b. Cardiac and Galvanic Skin Response ... 13
c. Eye Tracking ... 14
4. Secondary Task Measures ... 17
C. NAVIGATION ... 17
1. Confidence of Navigation ... 18
2. Navigation Methods ... 19
a. Maintenance ... 20
b. Repair ... 20
3. Navigation and Workload ... 21
III. METHODOLOGY ... 23
A. INTRODUCTION ... 23
1. Overview of the Tasks ... 23
B. PARTICIPANTS ... 25 C. EQUIPMENT ... 26 1. Hardware ... 26 a. Computers ... 26 b. Physical Setup ... 28 2. Software... 30 D. SCENARIOS ... 31 1. Practice Scenario ... 31
2. Scenario 2–Navigation without Targets ... 31
3. Scenario 3–Navigation and Target Detection and Identification ... 32
4. Scenario 4–Target Detection and Identification on Auto-Pilot ... 32
viii E. MEASURES ... 32 1. Surveys ... 32 a. Demographic ... 32 b. Pre/Post-Experiment ... 33 2. Data Collection ... 33 3. Procedure ... 34
IV. RESULTS AND DATA ANALYSIS ... 35
A. DATA PREPARATION / PRELIMINARY ANALYSIS ... 35
1. Data Preparation ... 35
a. Blink Data ... 36
b. Saccade Data ... 36
c. Fixation Data ... 36
d. Scan Pattern Data ... 37
e. Eye Scan Efficiency ... 37
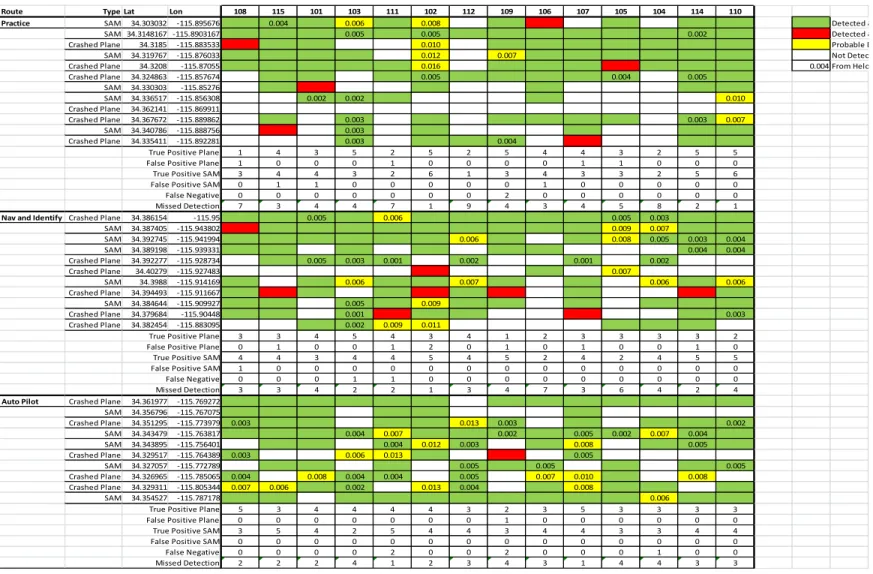
f. Target Detection Data ... 38
2. Preliminary Analysis ... 39 B. HYPOTHESIS TESTING ... 40 1. Hypothesis One ... 40 2. Hypothesis Two ... 44 a. Navigation ... 44 b. Target Detection ... 45 3. Hypothesis 3 ... 45
V. DISCUSSION, CONCLUSION, AND RECOMMENDATIONS ... 47
A. DISCUSSION ... 47
1. Hypothesis 1 ... 47
2. Hypothesis 2 ... 49
3. Hypothesis 3 ... 50
4. Benefits of the Study ... 51
B. CONCLUSION ... 52
C. RECOMMENDATIONS ... 53
1. Future Work ... 53
a. Pupil Data ... 53
b. Use Fleet and Training Squadrons ... 53
c. Allow Full Flight Control ... 54
2. Training Applications ... 55
APPENDIX A. RATING SCALES ... 57
APPENDIX B. SCENARIO CHARTS ... 61
APPENDIX C. DATA FIGURES/TABLES ... 65
APPENDIX C. SUMMARY STATISTICS ... 79
APPENDIX D. APPROVED IRB PROTOCOL... 81
APPENDIX E. RECRUITMENT E-MAIL ... 99
ix
APPENDIX G. WELCOME SCRIPT ... 103
APPENDIX H. DEMOGRAPHIC SURVEY ... 105
APPENDIX I. EYE SCAN CALIBRATION SCRIPT ... 109
APPENDIX J. EQUIPMENT FAMILIARIZATION SCRIPT ... 111
APPENDIX K. PRE/POST-FLIGHT SURVEY ... 113
LIST OF REFERENCES ... 119
x
xi
LIST OF FIGURES
Yerkes-Dodson Law (After Yerkes & Dodson, 1908)... 9 Figure 1.
Friendly Downed Aircraft and Enemy SAM Launcher... 25 Figure 2.
Cockpit Setup ... 29 Figure 3.
Overhead Cockpit Arrangement ... 30 Figure 4.
Increasing Trend of Saccades per Minute by Ranked Experience Figure 5.
Across All Scenarios. ... 41 Distribution of Dwell Times ... 42 Figure 6.
Comparison by Scenario of Blinks per Minute vs. Ranked Figure 7.
Experience ... 46 Cooper-Harper Rating Scale (From Cooper & Harper, 1969) ... 57 Figure 8.
Scenario 2 – Navigation Only ... 61 Figure 9.
Scenario 3 – Navigation and Target Detection and Identification ... 62 Figure 10.
Scenario 4 – Target Detection and Identification on Auto-Pilot ... 63 Figure 11.
Total Flight Hours vs. Overland Hours Correlation ... 65 Figure 12.
Multivariate Overall Median Dwell Times, Overall Mean Fixations, Figure 13.
Ranked Experience ... 67 Saccades per Minute vs. Total Fixations ... 68 Figure 14.
Multivariable Fixation Counts (by Location), Rank... 69 Figure 15.
Multivariate Median Fixation Times (by Location), Rank ... 70 Figure 16.
Bivariate Trends of Ranked Experience vs. Areas of Fixation per Figure 17.
Scenario ... 71 Multivariate Navigation RMS Error, Median Dwell, Fixation Count, Figure 18.
Saccades per Minute ... 72 Fit Model of Navigation RMS Error with Fixation Count, Median Figure 19.
Dwell Time, Saccades per Minute, and Associated Interactions ... 73 Scenario 3 True Positive Target Detection with Fixation Count, Figure 20.
Median Dwell Time, Saccades per Minute, and Associated Interactions ... 74 Scenario 4 True Positive Target Detection with Fixation Count, Figure 21.
Median Dwell Time, Saccades per Minute, and Associated Interactions ... 75 Bivariate Fit of Blinks per Minute to Ranked Experience by Figure 22.
Scenario ... 76 ANOVA of Blinks per Minute by Scenario ... 77 Figure 23.
Summary Statistics Across All Scenarios ... 79 Figure 24.
xii
xiii
LIST OF TABLES
Table 1. Matrix for Assessing Navigational Skills (From Sullivan, 2010) ... 18
Table 2. Participant Demographics ... 26
Table 3. Viewing Angles from Pilot’s Seat ... 30
Table 4. SWAT (From Proctor & Van Zandt, 2008; Megaw, 2005) ... 58
Table 5. NASA-TLX Rating Scale (From Hart, 1998) ... 58
Table 6. CSV Table Fields... 59
xiv
xv
LIST OF ACRONYMS AND ABBREVIATIONS
CSV Comma-Separated-Value CWL Cognitive Workload EEG Electroencephalogram ERP Event-related Brain Potential
IP Instrument Panel
MWL Mental Workload
NASA TLX National Aeronautics and Space Administration Task Load Index
OTW Out the Window
RMS Root-Mean-Square
SAM Surface-to-Air Missile
SWAT Subjective Workload and Assessment Technique TERP Task Evoked Pupillary Response
xvi
xvii
ACKNOWLEDGMENTS
First and foremost, I would like to thank my family who have been a source of support and encouragement as I ventured to Monterey to further my education. To my mother, whom I must thank for instilling in her children the notion that being able to write intelligently is a direct reflection of oneself, and for keeping me on track by asking how my thesis was coming every month. To my father, who has always been an inspiration and a role model, as shown by me following his example 30 years later.
Thank you to Jesse Huston and Michael Day, without whom the experiment could not have taken flight. Your expertise and knowledge with the systems allowed us to gain valuable data and information that will provide the basis for many future works.
Lastly, a special thanks to my advising team, Dr. Quinn Kennedy, Dr. Ji Hyun Yang, and CDR Harrison Schramm, USN. Dr. K, thank you for taking me on and guiding me through the process to create an intelligent and worthwhile thesis. Dr. Yang, thank you for showing me how to analyze, what to analyze, and ensuring that I stayed on track and did not waste time analyzing the data in ways that would not be productive. Lastly, CDR Schramm, from the wardroom to the classroom, thank you for being a friend and a mentor. I’ve learned a lot from you in the past 4 to 5 years that I will take with me back to the fleet and beyond.
xviii
1
I.
INTRODUCTION
A. PROBLEM STATEMENT
Operating in the “information age” makes the ability to perform multiple tasks simultaneously a necessary skill. While selection and training focus on this ability, it is keenly critical for military aviators to perform multiple tasks in a time-pressured environment. Single seat aviators are responsible for all aspects of a mission from before takeoff until after they land. Crew aircraft have similar challenges, although the workload is now shared between multiple members. Cognitive workload has been determined to affect how well pilots are able to do multi-tasking.
Cognitive workload defined as the combined interactions of task demands/difficulty, operator workload, other stressors, and primary task performance (Megaw, 2005). Cognitive workload itself can be tracked and monitored with multiple methods. First, performance-based measures such as adherence to a course or number of correct responses quantify how well an individual performs with an increase in task load. Alternately, subjective measures can be acquired simply by asking individuals what they are thinking or how they feel about their workload. While important, this approach is subjective and may not accurately represent the cognitive workload of the individual. Lastly, there are physiological markers, which are universal, that can identify when an individual faces an increase in mental workload (MWL). Some of these markers are brainwaves, galvanic skin response, heart rate, pupil diameter and dilation/contraction rates, and blink data (Jessee, 2010; Megaw, 2005).
Eye behavior generally has been the subject of many studies of mental workload (Jessee, 2010; Fong et al., 2011; Sibley et al., 2011; Marshall, 2007), which can be converted to an objective and measurable index. Using eye tracking technology to observe the movements of the eyes, we are able to relate how much of an increase there may be on an individual’s cognitive load when
2
given multiple tasks to accomplish. What used to require various invasive methods, the technology now exists to give incredibly accurate (±1mm translation, ±1º rotational) results on an individual without being invasive at all. The equipment that will be utilized has no effect on the individuals, and other than knowing the equipment is there, the participant has no interaction with it. This allows for more pure data collection by decreasing the amount of random variability introduced by knowledge of equipment and the inherent discomfort or distractions of wearing it for any extended period.
Our a priori expectation is that as an individual’s experience and skills increase, the resultant mental workload that they experience should decrease (Sibley et al., 2011). Additionally, expert pilots tend to have a more efficient visual scan pattern than novice pilots (Sullivan, 2010). Previous work has shown that experienced pilots, as defined by flight hours, have more refined and efficient scan patterns that allow them to be able to accomplish difficult tasks (Kasarskis et al., 2001; Starkes & Allard, 1993; Sullivan, 2010). They have more fixations (pauses in eye movement to allow visual intake), shorter durations on each fixation, and more saccades (rapid, simultaneous movements of both eyes to fixate on a common focus). A more efficient scan pattern presumably would decrease cognitive load. Additionally, faster scan times mean that pilots spend less time obtaining information from their instruments and therefore have more attention to devote to the tasks of overland navigation and target detection. Does this refined scan pattern transfer over into a reduced cognitive workload for the pilot?
B. PURPOSE OF THE THESIS
Currently, it is suspected that expertise has an impact on scan patterns and performance across combination tasks, but this impact is not quantified. This thesis aimed to fill in these important gaps in knowledge by assessing performance and measuring scan patterns and, by implication, workload, while navigating an aircraft in a mountainous region, locate and identify targets of
3
interest, and a combination of the two. While participants completed the tasks, their visual scan and basic eye characteristics were captured in real time via eyetracking. They also completed surveys prior to and after each scenario in which they indicate the level of perceived task difficulty at each waypoint. Finally, participants completed a demographic survey that asked about relevant flight experience information. Thus, we used performance-based, objective, and subjective objective measures of cognitive workload across the three tasks:
• Performance based measure: adherence to the given route and ability to detect (find along the route) and correctly identify (friend or foe) various contacts along the flight route
• Objective cognitive workload data (scan pattern, saccade rate, fixation data)
• Subjective cognitive workload data (from pre- and post-surveys) Flight expertise is commonly measured by total flight hours. However, a more useful and nuanced measure of task-specific expertise may be visual scan pattern. Therefore, we used two measures of expertise in analyzing the data: total flight hours and eye scan pattern. Finally, because subjective reports of cognitive workload can be inaccurate, we will compare the subjective surveys to the objective eye scan data. If it is possible to determine how an individual adapts to the change in tasks, and a corresponding change in performance, task saturating situations could be anticipated and, in some cases, mitigated. By identifying when an individual reaches a threshold level of experience, measured by physiological factors such as those studied here, the military could potentially increase training effectiveness by tailoring syllabi focusing on individual tasks.
C. RESEARCH QUESTIONS
• Does self-reported expertise, measured in total flight hours, predict eye scan pattern, measured by fixations, saccades, and dwell
4
times, across the three tasks of Navigation, Target Detection & Identification, and Navigation and Target Detection & Identification?
• Is expertise associated with less cognitive workload across the three tasks of Navigation, Target Detection & Identification, and Navigation and Target Detection & Identification?
• Can eye scan be used to predict performance?
D. HYPOTHESES
1. H0: There is no significant correlation between total flight hours and eye scan patterns in the Navigation, Target Detection, and Navigation & Target Detection tasks.
HA: More experienced pilots will have more saccades, shorter and more fixations, more fixations on salient instruments and stimuli than inexperienced pilots.
2. H0: There is no significant correlation between eye scan pattern and performance in the Navigation, Target Detection, and Navigation & Target Detection tasks.
HA: Pilots with more efficient eye scan patterns (more saccades, shorter and more fixations, fixations on salient instruments and stimuli) will perform better on the navigation (by adherence to the given course and waypoints), task detection (more Correct Detections versus Incorrect and Missed Detections), and combination tasks.
3. H0: Regardless of expertise, there will be no difference in blink rates across scenarios.
HA: Pilots with more experience will have a higher blink rate than pilots with less experience.
5
E. THESIS ORGANIZATION AND TABLE OF CONTENTS
• Chapter I: Introduction. This chapter describes the problem, lists the research and exploratory questions, presents the hypotheses, and describes the scope and benefits of the study.
• Chapter II: Background. This chapter will provide a literature review of previous work in the field. The review includes current work on cognition, attention, types of workloads, and different methods of measuring an individual’s workload while performing tasks.
• Chapter III: Methodology. This chapter describes how the research team designed the experiment, including participant selection, experiment setup, procedures, and equipment configuration.
• Chapter IV: Results and Data Analysis. This chapter will analyze the data collected and present the results and how they apply to the given research questions and hypotheses.
• Chapter V: Discussion, Conclusion, and Recommendations. This chapter will look at the implications of the study and possible future work that can come from it.
• Appendix A: Rating Scales. This appendix contains the rating scales that were referenced for the subjective portions of the experiment.
• Appendix B: Data Figures/Tables. This appendix contains the tables and statistical figures that are not placed in the body of the text.
• Appendix C: Summary Statistics. This appendix contains a summary of the statistical information from the data. Individual
6
performance is not included, nor are other divisions in the data. If there were divisions, the statistic is for the overall set.
• Appendix D: Approved IRB Protocol. This appendix contains the submitted and approved Institutional Review Board Protocol for the experiment.
• Appendix E: Recruitment E-mail. This appendix contains the e-mail sent to the students, staff, and faculty of the Naval Postgraduate School requesting participants for the experiment.
• Appendix F: Subject Checklist. This appendix contains a checklist used for each participant to ensure consistency between volunteers and verify that all necessary steps have been taken prior to, during, and after the experiment.
• Appendix G: Welcome Script. This appendix contains a short explanation for the participant about how the experiment will progress.
• Appendix H: Eye Scan Calibration Script. This appendix contains the script that we used to set up and calibrate the face tracking equipment.
• Appendix I: Equipment Familiarization Script. This appendix is used during the Practice Scenario in order to allow the volunteer to understand the equipment and the controls.
• Appendix J: Demographic Survey. This appendix allowed the researchers to gather demographic information from the participants regarding various aspects of their experience.
• Appendix K: Pre/Post-Flight Survey. This appendix is the survey given to each participant before and after each scenario.
7
II.
BACKGROUND
A. INTRODUCTION
This thesis focuses on how a pilot performs when presented with different tasks simultaneously. Even in multi-piloted aircraft such as helicopters, the workload inside the cockpit consists of many tasks occurring simultaneously. Early in training new pilots are trained to “Aviate. Navigate. Communicate.” This rule helps prioritize when task loading becomes considerable. Most importantly, the job of the pilot is to keep the aircraft in the air. Second, knowledge of where the aircraft is and where it is going is vital to mission success. Lastly, but not to downplay its importance, communication allows the pilot to send and receive information and coordinate actions. Simply put, failing to navigate or communicate may possibly lead to disaster whereas failing to aviate will.
The aviate and navigate portion of this rule have large visual workloads as the pilot scans the cockpit to monitor aircraft performance and parameters, and scans out the window to maintain situational awareness of his location. The scan pattern is also taught early in aviation training and each pilot develops their own pattern as they acquire hours in the cockpit. In the beginning, the scan is inefficient as it has long dwell times, less fixations, and a less refined “flow” around the cockpit than those with more experience (Kasarskis et al., 2001; Sullivan, 2010). According to Sullivan, experts take less time to take in the salient details in a scene, shifting their gaze more frequently and overlapping successive scans in order to create a finer mental picture of their environment. Additionally, less experienced pilots will fixate on less salient features while taking longer to encode and process what their seeing in order to understand their respective situations.
There are various methods of detecting and measuring changes in cognitive workload. We examined previous work on attention, vigilance,
8
cognition, multitasking, and the ways in which these combine to give an individual the situational awareness, or sight picture, of what is going on during navigation, target detection, or the combination of the two. Different methods exist for measuring workload of an individual, namely performance, subjective, and physiological. By using all three of these in the research, it is possible to correlate not only one’s actual performance, but also their perceived performance. Technology today has progressed to the point where it is possible to measure an individual’s workload empirically without any imposing equipment that may have an effect on the data. To be able to assess an individual’s cognitive workload in real time and detect visual scan patterns associated with differing cognitive loads gives the potential for tailored training that can improve performance and maximize and throughput.
B. ASSESSMENT OF WORKLOAD
Proctor and Van Zandt (2008) define workload as “an estimate of the cognitive demands of an operator’s duties.” In order to explore workload, it is necessary to define precisely the tasks and benchmarks. Empirical methods for measuring workload include primary task, subjective measures, secondary task, and physiological (Proctor & Van Zandt, 2008; Megaw, 2005). Analytical methods exist as well, defined similarly in the same sources; however, these are often used early in the development of a system to predict behavior. As such, only the empirical methods will be reviewed and used in this research.
1. Performance Measures
Performance measures of workload, also known as primary-task measures, are those that measure how well an individual performs a task. Performance and workload are, in general, not linearly related. Instead, with workload on the x-axis, they typically follow an inverted “U” shape, commonly described as the Yerkes-Dodson law (Aral et al., 2007; Proctor & Van Zandt, 2008). Shown in Figure 1, the Yerkes-Dodson Law states that performance is
9
not highest the simpler a task is nor with less arousal or stimulation. Previous work shows that with simple tasks, an individual’s performance can be just as poor as if confronted with a mentally taxing, high cognitive workload task (Megaw, 2005; Proctor & Van Zandt, 2008). In the Navy, one tenet of Crew Resource Management is that of Situational Awareness (SA). In the MH-60S helicopter Naval Air Training and Operating Procedures (NATOPS) manual, task overload and underload are recognized as factors that can cause a drop in SA, which can have dramatic effects on the performance of a flight. Because of this, the level of vigilance and arousal must be kept at a level that capitalizes on the increase in performance without overtasking the individual.
Yerkes-Dodson Law (After Yerkes & Dodson, 1908) Figure 1.
Measuring workload via performance is done using a scoring system. This can range anywhere from an exam in school, a time in a race, or simply staying inside the lines while coloring a child’s picture. Megaw (2005) states that “while poor human performance can be indicative of task demands being too
Low Low High High Arousal Level Q ual it y of P er for m anc e Simple Task Complex Task
10
high, acceptable performance does not necessarily reflect task demands.” Because of this, if one is to use performance measures to assess workloads, it is best to use multiple measures (Proctor & Van Zandt, 2008). Different measures of performance measure different aspects of workload. If we were to use just one, there would be a hole in the data that could lead to incorrect assumptions and conclusions.
With respect to the scenarios presented to our participants, we expect that performance (adherence to assigned route and quality of target detection) will be higher in the scenarios in which these two tasks individually are the sole tasks being asked of the participant. When combined into one scenario, the mental workload will have to be allocated accordingly in order to complete both tasks. Depending on the individual, they may give more attention to the target detection and identification at the expense of the navigation.
2. Subjective Measures
Subjective measures of performance are based on the opinions and feelings of the individuals immediately after the completion of their task. As such, these methods are subject to biases, such as hindsight (Pezzo, 2011), mood congruent (Mayer & Bower, 1985), and egocentricity (Epley et al., 2004; Fellner et al., 2004) and have certain shortcomings when it comes to using one as a sole measure of workload. Subjective measures include rating scales and questionnaires. Proctor and Van Zandt (2008) point out three issues with using subjective measures:
• They may not be sensitive to aspects of task environment that affect primary-task performance,
• Operators may confuse perceived difficulty with perceived expenditure of effort,
11
• Many factors that determine workload are inaccessible to conscious evaluation (such as ability to compartmentalize, prior training, or fatigue, etc).
There are a variety of methods to measure subjective workload. The following three measures are those that form the backbone of most current subjective measuring scales.
a. Cooper-Harper
The Cooper-Harper method (Cooper & Harper, 1969) uses a single 10-point scale to which subjects would rate their experiences. Originally designed for analyzing aircraft handling, the scale is adaptable to a wide variety of fields. The scale ranges from having “Major Deficiencies” (10 points), to “Excellent, Highly Desirable” (1 point). Other than major deficiencies, the rest are grouped in threes that make for easy classification and navigation, essentially providing an objective path to the subjective measure.
b. SWAT
The Subjective Workload Assessment Technique shown in Appendix A was developed as an alternative to the Cooper-Harper method and uses a series of cards to assess workload. These cards are differentiated from each other by time load, mental effort load, and stress load (Proctor & Van Zandt, 2008). There are three levels for each of the subcategories and all combinations are represented on the cards for a total of 27 cards. Through the ordering of the cards and applying a “conjoint measuring technique” (Megaw, 2005) to place each of the 27 cards on a 1–100 point scale. The SWAT technique is time consuming and the weighing of each subcategory differs between participants.
c. NASA-TLX
One of the most widely used methods of acquiring a subjective measure of performance is NASA’s Task Load Index. Using six scales similar to
12
the oft-used Likert scale, TLX takes a user’s input as a gradient, matching their rating on the particular scale to a score between 0 to 100 (Hart & Steveland, 1988). Appendix A shows the scales that TLX utilizes. In Hart and Steveland’s report, there was a weight given to the measurements that would make the data analysis take slightly longer. Further studies with and without the weights have suggested that this step is superfluous; however, they have been countered just as often with studies showing the weights give a “small but significant contribution” (Megaw, 2005).
3. Psychophysiological Measures
One of the most effective ways to get a true gauge on the workload an individual is experiencing is through psychophysiological measurements. These typically fall into two categories: arousal and brain activity (Proctor & Van Zandt, 2008). As the name implies, brain activity focuses on the minute electrical impulses that are detectable with various methods. Arousal is measured via a variety of subconscious reactions that occur in the body when exposed to different levels of stress and workload. These indicators, largely in the sympathetic nervous system, include pupil diameter, pupil dilation/contraction rate, heart rate and variability, galvanic skin response, blood pressure, blink data, and respiration rate, among others (Proctor & Van Zandt, 2008; Marshall, 2000; Marshall, 2007; Jessee, 2010; Fong et al., 2011; Sibley et al., 2011). The responses can be measured with a variety of accurate and dependable instruments.
a. Brain Activity
Brain activity is a second measure of mental workload. Using an electroencephalogram (EEG), it is possible to measure brain activity in response to given stimuli (Megaw, 2005; Proctor & Van Zandt, 2008). The EEG uses a network of electrodes attached to the scalp that measure tiny variations in voltage and translates it into a visual representation of mental activity.
Event-13
related brain potentials (ERP) are the changes in brain activity that occur when the events occur that require a differing amount of processing. Data analysis is required to determine the difference between these ERPs and the background, normal brain activity (Megaw, 2005). Other brain measurements include positron emission tomography, functional magnetic resonance imaging, magnetoencephalography, transcranial Doppler sonography, and optical brain imaging (Proctor & Van Zandt, 2008). These methods provide much more detailed data, but as they are intrusive, we opted not to utilize any of them.
b. Cardiac and Galvanic Skin Response
Cardiac activity and galvanic skin response are two factors that a mentally loaded individual may be conscious of, but over which they would have no control. These responses come from the sympathetic nervous system and are noticeable manifestations of the “fight or flight” response and show an increase or decrease in heart rate (Megaw, 2005; Roscoe, 1984), or the increase of skin moisture (sweat) thereby increasing skin conductivity. Megaw proceeds to describe how “there is a lack of understanding as to why or how mean heart rate should increase with increasing mental demands.” Like measuring brain activity, measuring these two markers of mental workload are intrusive and were not used in this study.
Although advances in technology allow for better measurement of arousal, these techniques remain cumbersome and intrusive (Marshall, 2000). Measuring brain activity still involves attaching electrodes to the scalp and therefore remains to be more intrusive than other methods. This process affects a participant in more ways than one. First, the equipment itself can be cumbersome, causing discomfort or hot-spots if left on for an extended period of time (Marshall, 2000). Second, the knowledge of the equipment itself can cause the body to have subconscious reactions that can affect the data. An aviator flying a simulation while being recorded is barely different from them doing it just being observed (which occurs all the time); having them fly while hooked up to
14
wires and equipment can put undue stressors and pressures on their mind. As will be discussed next, eye-tracking technology allows the experimenter to measure accurately a participant’s reaction to workload without being intrusive. Being able to disconnect the detection equipment from the individual allows for a more natural environment and therefore a more pure collection of data.
c. Eye Tracking
Eye tracking is one field that has progressed greatly in the past few decades. Originally, the equipment needed to track one’s eye movements was bulky and was worn on the head. As mentioned, this can skew the data collected if the individual is uncomfortable or just thinking about the equipment. Now, being able to detect and collect data from eye-trackers is completely non-intrusive to an individual, save the knowledge that there are cameras observing them.
(i) Eye blink activity. As every schoolchild knows, one of the main purposes of blinking is to lubricate the eye. There is a variety of other purposes, but the eye will also blink for seemingly spontaneous reasons (Stern et al., 1984). Stern et al. call this the endogenous blink. At the time of their publication, there was little work done on cognitive activity and blink rate. Almost thirty years later, there has been much research relating blink rate to cognition. Studies have shown that when a blink occurs, the brain temporarily shuts down visual input (Stern et al., 1984; Jessee, 2010). Additionally, blinks tend to occur after taking in visual information, possibly as the brain switches from a visual workload (VWL) (taking in the information) to a mental workload (processing the information) (Megaw, 2005). In some situations, blink rate decreases with an increase in VWL, such as driving and flying. However, Megaw (2005) and Stern et al. (1984) both state that blink rate increases in other cases where visual processing is not as demanding. Although published more than twenty years later, Megaw sums it up concisely saying, “The inconsistent results relating to blink rate may indicate a diagnostic potential for the measure with the acquisition
15
of visual information being associated with lower blink rates, and visual cognitive processes with higher rates.” While performing demanding tasks, regardless of difficulty, the blinks tend to occur at times when there is no need for steady and constant visual intake (Stern et al., 1984). In tracking tasks, such as those used in this thesis, if an individual knew a visually demanding portion of the task was approaching, blink rate would increase prior to and after the portion, with a drop in between (Stern et al., 1984).
(ii) Saccadic events. Saccades are periods of time when the eye is actively in motion. During this movement, uptake of visual information is temporarily paused (Carlson-Radvansky, 1999). Because of this, the time in between saccadic events, the fixation, is when the eyes actually take in the scene before them. Fixations and saccades are not related on a one-to-one scale. There can be multiple saccades from one fixation to the next as the eye rotates to the next object of interest (Marshall, 2007). Times in between saccades (fixation or dwell times) vary as well; longer fixations imply more time required for the visual uptake and the VWL. A NASA report found that novice pilots spend more time per fixation than expert pilots (Tole et al., 1983). The expert pilots in this study were able to acquire the information they needed in a much more expedient fashion and proceed with their scan. This does not necessarily indicate a lower cognitive workload, only that they are able to process more information in a shorter amount of time than the inexperienced pilots.
With larger shifts in focus, it is necessary to move the eye through an increased number of degrees in the field of view. As mentioned, when the eye is moving, there is no uptake of visual information. This would therefore lead to the conclusion that with larger shifts, there is a longer amount of time spent without visual input. Jessee (2010) mentions that although having objects close together would lead to less VWL, the ability to discern one from another would lead to an increase in MWL.
16
(iii) Pupillometric Measurements. With the increase of computing power and the ability to collect and analyze data in real time, we can observe an individual’s pupils for telltale signs of cognition. Poker players for centuries have known that when presented with an appealing hand, the pupils will dilate, giving a tell that is extremely hard to control. Multiple studies corroborate the hypothesis that pupil size increases with an increase in arousal and motivation (Fong et al., 2011; Sibley et al., 2011; Jessee, 2010; Megaw, 2005; Just et al., 2003). When using pupils as a tool to measure MWL and VWL, the experimenter has to be aware of the environment. Pupils are very sensitive to changes in illumination level and if there are fluctuations, this can confound the data (Megaw, 2005). The eyes and pupils also vary between individuals. Although it can be said that pupil size will increase with an increase in workload, there is no given method to say they will increase or decrease a given amount. Even within an individual, pupil size can vary due to what Jessee (2005) calls “operator state variables.” These would be such things as fatigue level, caffeine intake, alcohol, drugs, etc. that would affect the individual on the physiological level.
Pupil size is not the only indicator that we can use from this type of data. The dilation and contraction rate is useful in revealing an increase in cognitive workload and how much of an increase there is. In Sibley et al. (2011), they describe how pupil size is greatest in the beginning of a task of increased difficulty, and would then decrease. Additionally, as the individuals learn the task and become accustomed to it, the amount of dilation would decrease and the rate at which they return to normal would increase with the same cognitive stimulation. In Fong et al. (2011), they also showed that the dilation rate is inversely related to the change in cognitive workload that an individual experiences. Their method of measuring, Task Evoked Pupillary Response (TERP), relies more on the change in size vice the size itself and is therefore more resistant to the confounding factors mentioned.
17
4. Secondary Task Measures
Secondary tasks are those tasks that an individual performs in addition to their primary task. Also referred to as dual or concurrent tasking, the purpose of secondary task measures is to measure the amount of remaining cognitive processing power while completing the primary task (Megaw, 2005). As the names imply, the primary task should be the focus of the attention during the exercise. Measuring performance using secondary tasks does not necessarily mean measuring performance of the secondary task. The two basic types of secondary task techniques are the loading task paradigm and the subsidiary task paradigm. With the former, a researcher instructs the participant to maintain performance on the secondary task. The goal is to measure the degradation in the primary task, thus indicating what kind of effect the secondary has. The second type, subsidiary task, is the opposite. It instructs the participant to maintain priority on the primary task while measuring the decrease in performance on the secondary task. Both of these measures rely on the use tasks that make use of similar psychological resources (e.g., visual, oral, or auditory). Megaw states that when the two tasks share none of the same processes, there is no interference and an individual can reasonably perform both tasks with no degradation in performance.
C. NAVIGATION
Navigation as a skillset within flying is one that, behind maintaining actual flight, has the most potential on outcome of a flight. Training on navigation begins before pilots even sit inside a cockpit with basic understanding of terrain, features, flight paths, and obstacles. By the time the student sits in the aircraft with their instructor, the expectation is that they can successfully find their way to an outlying field at which they will begin training, even without knowing how to control the aircraft quite yet. As they progress in the training pipeline, the navigation becomes an automated task with the student recognizing certain
18
waypoints by features and within a few months, the student can be flying solo, capable of handling all tasks required of the solo flight in the training areas.
1. Confidence of Navigation
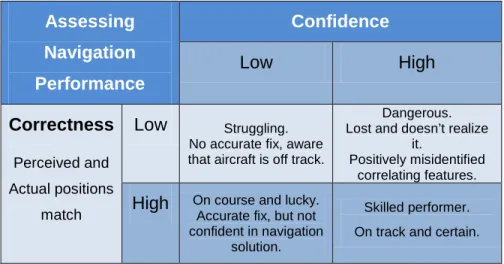
In the operational squadrons, and specific to helicopters, flying is a crew effort with one pilot at the controls (PAC), and one pilot not-at-controls (PNAC), handling tasks not involved with actual control of the aircraft. Navigation is among the tasks typically designated to the PNAC and it is his responsibility to maintain the flight on course and on time (Lennerton, 2004; Hahn, 2005). A given route is not intended to be followed exactly. The flight has the ability and the responsibility to be dynamic. If a threat is discovered, or weather moves in, it is up to the aircraft commander to adjust the course in order to keep the helicopter and the crew safe. Sullivan (2010) describes four areas by which we can assess navigation performance, as shown in Table 1. The table shows how confident the individual is at their perceived location versus intended location. This matrix depicts that being off-track should not always be penalized, as a pilot can be off-track but still know exactly where they are and where they are going.
Assessing Navigation Performance Confidence Low High Correctness Perceived and Actual positions match Low Struggling. No accurate fix, aware that aircraft is off track.
Dangerous. Lost and doesn’t realize
it.
Positively misidentified correlating features. High On course and lucky.
Accurate fix, but not confident in navigation
solution.
Skilled performer. On track and certain.
19
2. Navigation Methods
For a typical low-level flight, the non-flying pilot will have a 1:50,000 chart like the ones used in this thesis. Sullivan (2010) writes that sub-skills involved in helicopter navigation are dependent on certain goal-seeking methods that develop and change with experience. As a novice, a pilot is primarily means-based—following practices and procedures known through rote memorization and represent hard and fast guidelines by which to fly. With a little more experience, an intermediate pilot moves on to schema-based navigation. They have a plan and they have the ability to see beyond the “now” and provide information to the flying pilot as to what they will see or what to expect. Lastly, an expert’s method of navigation is rule-based meaning they will describe a set of rules that lead to the ultimate goal. Actual execution of the rules is left to the discretion of the PAC, however the PNAC will continually asses and update his rules as the flight progresses.
Being able to navigate successfully involves being able to take the 2-dimensional representation of the terrain represented on the chart and associating it with the 3-dimensional out-the-window (OTW) view. For novices or anyone without overland navigation experience, this typically is a difficult task. With experience, an individual is able to understand which OTW features will be easily noticed on the chart, and conversely, which chart features can be used for navigation. Key terrain features include checking features (“on the right track”), channeling features (“follow to the next point of interest”), and limiting features (“you have gone too far”) (Lennerton, 2004; Hahn, 2005). The ability to go from chart-to-OTW and OTW-to-chart comes with practice and is enhanced with an efficient scan within and without the cockpit. This creates two distinct phases of navigation, depending on how the pilot perceives their current situation: maintenance and repair.
20
a. Maintenance
Maintenance of navigation is the practice of knowing where one is and keeping control over their location on the chart. The search/scan pattern of an individual in a maintenance regime is directed and deliberate. They are looking for confirmation on their location rather than trying to determine where they are (Sullivan, 2010). Pilots in maintenance mode are confident in their location regardless of how much the flight may deviate from the route. As shown in Table 1, when they are high on “correctness,” this is good and would be the performance expected of more experienced pilots. According to Sullivan’s dissertation, less experienced pilots “will have increased dwell time, taking longer to capture and encode features in the OTW view.” Ideally, staying in the maintenance phase should be easier than repair as one only has the task of matching and not searching.
b. Repair
Repair strategy involves perceiving that one has unintentionally strayed from the assigned route and finding a solution to recover. As shown in Table 1, repair would not occur if the pilot were purposefully off track for something such as terrain, weather, or threat avoidance. Sullivan (2010) calls this a naïve search in that the pilot does not have the confidence of his location by which to make a matchmaking maintenance search. Experts in repair select a few key features across a wide swath that will allow them to better triangulate their position. The repair search of a novice is focused on relevant and non-relevant features in a smaller region leading to further lack of confidence in their position. For this experiment, if an individual recognized they were lost, the research team member gave them a heading to fly in order to put them back on course.
21
3. Navigation and Workload
In a crewed aircraft, navigation occurs with cooperation from all members being able to pick out and describe salient features from the surrounding terrain (Sullivan, 2010; NATOPS, 2008). In a single-seat aircraft, the pilot must accomplish this task concurrently with the aviation and communication portions of the flight, thereby increasing their workload. At 150’ above ground level (AGL) in a mountainous region, terrain avoidance has consequences that are even more serious should it be ignored. Thus, the pilot has even greater workload when flying in this type of environment. One could slow down in order to provide more time with which to process the scene, but in an operational environment, this is not practical, as a slow aircraft is an easier target. Additionally, if one slows too much, they enter a zone where the airspeed-altitude combination is dangerous should an emergency occur (NATOPS, 2008). In our experiment, although flying a simulated helicopter, we put the participants in a single-seat aircraft to increase their workload beyond just navigating or just target detection.
22
23
III.
METHODOLOGY
A. INTRODUCTION
The purpose of this thesis was to identify differences in scan patterns among pilots of varying experience in order to gain insight into (1) how these differences can relate to workload and (2) to capitalize on these differences to create more effective and efficient pilot training. We built upon previous work (Sullivan, 2010) that investigated neurophysiological cues of pilots in a single task environment. In order to address differences in workload, we chose two scenarios that, by themselves, are not particularly stressing—navigation, and target detection and identification. We also created a scenario in which pilots had to perform both tasks simultaneously (combined task). In dual-piloted aircraft, these tasks are often split between the pilots in order to reduce the workload and increase safety. By having two tasks and examining the pilots in each single task as well as the combined task, we could identify changes in their behavior as the cognitive task load increases.
1. Overview of the Tasks
The research team created three experimental scenarios and one practice scenario. Each scenario was designed to elicit appropriate responses for the task(s) at hand; i.e., the navigation task assessed navigation skills. In all cases, the Practice Scenario was the first one to be administered. Scenario 2 (navigation only) followed in order to decrease the possibility of an order effect when analyzed with an earlier navigation experiment. The order of Scenarios 3 (navigation and target detection & identification) and 4 (target detection & identification only, auto-navigation) were counterbalanced in order to reduce confounds and order effects for this experiment. All scenarios simulated flight in an area near Twenty-Nine Palms, CA, which has an established military training area. The routes flown were typical of low-level routes that could be expected in both training and real world missions. Although all scenarios were in the same
24
general region of Twenty-Nine Palms, none of them reused waypoints, nor did the routes of flight intersect.
Although we seek realism in training environments, there are limitations on what we have and what we can use. The variation inherent in the past flight experiences of the pilots made it so that a simplification of the cockpit was necessary.
For the navigation task, we instructed the pilots to navigate their way around a series of waypoints. We measured their performance on this task as adherence to the straight line, waypoint-to-waypoint route. Utilizing root-mean-square (RMS) error, we calculated their distance from the given route at each data collection instance. Although there is no way to score a 0 (perfect adherence), namely because turns are inherently off the sharp corner of the route, this is constant across all pilots and is therefore already controlled. The pilots did not have complete control of the aircraft during the navigation tasks. In order to reduce random variability, they only had control of the heading of the aircraft. Altitude was constant at 150’ above ground level; airspeed was a constant 60 knots. This simplified the controls and minimized variability in “basic air work” which involves the overarching task of maintaining control of an aircraft so that more attention could be applied to what we wanted to measure— navigation performance.
The target detection and identification task, as the name implies, was a two-piece task. The Practice Scenario, Scenario 3, and 4 each had two types of targets interspersed along the route. Because detection of the target could be as simple as discerning anomalies in the simulated terrain, we added identification as a method to get the pilots to concentrate more on the target. Along with increasing the mental workload, this had the added bonus of allowing the eye tracking equipment to detect more accurately when the individual identified the target. Downed aircraft, designated with a “crashed” A-10 Warthog, represented friendly targets for the identification portion. A SAM launcher represented the
25
enemy target. Figure 2. shows the two types of targets. The targets were immobile objects inserted into the scenario and did not move or in any way react to the helicopter flying past them.
Friendly Downed Aircraft and Enemy SAM Launcher Figure 2.
B. PARTICIPANTS
Research participants were recruited from the student body at the Naval Postgraduate School (NPS). Participants were eligible if they were pilots or have had formal training in overland navigation experience. With approval from the Institutional Review Board, an e-mail was distributed requesting volunteers (Appendix C). Additionally, flyers were distributed around school and the team provided equipment demonstrations to recruit participants.
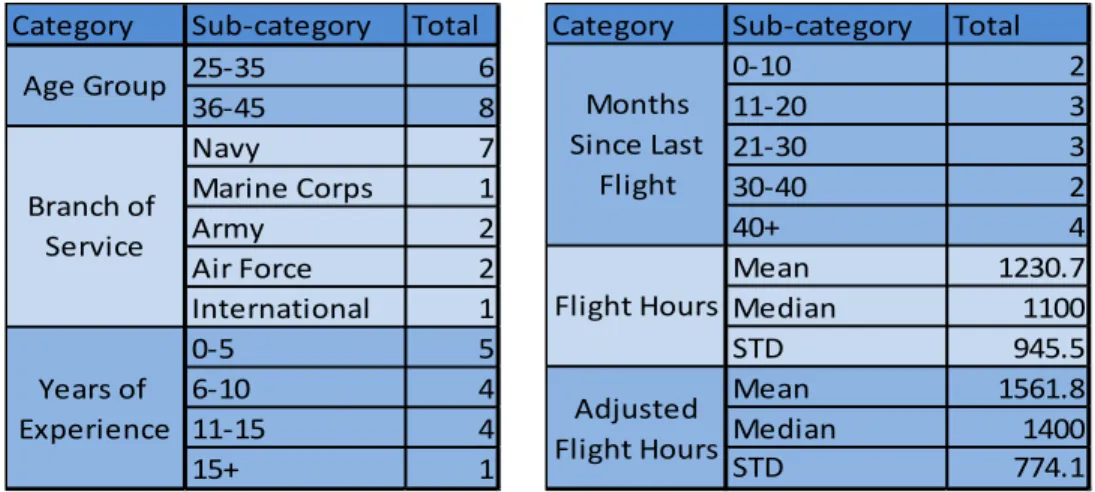
We had 14 volunteers from which we collected data. Eleven of the volunteers were pilots. Two of the remaining individuals had extensive passenger experience as troops in the back of helicopters. One individual was a Surface Warfare Officer who was allowed to participate and only after completion of all four scenarios did the research team learn he was neither a pilot nor did he have overland navigation experience. Preliminary analyses of the data indicate that these three participants were consistent outliers; therefore, they were excluded from analyses for hypothesis testing. Although the experiment was open to all faculty, staff, and students at the school, all participants were male between the ages of 25–45. For the pilots that participated, there was a variety
26
of experience and backgrounds, as detailed in Table 2. For counts, individuals without any flight experience are tallied with the 40+ group for their “Months Since Last Flight.” Adjusted flight hours shows the flight hours data without the three outliers previously described.
Category Sub-category Total
25-35 6 36-45 8 Navy 7 Marine Corps 1 Army 2 Air Force 2 International 1 0-5 5 6-10 4 11-15 4 15+ 1 Age Group Branch of Service Years of Experience
Category Sub-category Total
0-10 2 11-20 3 21-30 3 30-40 2 40+ 4 Mean 1230.7 Median 1100 STD 945.5 Mean 1561.8 Median 1400 STD 774.1 Months Since Last Flight Flight Hours Adjusted Flight Hours
Table 2. Participant Demographics
C. EQUIPMENT
1. Hardware
a. Computers
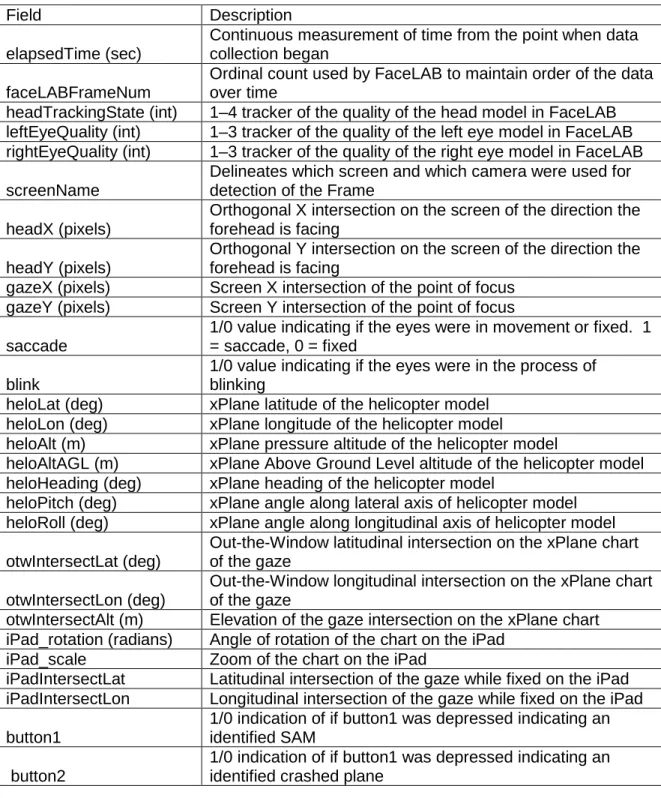
The overall setup for the experiment consisted of three systems. Laptops, desktops, an Apple iPad, and a CAVE system provided the necessary methods to track, collect, and maintain the data. The computer setup for the experiment consisted of interconnected laptops and desktop computers. Three laptops, one for each set of cameras, collected the eye tracking data. The data were kept locally on the laptops until manually moved to another system for analysis. The laptops were identical with the following specifications:
• Intel T7200 @ 2.0 GHz CPU
27
• Mobile Intel 945 Express Chipset Family Graphics
• Windows XP Service Pack 3 Operating System
Three desktop computers created the scenes, controlled the flights, gave supervisory authority, and aggregated the data from the laptops. Each desktop was identical in its specifications:
• Intel T7200 @ 2. GHz
• 3 GB RAM
• NVidia GeForce 8800 Ultra graphics card
• Windows XP Service Pack 3 Operating System
Although identical in components, the desktops performed very different jobs. The X-Plane system handled the actual flight of the helicopter. Participant input from the joystick was handled via the system in the Practice Scenario, 2, and 3. The X-Plane system also provided output to the instructor system for administrative capabilities. Terrain generation and rendering were performed by Delta3D and OpenSceneGraph.
The instructor system gave the research team the ability to maintain control over the flow of the scenarios. From this station, and with input from the X-Plane system, the instructor knew where the subject was on the chart (as well as in relation to the given route), what they see on all three screens, and with input from the FaceLAB computers, a general locus of their gaze.
The CAVE system consisted of an identically configured desktop, screens, and projectors, the latter of which we will discuss below. The desktop’s primary job was to take display outputs from the other computers and route them to the appropriate projectors and displays. This computer generated the instrument panel located inside the cockpit for the participant’s use. This system also provided the output files for the researchers.
28
Lastly, on the display aspect, an Apple iPad displayed the chart for the participant. Although physically fixed in position to allow calibration with the IR cameras, the pilot could rotate the chart on the screen to maintain his orientation if he desired. The iPad communicated with the rest of the system wirelessly to a Macbook Pro, which was physically (wired) connected to the NPS intranet and the other computers from there.
b. Physical Setup
The most noticeable pieces of the physical setup of the apparatus were the cockpit and the screens. The cockpit (Figure 3. is a model cockpit without any instrumentation of its own. To reduce variation from the two seats, and to maintain one configuration of the cameras, pilots sat in the right seat. In front of them, in the cockpit, a 10.6″ × 17.3″ (20″) screen displayed the virtual instrument panel. The screen had the following instruments:
• Airspeed
• Barometric altitude
• Time
• Heading
To the pilot’s left, within arm’s reach, was the iPad. Both cockpit displays (instrument panel and iPad) were in fixed locations to maintain calibration with the cameras.
The CAVE system provided the out-the-window (OTW) display for the experiment. Encompassing over 180º (~103º left, ~118º right), three screens provided a wrap-around view for the flight. Three projectors connected to the CAVE computer backlit three 96″ × 72″ (120”) screens in full 1024 × 768 resolution. The positions of the screens were fixed to allow calibration with the IR cameras. Figure 3 shows the cockpit setup (with one extra configuring laptop) and the large display screens. This system had on it X-Plane 9.0, the image generator, the data logger, and Delta3D and OpenSceneGraph in order to create the graphics for the scenarios.
29
Cockpit Setup
Figure 3.
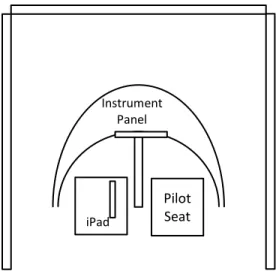
Due to the fixed position of the seat and screens, there could be minor differences between viewing angles per individual. Figure 4 shows the arrangement of the cockpit. From the center of the seat, the right screen is 30″ away, the front (center) screen is 80″, and the left screen is 66″. The iPad sits on the empty seat, arm level, 22″ from pilot’s center. The seat bottom is 36” from the floor. Each screen is raised 17.5″ from the ground. With these measurements, we can approximate the field-of-view. The elevation and depression angles given in Table 2 are calculated for an American male in the 50th percentile for sitting eye-height (31.5”) (Phaesant & Haslegrave, 2006). As mentioned above, the transverse angles are 103º to the left and 118º to the right.
30
Overhead Cockpit Arrangement Figure 4.
Left Right Elevation 18º 36º Depression 37º 59º
Table 3. Viewing Angles from Pilot’s Seat
Three sets of IR cameras provided the input to FaceLAB for the eye tracking data. These were arranged around the cockpit in order to collect gaze parameters from any normal rotation of the head. In general, they were positioned to be unobtrusive for the participants, sitting well below their line of sight if they were to look at the bottom of the large displays (the lowest display in the setup). As such, the cameras provided a “look-up” view of the participants. Calibration occurred for each participant prior to the commencement of the practice scenario.
2. Software
The software package used in this experiment was similar to the package used in Sullivan (2010). FaceLAB 5.0 collected the incoming data from all camera pairs and integrated into one file with FaceLAB Link 2.0. The collection process included from which camera the gaze data came, as some eye positions
Pilot Seat iPad
Instrument Panel
31
could be tracked by more than one set of cameras (e.g., center OTW display). FaceLAB required a one-time calibration per individual. After this calibration, the participant had reasonable range of head rotation in the transverse and frontal planes for the duration of the experiment. The programs used to render and collect data were:
• X-Plane 9.0
• FaceLAB 5.0
• Delta3D and OpenSceneGraph
D. SCENARIOS
Charts for Scenarios 2, 3, and 4 can be found in Appendix B.
1. Practice Scenario
The Practice Scenario is a combination scenario involving both navigation and target detection and identification. It contained both tasks, and although data collection occurred, this scenario was done to ensure the equipment was properly set up and functioning and to introduce the individuals to the equipment and allowed them to acclimate to differences from equipment or platforms on which they may have previous experience. When situated, the research member “unfroze” the simulator, thus commencing the flight and giving the participant control of the aircraft. The participant flew through the established waypoints detecting targets as they showed in his view.
2. Scenario 2–Navigation without Targets
Scenario 2 involved strictly navigation without the burden of target detection and identification. Twelve waypoints provided approximately six to nine minutes of flight time depending on the accuracy of the pilot in maintaining adherence to the given course. Although just a single task, navigation is the second hardest of the three tasks because the pilot must physically maintain the heading of the aircraft, and keep track of the location of the aircraft. This meant looking out the window, taking in visual cues from the terrain, and comparing
32
them to what was presented on the chart in order to mentally place and track the movement of the aircraft through the scenario.
3. Scenario 3–Navigation and Target Detection and Identification
Scenario 3 was the combination task involving both navigation and target detection and identification. The purpose of this scenario was to determine how the individual performed when presented with multiple tasks simultaneously. They were given no instruction as to which task to prioritize. Upon commencement of the scenario, the individuals flew around 12 designated waypoints while detecting 11 targets. Targets were placed such that if gaze data was available, there would not be confusion as to which target an individual is observing (i.e., there was ample lateral separation between targets as viewed from the vicinity of the given course).
4. Scenario 4–Target Detection and Identification on Auto-Pilot
Scenario 4 involved target detection and identification while the software controlled the movement of the helicopter (i.e., while on autopilot). Although given a chart study period, this was for consistency as there was no need and the pilot could not influence the direction of the helicopter. As with Scenario 3, seven waypoints were provided, among which 10 targets were placed. Total flight time ranged from approximately seven to nine minutes. This scenario explored the pilot’s ability to concentrate strictly on one task, which although slightly more complicated than just detection, we deemed as the simplest of the three experimental scenarios.
E. MEASURES
1. Surveys
a. Demographic
We collected demographic data from all participants prior to the commencement of the experiment. Appendix G shows the demographic survey.