Fuel & Power Experts
Ultra-Systems Technology Pty Ltd
Electric Power from
Competitive Sources
prepared for
ELECTRIC POWER FROM COMPETITIVE SOURCES
CONTENTS
Page
EXECUTIVE SUMMARY III
1 INTRODUCTION 1
2 ELECTRICITY GENERATING COSTS 3
2.1 FOSSIL FUELS 3
2.1.1 For Coal, the Supercritical Pressure Steam Cycle 3
2.1.2 For Natural Gas, the Advanced Gas Turbine Cycle. 5
2.1.3 Oil Firing 6
2.2 RENEWABLE ENERGY TECHNOLOGIES 7
2.2.1 Solar Photovoltaic 7 2.2.2 Solar Thermal 8 2.2.3 Wind 9 2.2.4 Hydro-electricity 11 2.2.5 Biomass 11 2.3 NUCLEAR ENERGY 13
2.4 FUTURE TRENDS IN ELECTRICITY COSTS 15
2.4.1 Capital Investment 15
2.4.2 O&M costs 17
3 ENVIRONMENTAL ISSUES 19
3.1 ATMOSPHERIC EMISSIONS 19
3.2 OTHER DISCHARGES 21
3.3 COST OF ENVIRONMENTAL COMPLIANCE 22
4 SOCIAL/POLITICAL ISSUES 23
4.1 ELECTRICITY PRICING POLICIES RELATED TO ECONOMIC GROWTH 23 4.2 POLITICAL, MANAGEMENT AND REGULATORY ISSUES 23
4.2.1 Establishing a Competitive National Energy Market 23
4.2.2 Costs of Regulatory Compliance 24
4.2.3 Dividend Requirements 25
4.3 WORKFORCE AND THE COMMUNITY 25
4.4 SITE ACQUISITION & INFRASTRUCTURE 26
5 SUMMARY 27
6 CALCULATION SPREADSHEET 29
6.1 INSTALLATION 29
6.2 INPUTS 29
6.2.1 Inputs Required for Evaluation 29
6.2.2 Inputting Values 30
LIST OF TABLES
Page
TABLE 1.1: BULK ELECTRICITY SUPPLY COSTS 1
TABLE 2.1: COMMERCIAL WIND TURBINE PERFORMANCE 10
TABLE 2.2: COST OF CAPITAL 17
TABLE 3.1: NOXEMISSIONS FROM COMBUSTION PLANTS 20
TABLE 3.2: CO2EMISSIONS FROM COMBUSTION PLANTS 20
TABLE 3.3: TRACE ELEMENTS FROM SOLID FUEL COMBUSTION 21
TABLE 3.4: SUMMARY OF ENVIRONMENTAL COSTS 22
TABLE 4.1: WORKFORCE REQUIREMENTS 25
TABLE 4.2: SITE AND INFRASTRUCTURE REQUIREMENTS 26
TABLE 5.1: SUMMARY OF STUDY OUTCOMES 27
TABLE 6.1: INPUTS REQUIRED FOR ELECTRCITYCOSTS.XLS 29
LIST OF FIGURES
Page
FIGURE 2.1: CAPITAL COSTS FOR COAL FIRED PLANT 4
FIGURE 2.2: O&M COSTS FOR COAL FIRED PLANT 4
FIGURE 2.3: CAPITAL COSTS FOR NATURAL GAS FIRED PLANT 5
FIGURE 2.4: O&M COSTS FOR GAS FIRED PLANT 6
FIGURE 2.5: CAPITAL COSTS FOR SOLAR PHOTOVOLTAIC 7
FIGURE 2.6: CAPITAL COSTS ASSUMED FOR SOLAR THERMAL PLANT 9
FIGURE 2.7: CAPITAL COSTS ASSUMED FOR WIND PLANT 10
FIGURE 2.8: CAPITAL COSTS ASSUMED FOR BIOMASS FIRED PLANT 13
FIGURE 2.9: CAPITAL COSTS FOR NUCLEAR PLANT 14
FIGURE 2.10: O&M COSTS FOR NUCLEAR PLANT 14
FIGURE 6.1: SPREADSHEET INPUT & DEFAULT VALUES 30
EXECUTIVE SUMMARY
The Queensland Department of Mines and Energy, through the QTHERM Program, has retained Ultra-Systems Technology Pty Ltd (UST) to develop the costs and implications of a range of options for bulk electricity generation and supply. The options ranged from different fossil fuels (coal, oil, gas), renewable energy sources (solar, wind, biomass, etc) and nuclear. This work was to provide a simplified comparison of the cost of electricity generation according to the type of fuel, generation technology and other site related variations. It was not meant as a definitive study to identify precise electricity generating costs, but was produced in an attempt to put the differences in costs in a global perspective.
The outcomes of this study are contained in this concise report that sets out the results of the work and includes a summary table setting out the advantages and disadvantages of each of the supply options. Also, a computer spreadsheet, setting out the costs of electricity
generation and supply from each of the options is provided. This spreadsheet can be used by interested parties to manipulate the costs to suit their own applications both in Australia and offshore, with particular reference to East Asian countries.
ELECTRICITY GENERATING COSTS
Electricity generation costs for fossil fuel and nuclear plants have been obtained from a report prepared by the Nuclear Energy Agency, the International Energy Agency and the
Organisation for Economic Cooperation and Development – “Projected Costs of Generating Electricity – Update 1998”.
Fossil Fuels
In the increasingly competitive market for electricity generation, two basic generation technologies have emerged as the “best practice” systems. These are:
For Coal, the Supercritical Pressure Steam Cycle
The latest boiler designs feature pulverised coal firing, with low NOx burners in a balanced draft or pressurised furnace. These units are generally fitted with advanced particulate removal systems in the flue gas stream. For high sulphur coals (as for most Northern Hemisphere coals), flue gas de-sulphurisation (FGD) equipment may also be fitted. Base capital costs are with unit size between about US$1,200/kW for a 200 MWe unit to US$900/kW for a 700 MWe unit.
The addition of FGD plant leads to higher capital and operating costs. An increase of around 8% of base capital costs was assumed, based on the IEA data. It was shown that FGD plant did not appear to increase O&M costs significantly.
The addition of de-NOx plant to reduce the NOx emissions also leads to higher capital and O&M costs. A value of 12% of base capital costs and an increase of 30% of O&M costs were assumed.
For Natural Gas, the Advanced Gas Turbine Cycle.
The latest gas turbine designs feature advanced low-NOx burners, high temperature
metallurgy in the turbine front rows, and modular turbine blade elements. Where the unit is to be used for intermediate to base load duty, the gas turbine is combined with a heat recovery steam generator (HRSG) and a steam turbine, leading to relatively high thermal efficiencies of up to 55%.
Base capital costs vary with unit size between about US$700/kW for a 300 MWe unit, to US$680/kW for a 500 MWe unit. The addition of de-NOx plant (SCR) on these units has been implemented on a few units and the additional costs are similar to those for coal fired plants. Oil Firing
Recent trends have seen OECD countries install almost no new generating units based on oil fuel alone and few sites exist where oil fuel alone offers the most economic choice for base load plant. Since there have been no new oil-fired plants installed and included in the IEA data, the capital costs for this option were notionally taken as 85% of the costs of coal-fired plant.
Renewable Energy Technologies
Solar Photovoltaic
Photovoltaic electricity generation systems are now in wide commercial use for both small and large-scale applications. The smaller applications, less than 100 W and upwards, include off grid and remote electricity supplies. Larger applications include up to 1 MW grid
connected arrays.
Cost of the technology is still high, compared with other electricity generation technologies. The capital cost for small, simple systems is US$4,000 to US$8,000/kW, depending upon requirements. For the larger AC grid connected systems of 500 kW to 1 MW and more, the capital cost is US$7,000/kW to US$5,500/kW.
Performance is dependent upon the availability of good sunlight and is best in clear, dry areas such as inland Australia. Performance is significantly degraded by cloud cover, haze and industrial pollution. Annual capacity factors range from 14% in the southern coastal regions of Australia to 20% in Central Australia.
Solar Thermal
Solar thermal systems are widely used for domestic and some industrial water heating but the technology is not currently commercially successful for power generation. There are a number of commercial development programs now going on to further develop the technology in Australia and overseas.
Capital cost of a 160 MW installation with natural gas back-up is estimated to be $US2,750/kW. More recent developments in Australia have identified the cost of new-generation technology at US$1,950/kW to US$2,700/kW for 200 MW plants.
Annual capacity factors are similar to solar PV systems, with capacity factors of 20% or less. Wind
Wind power is widely used for commercial power generation and there are almost 8,500 MW of wind generation now installed worldwide. Wind turbine technology is now mature and is fully commercial, from smaller 2.5 kW machines up to utility machines of 1.5 MW or more. Current capital costs for a 5 MW green fields development in Australia, consisting of 10 x 0.5 MWe units, are about $US1,120/kW. International costs for large commercial projects are $US1,100/kW, which this estimated to fall to $US800 to$US900.
The key factor governing performance and ultimately unit cost of energy output is the wind resource that is highly site specific and dependant on the prevailing wind velocity.
Biomass
Biomass-based power generation is a commercially proven option with its feasibility largely being dictated by the availability of a suitable biomass resource for use as a fuel. Combustion based steam plants using grate and to a lesser extent suspension firing systems are in wide use. Gasification of biomass for power generation is not so well developed but is recognised as a higher efficiency technology for future renewable energy projects.
Capital cost is technology dependent, and reflects strong economies of scale. Typically costs for a 100 MW sized plant are:
• Steam plant US$1,350/kW
• IGCC plant US$1,500/kW
Typically, biomass energy systems are operated in a co-generation mode and reflect the operational requirements of a host industry and so capacity factor may be lower than the capability of the equipment, particularly where the supply of the biomass fuel is seasonal.
Nuclear Energy
Capital costs for nuclear plants vary considerably depending on the type of plant and the country of installation. Capital costs were shown to range from US$2,000/kW for a 400 MWe unit to US$1,600/kW for a 1,400 MWe unit.
End-of-life costs were generally treated by adding an annual sum to the operating costs to provide a “fund” to meet these costs. For light water power reactors, the “fund” amounted to 1% of the electricity generation cost, on a discounted basis. This is approximately equivalent to 1.25% of the capital cost of the plant.
Future Trends in Electricity Costs
In the current global economic climate there are a number of factors that have changed to impact on the costs of electricity. These factors evolved due to the dramatic reform of the
energy industry in developed countries and will most likely happen in the developing countries in the near future. Significant issues include the following:
• The influence on the capital component of generating costs in the merchant market has caused Generators to select the best financing option for each plant investment.
• Market liberalisation has led to the buyer focussing on the type of plant design that will yield the maximum return on the investment. This has seen a shift to proven, reliable designs, with improved, lower cost maintenance requirements.
• As an outcome of this, Generators are able to enjoy higher average annual capacity factors (ACF’s) and amortise the capital charges over higher energy output (GWh).
• Equipment vendors have become more competitive. Recent Australian experience has seen vendors compete vigorously for turnkey plants, with contract prices reported as low as US$600/kWe (1998).
• Liberalised markets have seen significant reductions in O&M costs. Direct costs have fallen as a result of improved plant automation, maintenance staffing practices and the reorganisation of corporate practices. The cost of fuel has dropped with Generators seeking increased competition for all new supplies.
ENVIRONMENTAL ISSUES
Emissions from electricity generating plants vary widely and include emissions to the
atmosphere (particulates, SO2, NOx and CO2) and other discharges such as water and sewage discharges, nuclear waste, noise etc. These are summarised in Table 2 attached.
Environmental costs of electricity production are significant and depend on many factors related to fuel, plant technology, and environmental legislation at National and local level. The costs of environmental compliance emerge as a significant factor in the comparisons between different electricity generation options. Table 1 provides a summary of the
environmental costs associated with the fossil fuel and nuclear generation options considered in this study.
Table 1: Summary of Environmental Costs
Cost Item Coal-Fired Plant Gas-Fired CC Nuclear
Air pollution control 6 – 18 % 0 – 6 %
Cooling 0 – 2 % 0 – 3 %
Environmental charges 0 – 9 % 0 – 5 %
SO2 and NOx control 15 – 20 % Particulate control 3 – 4 %
Fuel disposal 1 – 4 %
Safety systems 15 – 45 %
SOCIAL/POLITICAL ISSUES
There is no doubt that the supply of electricity is vital to the development of any nation. This is particularly so for developing countries. The developed countries have been undergoing radical reform of their energy industries and some of those issues include:
• The current trend in developed economies is towards competitive, corporatised state-owned or privatised business units with generation, transmission and distribution businesses separated or sold and cross subsidies virtually eliminated.
• Electricity tariffs have fallen, particularly to industry, and economic activity has been improved.
• Markets have been established for electricity trading, just as for any other commodity, and competition to deliver cheaper electricity is vigorous and effective. New and sometimes non-conventional IPPs have entered the market to capitalise on opportunities such as cheap fuel supplies (eg renewables) or local industrial situations (eg co-generation). The development of large electricity generating projects requires a significant workforce for construction, ongoing management and operation of the plants. In addition, significant numbers are required to provide for related community infrastructure and family support and which can lead to a significant increase in the availability of local and National employment.
CALCULATION SPREADSHEET
A MS Excel97©1 spreadsheet has been developed (ElectricityCosts.xls) from the data evaluated in this study. The spreadsheet allows calculation of the cost of electricity from the various generation options, and is available on the 3.5” floppy disk attached to this report. The spreadsheet allows the user to enter data as required, or to use default values specified in the algorithms that are developed for the calculation of electricity costs
1
SUMMARY
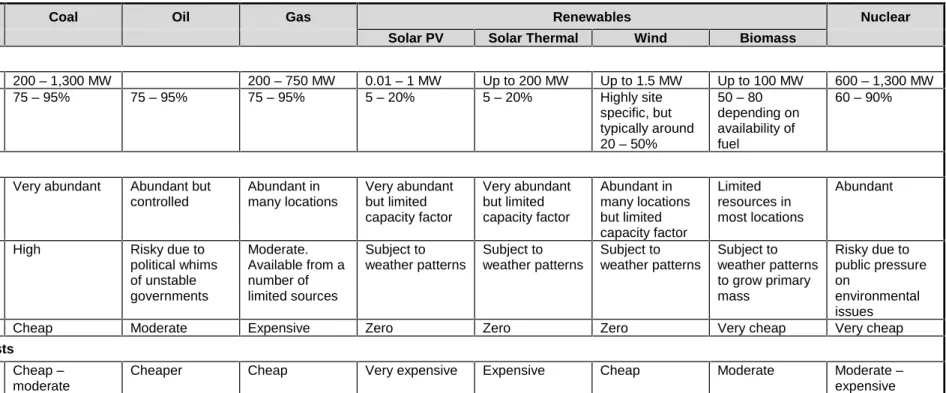
The following table summarises the general outcomes of this study and provides a quick reference on the costs of electric power from competitive sources.
Table 2 Summary of Study Outcomes
Coal Oil Gas Renewables Nuclear
Solar PV Solar Thermal Wind Biomass
Plant Details
Unit Size 200 – 1,300 MW 200 – 750 MW 0.01 – 1 MW Up to 200 MW Up to 1.5 MW Up to 100 MW 600 – 1,300 MW Capacity factor 75 – 95% 75 – 95% 75 – 95% 5 – 20% 5 – 20% Highly site
specific, but typically around 20 – 50% 50 – 80 depending on availability of fuel 60 – 90% Fuel Source
Abundance Very abundant Abundant but controlled Abundant in many locations Very abundant but limited capacity factor Very abundant but limited capacity factor Abundant in many locations but limited capacity factor Limited resources in most locations Abundant Security of supply
High Risky due to political whims of unstable governments Moderate. Available from a number of limited sources Subject to weather patterns Subject to weather patterns Subject to weather patterns Subject to weather patterns to grow primary mass Risky due to public pressure on environmental issues
Cost Cheap Moderate Expensive Zero Zero Zero Very cheap Very cheap
Power Plant Costs Capital Cheap –
moderate
Cheaper Cheap Very expensive Expensive Cheap Moderate Moderate – expensive
Coal Oil Gas Renewables Nuclear
Solar PV Solar Thermal Wind Biomass
Operating & maintenance
Cheap Cheap Cheap Moderate Expensive Cheap Moderate Moderate
Cost of electricity supply2 100 % Cheap 116 % Moderate 107 % Cheap 1,380 % Very expensive 725 % Very expensive 105 % Cheap 102 % Cheap 115 % Moderate Environmental Issues Polluting potential
High Moderate Low Very low Very low Very low Low Potentially very
high Difficulty of compliance Hard but technology has developed rapidly Moderate only due to high sulphur fuel oil
Easy Easy Easy Easy Moderate Difficult
Cost of compliance
High Moderate Low Very low Very low Very low Low High
Social/Political Issues Potential to fulfil community energy needs
Very high Possible but not currently in favour
High based on fuel availability
Very low Very low Low Low High but subject to public opinion Basis for reform
of energy market
High High but risk of fuel supply
High Low Low Low Low High but subject
to public opinion
2
1
INTRODUCTION
The Queensland Department of Mines and Energy, through the QTHERM Program, has retained Ultra-Systems Technology Pty Ltd (UST) to develop the costs and implications of a range of options for bulk electricity generation and supply. The options ranged from different fossil fuels (coal, oil, gas), renewable energy sources (solar, wind, biomass, etc) and nuclear. This work was to provide a simplified comparison of the cost of electricity generation according to the type of fuel, generation technology and other site related variations. It was not meant as a definitive study to identify precise electricity generating costs, but was produced in an attempt to put the differences in costs in a global perspective.
The outcomes of this study are contained in this concise report that sets out the results of the work and includes a summary table setting out the advantages and disadvantages of each of the supply options. Also, a computer spreadsheet, setting out the costs of electricity
generation and supply from each of the options is provided. This spreadsheet can be used by interested parties to manipulate the costs to suit their own applications both in Australia and offshore, with particular reference to East Asian countries.
The cost of bulk electricity ($/MWh) sent out from a power station is: ($/MWh) Out t Energy Sen Total Costs Annual Total y Supply Electricit Bulk of Cost =
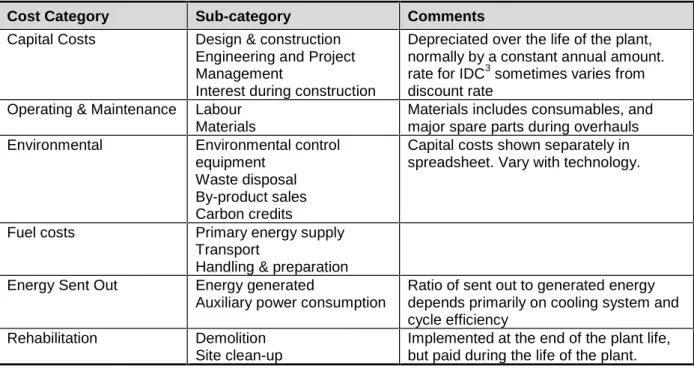
Costs of each of the plant options reviewed have been grouped in a number of categories, as set out in Table 1.1.
Table 1.1: Bulk Electricity Supply Costs
Cost Category Sub-category Comments
Capital Costs Design & construction Engineering and Project Management
Interest during construction
Depreciated over the life of the plant, normally by a constant annual amount. rate for IDC3 sometimes varies from discount rate
Operating & Maintenance Labour Materials
Materials includes consumables, and major spare parts during overhauls Environmental Environmental control
equipment Waste disposal By-product sales Carbon credits
Capital costs shown separately in spreadsheet. Vary with technology.
Fuel costs Primary energy supply Transport
Handling & preparation Energy Sent Out Energy generated
Auxiliary power consumption
Ratio of sent out to generated energy depends primarily on cooling system and cycle efficiency
Rehabilitation Demolition Site clean-up
Implemented at the end of the plant life, but paid during the life of the plant.
3
These cost elements were integrated into a Microsoft Excel spreadsheet that allows a user to enter their own data and produce comparisons specific to their particular applications. The report includes a brief summary of the environmental impact of each of the options, including greenhouse gases, liquid and solid wastes and visual impacts. In addition, an
evaluation of the potential of each option to add or remove from the greenhouse inventory and an estimate of the possible economic benefit/liability of each option in terms of carbon trading is included.
The report includes a summary of the main social and political impacts of each of the generation options considered. These will arise from issues including but not limited to: • Security of supply for the various technologies and the implication of this on industry,
commerce and the general community.
• Number of direct and indirect jobs to be created and maintained; provision for their housing, educational and ongoing training requirements; the impact of expatriate construction and project management teams on the local community.
• Site requirements including land acquisition, size, location, infrastructure, transportation and security; the financial and social impact of community enrichment and the necessary provision of social services.
• Consequences of exchange rate variations and risks associated with the surety of project financing.
2
ELECTRICITY GENERATING COSTS
2.1FOSSIL FUELS
Within this present study, the following fossil fuels have been examined: • Coal,
• Natural gas, and • Oil.
For the range of fossil fuels identified above, costs have been derived using the methodology set out in the International Energy Agency (IEA) publication “Projected Costs of Generating Electricity – Update 1998”4.
In the increasingly competitive market for electricity generation, two basic generation technologies have emerged as the “best practice” systems. These are:
2.1.1 For Coal, the Supercritical Pressure Steam Cycle
The latest boiler designs feature pulverised coal firing, with low NOx burners in a balanced draft or pressurised furnace. These units are generally fitted with advanced particulate removal systems in the flue gas stream. For high sulphur coals (as for most Northern Hemisphere coals), flue gas de-sulphurisation equipment may also be fitted. The flue gas clean-up systems add to capital and operating costs, although the trend in Europe, Japan and the US is for regulators to require such measures for new plants.
From the boiler, steam flows to a highly developed steam turbine, based on modular cylinder elements, fitted with up to eight stages of feedwater heating. Depending on fuel quality and cooling water conditions, cycle thermal efficiencies of up to 46% can be achieved.
Capital costs have been derived from the IEA report and are shown in Figure 2.1.
In many countries flue gas desulphurisation (FGD) is installed in new plants, particularly those that burn higher sulphur northern hemisphere black coals with up to 1.5 to 1.8% sulphur. This leads to higher capital and operating costs as shown. Costs for the addition of FGD plant have been included in the spreadsheet attached to this report, to permit the planner to include FGD as an option when evaluating the costs for coal-fired plant. A value of 8% of base capital costs has been assumed.
Also, the addition of de-NOx plant to reduce the emission of oxides of nitrogen is required in some countries for new plant. This also leads to increased capital and operating costs, also shown in Figure 2.1. A value of 12% of base capital costs has been assumed, based on the data provided in the IEA report4.
4 Nuclear Energy Agency/International Energy Agency/Organisation for Economic Cooperation and
0 200 400 600 800 1,000 1,200 1,400 1,600 0 100 200 300 400 500 600 700 800
Unit Size (MWe)
C a p ita l C o st ( U S $ /k W e ) PF FGD FGD+SCR
Figure 2.1: Capital Costs for Coal Fired Plant
O&M costs include all costs apart from the capital cost and fuel costs. They include maintenance workforce, consumables, credits from the sale of by-products and waste disposal. O&M cost for coal fired plants were derived from the IEA report4, as shown in Figure 2.2 0 10 20 30 40 50 60 70 80 90 0 200 400 600 800
Plant Size (MWe)
O & M C o s t ( U S $ /k W ) PF FGD FGD+SCR
Figure 2.2: O&M Costs for Coal Fired Plant
Although the data is very scattered, the “best fit” lines general show the expected downward trend as the unit size increases. The effect of FGD plant is shown to be minimal, but there is a significant increase in O&M costs due to the additional of de-NOx plant, being around a 30% increase over the base cost.
2.1.2 For Natural Gas, the Advanced Gas Turbine Cycle.
The latest gas turbine designs feature advanced low NOx burners, high temperature
metallurgy in the turbine front rows, and modular turbine blade elements. Where the unit is to be used for intermediate to base load duty, the gas turbine is combined with a heat recovery steam generator (HRSG) and a steam turbine, leading to relatively high thermal efficiencies of up to 55%. These machines have seen rapid improvements in recent years, and designs are available from a number of reputable makers at extremely competitive prices. The normal fuel for such plants is natural gas (both direct delivered by pipeline or through re-gasification of shipped LNG) although in some cases, liquid fuels – avgas or distillate, may be economic. Capital costs have been derived from the IEA report and are shown in Figure 2.3.
0 100 200 300 400 500 600 700 800 900 0 100 200 300 400 500 600 700 800
Unit Size (MWe)
Ca p ir ta l Co s t ( U S $ /k W e ) w/o SCR with SCR
Figure 2.3: Capital Costs for Natural Gas Fired Plant
Again, the data is very scattered, but shows a trend downwards as the unit size increases. The addition of de-NOx plant (SCR5) on these units is being implemented on a few units, but the costs are very scattered as shown. It has been assumed that the additional costs are similar to those for coal fired plants at 12% of base capital costs.
The two very low-cost plants with SCR in Figure 2.3 are a 1x250 MWe plant in the USA and a 2x680 MWe plant in Turkey. There is no obvious reason why these two plants should be significantly lower than the other plants.
O&M cost for gas fired plants were derived from the IEA report4, as shown in Figure 2.4
5
0 5 10 15 20 25 30 35 40 45 50 0 200 400 600 800 1,000 1,200
Unit Size (MWe)
O & M C o s t ( U S $ /k W ) w/o SCR with SCR
Figure 2.4: O&M Costs for Gas Fired Plant
Again, the data is very scattered but the “best fit” line shows a reasonable trend of O&M costs. Note that there does not appear to be any additional costs for de-NOx plant (SCR). Coal seam methane is a promising new fuel for base load gas turbines, and is often available at relatively low cost, although typically with lower specific energy than natural gas (often with some variability). This low cost fuel requires a more flexible energy conversion process. The economics of a merchant market plant would dictate a gas turbine, and the typically variable flow rates and specific energy of coal gas methane flow often dictate a smaller machine, with a combustion system capable of wide variations in fuel specific energy. This invariably leads to lower thermal efficiency, but may prove economic against other site alternatives.
2.1.3 Oil Firing
According to the IEA publication4, recent trends have seen OECD countries install almost no new generating units based on oil fuel alone. However, oil can provide useful fuel diversity for gas turbines (and for some coal fired sites at start-up or load stabilisation at up to say, 30% capacity) but few sites exist where oil fuel alone offers the most economic choice for base load plant. However, oil fuel is suitable for sites where the fuel delivery infrastructure is in place (such as many Pacific Islands) or where the planned capacity factor is low.
Since there have been no new oil-fired plants installed, the capital costs for this option have been notionally taken as 85% of the costs of coal-fired plant and O&M costs have been taken as 90% of the costs of coal-fired plant6.
6
2.2RENEWABLE ENERGY TECHNOLOGIES 2.2.1 Solar Photovoltaic
Photovoltaic electricity generation systems are now in wide commercial use for both small and large-scale applications. The smaller applications, less than 100 W and upwards, include off grid and remote electricity supplies such as for houses, villages and in specialised
communications applications. These small installations may be grid connected such as the systems now being installed in Europe, USA and Japan.
The larger applications include 1 MW grid connected arrays at Sacramento (USA), Italy and Spain. Energy Australia has a 500kW PV array at Singleton, NSW and larger 1 MW system is being investigated in Queensland and in other states in Australia.
Large systems are commercially available from a number of suppliers such as the major energy system developers (eg Enron, Shell, BP Solar, Solarex) and a large number of
engineering and commercial developers. Small systems are widely available from many local and overseas suppliers.
Cost of the technology is still high, compared with other electricity generation technologies. The capital cost for small, simple systems is US$4,000 to US$8,000/kW, depending upon requirements. For the larger AC grid connected systems of 500 kW to 1 MW and more, the capital cost is US$7,000 to US$5,500, although these costs are reducing progressively with technological advances and increased manufacturing capacities. Capital costs assumed for this study are illustrated in Figure 2.5.
0 2,000 4,000 6,000 8,000 0.0 0.5 1.0 1.5 2.0 2.5
Unit Size (MWe)
C a p ita l C o s t ( U S $ /k W e )
Figure 2.5: Capital Costs for Solar Photovoltaic
Operating costs are very low, comprising minimal maintenance and cleaning. It is estimated at about 0.5% of capital investment.
Performance is dependent upon the availability of good sunlight and is best in clear, dry areas such as inland Australia. Performance is significantly degraded by cloud cover, haze and industrial pollution. The estimation of performance requires a good knowledge of the solar resource that is site specific and requires separate consideration for different sites. Annual capacity factors range from 14% in the southern coastal regions of Australia to 20% in Central Australia.
2.2.2 Solar Thermal
Solar thermal systems are widely used for domestic and some industrial water heating but the technology is not currently commercially successful for power generation. There are 350 MW of hybrid gas/solar thermal generation plant (SEGS) operating in California but this has not been commercially successful. Technically, it operates well but the high capital cost and low annual capacity factor for solar operation makes this uneconomic.
There are a number of commercial development programs now going on to further develop the technology and to drive down costs, in Australia and overseas. Leaders are Solel (producers of the California plants), Steinmuller, Pilkington, AUSTA Energy and Pacific Power in Australia.
Capital cost of Californian-type 160 MW SEGS with natural gas back-up7 is $US2,750/kW. More recent developments in Australia8 have identified the cost of new-generation
technology, presently under development in Australia at US$1,950/kW to US$2,700/kW for 200 MW plants.
Developments now under way in Australia indicate solar supplementation of existing fossil fuel plant can be costed at around US$850/kW.
Capital costs assumed for this study are illustrated in Figure 2.6.
7 Pilkington Solar International, “Status Report on Solar Power Plants”, 1996.
8 Sinclair Knight Merz, “Technical evaluation and development plan for commercialising the Fresnel
0 1,000 2,000 3,000 4,000 0 50 100 150 200 250 300 350
Unit Size (MWe)
C a p ita l C o s t ( U S $ /k W e )
Figure 2.6: Capital Costs Assumed for Solar Thermal Plant
Operating and maintenance costs for the solar thermal plant are estimated to 2.6% of capital cost, based on data that shows maintenance costs between 2% and 3% of capital cost7 and estimates of 2.6% (200MW)8.
For pure solar plants (no energy storage) annual capacity factors are similar to solar
photovoltaic systems, with capacity factors of 20% or less. Most plants under consideration are hybrid with fossil fuel back up, and with overall capacity factor similar to typical fossil fuel plant, nominally, 90% for high availability base load plant. Solar contribution for these plants is 20% solar/80% fossil fuel.
2.2.3 Wind
Wind power is widely used for commercial power generation and there are almost 8,500 MW of wind generation now installed worldwide. New systems are being installed at 500 to 600 MW/year. Most of the growth is in Europe but there is significant growth in USA and Asia. Wind turbine technology is now mature and is fully commercial, from smaller 2.5 kW machines up to utility machines of 1.5 MW or more. Most utility sales are in the range 250 kW to 600 kW. Smaller off grid and RAPS machines are in the size range of 2.5 kW to 10 kW.
The utility market is dominated by European and US manufacturers, such as Vestas, Enercon, Zond, Micon and Nordex Balcke-Durr. The smaller “off grid” market includes emerging companies in Australia, such as Westwind.
Capital costs are reducing rapidly. Current prices for 5 MW green fields development in Australia, consisting of 10 x 0.5 MWe units, are about $US1,120/kW. International costs for
large commercial projects are $US1,100/kW, with this estimated to fall to $US800 to$US9009.
Capital costs assumed for this study are illustrated in Figure 2.7.
0 500 1,000 1,500
0.0 0.5 1.0 1.5 2.0 2.5
Unit Size (MWe)
C a p ita l C o s t ( U S $ /k W e )
Figure 2.7: Capital Costs Assumed for Wind Plant
Operating and maintenance costs are estimated at 2% of capital costs.
The key factor governing performance and ultimately unit cost of energy output is the wind resource. This is highly site specific and must be assessed by a specific site evaluation study. The impact of wind velocity upon performance, as defined by annual capacity factor, is illustrated by the data in the table below.
Table 2.1: Commercial Wind Turbine Performance
Annual Capacity Factor (%) Wind Velocity (m/sec) Typical Vestas V47-660 (660kW) Vestas V29-225 (225kW) Enercon E-30 5 15 14 16 15 6 24 24 26 22 7 34 34 35 32 8 42 42 43 42 10 56 55 57 15 100 100 100 100
Wind is highly regarded as a true renewable energy and as such it qualifies as “Green Energy”. However, it does have some environmental issues. In particular:
9
• Noise. Large wind turbines have a reputation for being noisy and so are not usually located within 1,000 m or more of houses or other noise sensitive areas.
• Visual. The wind turbine is usually located in an exposed, prominent area and so may be highly visual. Low level tree groves and hedge lines may not give sufficient screening. • In some locations, interference with telecommunications may occur if transmission passes
through the swept diameter of the turbine.
2.2.4 Hydro-electricity
The costs for hydro-electricity are very site specific and are grossly influenced by the
availability of water, the pressure head available, the proximity to load centres and the likely mode of operation (generally peaking load). In addition, most favourable sites for hydro-electricity have already been utilised in most developed countries, although there is significant potential for further exploitation in developing countries.
For these reasons, as in the IEA study4, these plants have been excluded from this study.
2.2.5 Biomass
Biomass-based power generation is a commercially proven option with its feasibility largely being dictated by the availability of a suitable biomass resource for use as a fuel. This biomass resource may include:
• Natural forests (eg eucalypt)
• Forest and mill residues and wastes from timber processing (eg forest floor waste, sawdust, mill off-cuts and paper industry waste).
• Agricultural and farming residues (eg straw, rice hulls, nut shells, bagasse, animal manure, abattoir waste).
• Weeds.
• Energy crops (eg eucalypt, willow, alfalfa).
There are examples of all these materials being used for commercial energy production, either in stand-alone plants or being co-fired in existing coal fired facilities10.
Some examples of projects are:
• 28 MW circulating fluidised bed power plant at Woodland in California burning wood waste, rice husks and rice straw.
10 Badin J and Kirschner J, “Biomass Greens US Power Production”, Renewable Energy World, Volume 1,
• 50 MW JC McNeil Power Station in Vermont, USA that has been generating electricity using wood waste in a conventional boiler for fourteen years. Overall efficiency of energy conversion was 25%. In a move to boost output and to increase energy conversion
efficiency, an IGCC fluidised bed gasification plant is being developed at the site. This new 62MW plant will have a conversion efficiency of 36%.
• At Varnamo in Sweden, a 6 MW electricaland 9 MW thermal combined cycle gasification plant is being developed, and is to be scaled up to 120 MW.
• The utility, Brista Kraft AB, is operating a 44 MW biomass-fuelled power plant outside Stockholm in Sweden. A Foster wheeler circulating fluidised bed boiler is fired with chipped wood and forest waste and electricity is produced in a conventional utility turbo-alternator.
These projects, above, represent larger scale activities. Many biomass sources, particularly residues, will only economically support relatively small operations because of the low energy density of biomass and the consequent high collection and transport costs. Capital and
operating costs of these smaller operations, say 10 MW or less, are relatively higher than the larger plants. On the other hand, they can be sited in factories for co-generation, near load centres, near biomass sources and their infrastructure requirements are less.
Biomass generation is commercially proven at both small and larger scale. Combustion based steam plants using grate and to a lesser extent suspension firing systems are in wide use. Gasification of biomass for power generation is not so well developed but is recognised as a higher efficiency technology for future renewable energy projects. It has the advantage of offering a path to electricity generation at higher conversion efficiency with lower emissions. For this reason, considerable development funding is being ploughed into biomass
gasification technology.
Capital cost is technology dependent, and reflects strong economies of scale. Costs of one biomass fuelled plant are given in the IEA paper and costs for a range of plants is given in an Ultra-Systems publication11. Typically costs for a 100 MW sized plant are:
• Steam plant US$1,350/kW
• IGCC plant US$1,500/kW
Capital costs assumed for this study are illustrated in Figure 2.8.
11 Ultra-Systems Technology Pty Ltd. Biomass Resources and their Use for Power Generation in Queensland.
0 500 1,000 1,500 2,000 2,500 0 50 100 150 200 250
Unit Size (MWe)
C a p ita l C o st ( U S $ /k W e )
Figure 2.8: Capital Costs Assumed for Biomass Fired Plant
Maintenance cost is typically 4% of capital cost, similar to smaller coal fired plant.
Capacity factor is estimated at 90%, on the assumption that dispatch is not limited by the load side capability of any interconnected electrical system. Typically, biomass energy systems are operated in a co-generation mode and reflect the operational requirements of a host industry and so capacity factor may be lower than the capability of the equipment, particularly where the supply of the biomass fuel is seasonal.
If the biomass is a residue or waste, the establishment of a biomass industry may present a low cost opportunity for disposal, in which case the project may accrue additional
environmental and cost benefits.
2.3NUCLEAR ENERGY
The capital costs for electricity derived from nuclear plants are shown in Figure 2.9 from the IEA report4. The O&M costs, also from the same report, are shown in Figure 2.10.
0 500 1,000 1,500 2,000 2,500 0 200 400 600 800 1000 1200 1400 1600
Unit Size (MWe)
C o s t ( U S$ /k W e )
Figure 2.9: Capital Costs for Nuclear Plant
0 10 20 30 40 50 60 70 0 500 1,000 1,500 2,000
Unit Size (MWe)
O & M C o s t ( U S $ /k W)
Figure 2.10: O&M Costs for Nuclear Plant
The treatment of the end-of-life costs for nuclear power plants varies widely12, with most countries effectively adding an annual sum to the operating costs to provide a “fund” to meet the assessed obligations of the facility.
For light water power reactors, the amount required to be set aside for all decommissioning activities (including reactor, and contributions to the fuel transport and fuel supply chain) amounted to 1% of the electricity generation cost13, on a discounted basis. This is
12 Future Financial Liabilities of Nuclear Activities – Nuclear Energy Agency (1996) – Table I 13
approximately equivalent to 1.25% of the capital cost of the plant. This value has been used in the spreadsheet accompanying this report.
2.4FUTURE TRENDS IN ELECTRICITY COSTS
In the current global economic climate there are a number of factors that have changed to impact on the costs of electricity. These factors evolved due to the dramatic reform of the energy industry in developed countries and will most likely happen in the developing countries in the near future. The reform issues are discussed in detail in Section 4.
The electricity generating costs discussed in the previous Section were derived from historical data from mainly government owned electricity authorities that were acting in a monopoly situation. The energy industry reform process has changed the economics of electricity generation and this is discussed in the following Sections.
2.4.1 Capital Investment Investment Cost
The influence on the capital component of generating costs in the deregulated merchant market has been profound.
In addition to studies to select the optimum plant type, size and market timing (including the significant effort to shift maximum risk to the plant vendors), the large merchant market Owners take great care to select the best financing option for each plant investment. This involves seeking and obtaining the maximum local taxation benefits, the willingness of local capital markets to contribute a high portion of the loan funds (thus minimising the exposure of the project to foreign exchange variations), and the minimisation of the Owners investment. Recent trends have seen merchant market plant Owners arrange attractive financing packages with Lenders whereby as little as 10% of equity contribution is required. As Owners typically require about 17 to 20% pre-tax return on equity (depending on the project risk factors), and Lenders typically require up to only 2% above local Government Loan rates, this allows the effective cost of capital to be only marginally higher than for Government funded projects. Up to this point in time, such novel financing arrangements established by the multi-national players have not been attractive to conservative Government agencies (or even locally based private utilities), and hence yield a significant benefit to the experienced market players. In this context, the recent MITI sponsored opening of the Japanese markets to competition has seen no Japanese utility secure the first three new IPP plants, and no Japanese equipment vendor secure any of the new plant so provided14.
Emphasis on Economic Designs
Market liberalisation leads to the buyer focussing on the type of plant design that will yield the maximum return on the investment. This has seen a shift to proven, reliable designs, with improved, lower cost maintenance requirements.
14
Owners are also allocating higher responsibility to the plant vendors, through harsh penalties for non-delivery of the guaranteed performance or availability levels. In a depressed plant market, vendors are accepting such increasing penalties as the price to pay to receive an order.
Improved Use of Generation Capacity
As an outcome of specifying and constructing more reliable plants, Owners are able to enjoy higher average annual capacity factors (ACF’s) and amortise the capital charges over higher energy output (GWh), leading to lower average production costs. Experience in the Victorian electricity system (Australia) has shown a remarkable increase in ACF, with some brown coal-fired stations lifting availability by over 20%.
In the nuclear industry, experience with standard designs has also led to an improvement in plant availability (US stations improved from 72 to 79% between 1992 and 1996).
The reformed are likely to see a decline in system spare plant margin, as average plant availability increases. Paradoxically, this should see an increase in the value of standby generation capacity to the system, a system service that has been traditionally undervalued. Clearly in most markets in transition, these values will change slowly over time, although regulators should ensure that they are taken into consideration when planning the regulatory regime.
Repowering
The economic life of the plant has a significant influence on the capital charges. Given the difficulty of securing new sites, one economic solution often proves to be the replacement of old generating units with later designs. The economic studies for such developments will need to factor in the value of the existing site infrastructure, such as cooling water, coal supplies and workforce.
Competitive Procurement
Increasing globalisation of trade has forced equipment vendors to become active in foreign markets, and compete with domestic (or traditional foreign) equipment suppliers.
Recent Japanese combined cycle plants were provided by US makers at prices much lower than for previous plants provided by local Japanese vendors.
Recent Australian experience with coal fired plant for Queensland has seen European, Japanese and US equipment vendors compete vigorously for turnkey plants, with contract prices reported as low as US$600/kWe (1998). However, although it could be expected to see lower prices than normal at these sites as they have limited sharing of site infrastructure, this price level was only 65% of the last Government-built plants under similar conditions.
Cost of Capital
The effect on capital charges per unit of electricity production arising from changes in the cost of capital under market liberalisation remains uncertain. Clearly, as private owners seek a higher return than State-owned Agencies, it might at first seem that unit capital changes
would be higher. However as already discussed many merchant market owners will strive to keep the actual equity very low, and seek low cost loan funds for the balance.
In the recent Australian market where new plants have been funded by a combination of owner-equity and external loan funds, the illustrative cost of capital is shown in Table 2.2. Table 2.2: Cost of Capital
Funding portion Government Owner Merchant Market Owner
Equity 7% on 5~15% of funds 17% on 5% of funds
Debt 6.2% on balance of funds 6.8% on 95% of funds
Effective Interest Rate 6.3% 7.3%
As the initial plant capital cost is lower than for traditional Government-owned plants by as much as 35%, the result of the merchant market owner requiring higher returns on a lower capital equity capital equates to a 19% reduction in annual capital charges.
However, on the broader question of the effect of using a higher discount rate to assess the project economics, this can certainly influence the choice of plant, and hence the unit capital cost. Higher project discount rates lead to the choice of lower-cost plant designs, and favour plant designs with low initial capital cost, but with higher O&M and fuel costs.
In developing countries, this will almost certainly favour plant types with lower initial capital costs (such as open- and combined-cycle gas turbine designs) against coal and nuclear plants. However, recent evidence from the Australian coal fired plant tenders suggests that current prices for sub-critical and super-critical designs were virtually identical, so coal-fired designs will need to be assessed on the higher efficiency of the super-critical design.
Thus, developing countries moving towards market reform will need to be aware that private generators may use higher discount rates in planning generation plant alternatives, and that this in turn will lead to possible differences in the types of plant adopted.
2.4.2 O&M costs
Liberalised markets have seen significant reductions in O&M costs. The direct operating costs include operating and maintenance labour and fuel, whilst the indirect operating costs include spare parts and corporate overheads.
The direct labour costs have fallen as a result of improved plant automation, with the Queensland plants being widely regarded as the world’s best practice in coal firing. For example, the Stanwell station of 4 x 350MW capacity has only three operators on the
weekend shifts, with all load following and hot starts achieved automatically. It is understood that the new Queensland stations now being built by merchant market owners will also feature similar staffing levels.
Current designs of natural gas fired combined cycle plants permit fully remote operation, with all functions achieved under automatic control. However, some owners prefer to retain staff members on site for physical checking. Similar automation levels and staffing philosophies are in place for nuclear plants.
Maintenance staffing practices have also changed as a result of competition, with a decreasing reliance on in-house staff and an increased reliance on external providers, including the plant vendors. The tendency to “outsource” the entire “operating and maintenance” function through a separate legal agreement is increasing, and in Australia and UK, plant vendors and Generators have emerged as major players in this market. For example, GEC (UK) operates a large workshop in Australia, capable of re-blading and balancing turbine rotors. Also, an eastern State Generator, Pacific Power, has recently secured the contract to operate and maintain a new 330 MWe coal-fired plant in Western Australia.
In the corporate headquarters, developments have been similarly taking place, with
reorganisation into business functional units leading to significant job losses. The shift from centralised planning to project-specific planning has led to much of the savings.
Arising from these initiatives, permanent staff levels among the Generators have dropped by between 3 and 13% as a result of competition15.
Fuel remains the most significant variable cost of operation, and merchant market plant owners have been quick to review any existing fuel supply agreements, and have sought increased competition for all new supplies. Developments in this area have produced
remarkable results. In NSW, recently corporatised Government Generators have used contract provisions to minimise purchases under long-term supply agreements with a single coal mine, and purchase the balance via an annual tender process, open to all fuel suppliers. In one case, this has led to fuel prices dropping from US$0.85/GJ delivered to US$0.65/GJ delivered, a 23% saving.
In Australia, deregulation of the natural gas industry is also proceeding, although the lack of any real competition in the gas pipeline (transport) industry may act to limit real savings at the delivery point. The key to gas price competition in any market is the availability of
independent gas suppliers, and a deregulated gas transport system.
For countries that have existing gas shipping import terminals, there is also the prospect of seeking competitive prices from a number of LNG suppliers. However, care should be taken to limit the “spot” purchases of fuel for base load plants, as these must be tied to storage capacities and fuel consumption.
In North America, a spot market for natural gas supply to power stations and other users has emerged which has seen buyers take about 15% of their needs from the market. The emerging market for spot coal sales in Australia seems to be moving towards the same 15% level. As the choice of future plant types will depend heavily on future fuel prices, Generators will examine a range of fuel supply options and pricing. Projections of future fuel price
movements are developed in the IEA report16, however, the very poor agreement between actual and projected17 coal and gas prices in past IEA reports should be noted.
15 IEA paper – Appendix 8 Table A8-3 16 IEA paper – Annex 5
17
3
ENVIRONMENTAL ISSUES
Emissions from electricity generating plants vary widely and are difficult to summarise within the space of this report. The main environmental issues relate to emissions to the atmosphere and to other discharges, such as water and sewage discharges, nuclear waste, noise etc. The following Sections set out a brief overview of these issues.
3.1ATMOSPHERIC EMISSIONS
Environmental legislation to limit atmospheric emissions from fossil fired plants varies between countries, with world-wide Greenhouse gas initiatives expected to result in common standards in the period beyond 2010. The main emissions of concern include particulates, oxides of sulphur and nitrogen (SO2 and NOx), as well as carbon dioxide (CO2) as the major greenhouse gas.
Particulates
Solid fuel fired plants emit particulates from the ash in the fuel. Legislation to limit the emission of particulates from solid fuel-fired plants generally requires that the concentration of particulates is less than about 50 mg/Nm3. Some countries, eg Japan, impose more
stringent emission limits according to locality and proximity of other emitters.
Coal-fired plants normally have electrostatic precipitators or fabric filters to clean the flue gas to very low concentrations of particulates before being emitted to the atmosphere. These devices are generally able to achieve these limits.
Sulphur Dioxide
The emission of SO2 is readily predicted from the sulphur content of the fuel being used, as most of this sulphur will be converted to SO2 during combustion. For example, coal with a 0.6 %adb sulphur content will emit about 350 ppm (dry, @ 6% O2) concentration in the flue gas. The legislated measurement for the impact of the sulphur compounds in Australia from all coal-burning facilities is the “Ground Level Concentration” of SO2, currently set to 50ppm at the station boundary. This level can be achieved when burning the low sulphur Australian coals in modern boiler plants, without the need for additional de-sulphurisation equipment fitted to the boiler flues.
Most modern coal-fired plants in Asia and Europe are currently fitted with flue gas desulphurisation (FGD) to reduce SO2 emissions to very low levels (about 90% removal). This plant exposes the sulphur oxides in the flue gas to activated calcium hydroxide (lime) surface, trapping the sulphur in the form of gypsum (CaSO4).
The fitting of FGD plant leads to higher capital costs, and increased operating costs due to calcium feedstock costs and fan power losses. It is estimated that FGD imposes an increase in capital costs of about 12% and a reduction of about 1% in sent out electricity. Current costs for the addition of FGD plant have been included in the spreadsheet attached to this report.
SO2 emissions for oil will relate to the sulphur content of the oil, but gas-fired plants will emit zero SO2, as will all of the renewable technologies and nuclear, with the exception of
biomass-fired plants. Biomass generally has a low sulphur content and therefore, low SO2 emissions.
Nitrogen Oxides
Coal-fired plant emit relatively high levels of NOx, compared to the other technologies considered in this study, however, all types of combustion will generate NOx. In these plants, the nitrogen in the coal produces most of the NOx emissions from coal, and is very sensitive to plant operating conditions, particularly the amount of mixing within the combustion zones of the boiler.
NOx reduction techniques include methods to control the mixing between the combustion air and the fuel. This can be achieved by a number of methods, but best done using specially designed “Low-NOx” burners. Other techniques for NOx reduction include injection of ammonia to chemically reduce the nitrogen oxides to N2, or by using selective catalytic reduction (SCR).
Table 3.1 sets out the rough emissions of NOx from each of the fuel type considered in this study.
Table 3.1: NOx Emissions from Combustion Plants
Fuel Type Uncontrolled Emissions Controlled Emissions
Coal 400 – 1,200 ppm 150 – 400 ppm with Low-NOx burners. Less than 100 ppm with SCR.
Oil 100 – 200 ppm Down to 50 ppm
Gas 50 – 100 ppm Down to 10 ppm
Renewables: Solar & wind Zero
Renewables: Biomass 200 – 400 ppm Generally no reduction mechanisms installed
Nuclear Zero
Carbon Dioxide
Emissions of CO2 vary for different fuels, mainly depending on their carbon to hydrogen ratio and the efficiency of utilisation. The estimated emissions are set out in Table 3.2.
Table 3.2: CO2 Emissions from Combustion Plants
Fuel Type Specific CO2 Emissions
(g/MJ)
Emissions from Plants (kg/MWh)
Coal 85 – 95 for bituminous coal 850 – 950 for subcritical units Down to 800 for supercritical
Oil 70 – 75 700 – 750
Gas 50 – 55 450 – 500
Renewables: Solar & wind Zero
Renewables: Biomass 90 – 100 >1,000
Note that combustion of biomass is considered CO2 neutral.
Gas-fired plants have the lowest greenhouse gas emissions, followed by oil, coal and biomass. However, it is generally recognised that the combustion of biomass is considered CO2 neutral as the emissions are sequestered in the next crop of biomass.
Table 3.2 only includes actual emissions at the point of combustion and no allowances have been made for “whole of life” emissions that accrue during manufacture of plant components. In this context, although solar PV do not produce any direct emissions, they do contribute substantial emissions due to manufacture of the fuel cells. Other renewables also contribute to emissions in a similar manner, but not to the extent of solar PV.
3.2OTHER DISCHARGES Solid Waste
Ash disposal from solid-fuel fired plants can cause problems due to the discharge of polluted water that has leached trace elements, such as arsenic and mercury, from the ash. A list of elements and their level of concern is set out in Table 3.3. In general, concentrations of trace elements in discharges from solid fuel fired plants are at levels below hazard levels. However, coal-fired plants are required to implement zero discharge of ash sluicing water.
Table 3.3: Trace Elements from Solid Fuel Combustion Element
Greatest Concern Moderate Concern Minor Concern
Arsenic Boron Cadmium Lead Mercury Molybdenum Selenium Chromium Copper Fluorine Nickel Vanadium Zinc Antimony Barium Beryllium Bromine Chloride Cobalt Germanium Lithium Manganese Strontium Tin
In addition to ash formed during combustion, solid wastes are derived from FGD system by-products. Most solids from oxidation type FGD systems are in the form of marketable gypsum and, thus, have relatively low discharge of solid material. Wet FGD processes, however, produce large quantities of moist sludge that must be disposed of.
Water Quality
Power plants generally only discharge treated water streams to avoid environmental problems. The main sources of waste water production are:
• Cooling tower blowdown, ie, the purge stream from recirculating cooling water systems. • Purge streams from forced oxidation FGD systems.
• Waste streams from other plant process operations, such as blowdown from boilers or demineralisation systems.
• Waste water from occasional cleaning or maintenance operations. • Water collected from site area drains, including around coal piles.
Nuclear Plants
The other potentially hazardous discharge of waste is from nuclear plants, where the risk if radioactive leakage and contamination is potentially disastrous.
Radioactive waste disposal is an area of significant cost for nuclear power plants. The costs of disposal of radioactive wastes are generally included primarily in fuel cycle costs. These entail temporary storage of fuel elements, transportation, and disposal of high level wastes from fuel and reprocessed fuel. All these elements have significant costs associated with environmental protection.
For nuclear plants, environmental protection relies heavily on systems to ensure plant safety. The fraction of generation for environmental protection in nuclear plants is greater than other types of plant due to the elaborate and costly systems to ensure this safety. It is suggested that up to 60% of the plant capital cost is related to environmental protection systems18. This represents about 45% of the levelised electricity generating cost.
3.3COST OF ENVIRONMENTAL COMPLIANCE
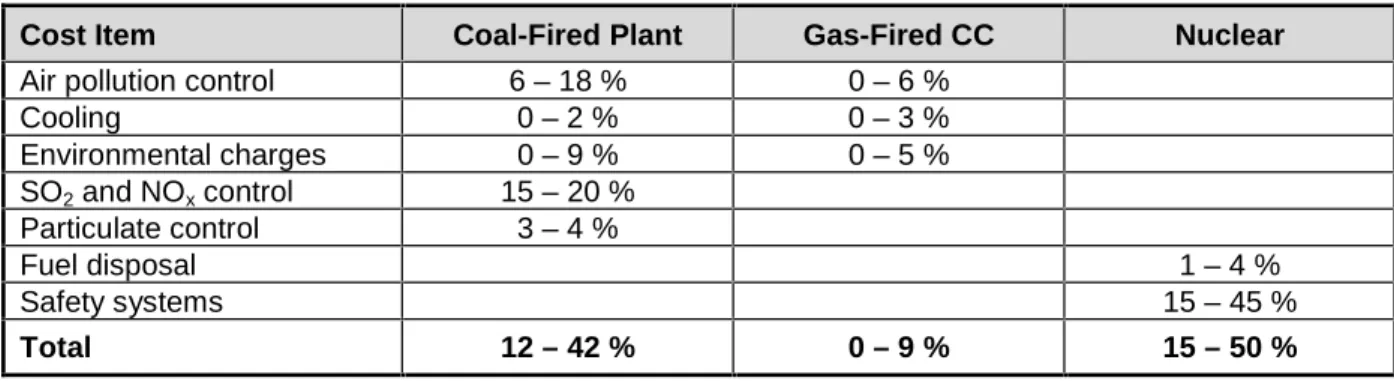
Environmental costs of electricity production are significant and depend on many factors related to fuel, plant technology, and environmental legislation at National and local level. These costs emerge as a significant factor in the comparisons between different electricity generation options. Table 3.4 provides a summary of the environmental costs associated with the fossil fuel and nuclear generation options considered in this study4.
Table 3.4: Summary of Environmental Costs
Cost Item Coal-Fired Plant Gas-Fired CC Nuclear
Air pollution control 6 – 18 % 0 – 6 %
Cooling 0 – 2 % 0 – 3 %
Environmental charges 0 – 9 % 0 – 5 %
SO2 and NOx control 15 – 20 % Particulate control 3 – 4 %
Fuel disposal 1 – 4 %
Safety systems 15 – 45 %
Total 12 – 42 % 0 – 9 % 15 – 50 %
18 Forsberg CW and Reich WJ, 1991. Worldwide Advanced Nuclear Power Reactors with Passive and Inherent
Safety: What, Why, How and Who. ORNL/TM-11907, Oak Ridge National Laboratory, Oak Ridge, TN, USA.
4
SOCIAL/POLITICAL ISSUES
There is no doubt that the supply of electricity is vital to the development of any nation. This is particularly so for developing countries. The following Sections outline some of the social and political issues that need to be addressed when considering options for electricity supply. The developed countries have been undergoing radical reform of their energy industries and some of those issues are also addressed here.
4.1ELECTRICITY PRICING POLICIES RELATED TO ECONOMIC GROWTH
Historically, government owned and operated electricity generation, transmission and
distribution authorities have acted as effective monopolies with limited accountability. Tariffs have been set to service capital, to provide for depreciation of assets and system development and to deliver community service obligations. In general, industrial and commercial tariffs have subsidised domestic tariffs. Generally, market forces have not been considered and reduced industry competitiveness has constrained national economic growth.
The current trend in developed economies is towards competitive, corporatised state-owned or privatised business units with generation, transmission and distribution businesses separated or sold and cross subsidies virtually eliminated.
Electricity tariffs have fallen, particularly to industry, and economic activity has been improved. Accountability to new owners and their boards has raised performance but increased asset utilisation has led to higher risks of outage and high short term pricing in response to shortages.
Markets have been established for electricity trading, just as for any other commodity, and competition to deliver cheaper electricity is vigorous and effective. New and sometimes non-conventional IPPs have entered the market to capitalise on opportunities such as cheap fuel supplies (eg renewables) or local industrial situations (eg co-generation). Typically, a truly competitive national electricity market can be expected to achieve 20% to 25% increase in productivity together with new job creation in industry. This is particularly evident in Victoria where an increase from 70% - 75% boiler availability to 85% - 90% was achieved after
privatisation of the industry.
4.2 POLITICAL, MANAGEMENT AND REGULATORY ISSUES 4.2.1 Establishing a Competitive National Energy Market
A competitive national energy market (NEM) requires a strong legislative and regulatory framework to provide for the following:
• National electricity code: This code describes the terms and rules for participation in the NEM for electricity generators, retailers, transmission and distribution network service providers, system operators and customers.
• National electricity code administrator: The administrator supervises implementation of the code, ensures that the market remains competitive, collects and publishes statistics and manages ongoing development of the code.
• NEM management company: The management company manages detailed market transactions, determines generator merit order dispatch and manages the power system in accordance with the code.
4.2.2 Costs of Regulatory Compliance
While “light handed” market regulation is generally desired, the reality in most jurisdictions is that this is more difficult and hence more costly. The regulatory instruments are generally embodied in market codes, generation and retail licences and related access and pricing arrangements and administered by a government appointed industry regulator.
The OECD has published an international standard on regulatory quality with a decision-making checklist that raises issues such as:
• Is government action justified? • Is the problem properly defined?
• Is regulation the best form of government action? • Do the benefits justify the cost?
• Is the regulation clear, consistent and comprehensible? • How will compliance be achieved?
However, as an alternative to prescriptive regulation, most competitive players in the international electricity supply industry find that the most cost-effective way to regulate its businesses is to lift international competitiveness and use performance based regulation. Strong co-operative input from the industry itself in designing the regulatory mechanisms is recommended. Experience in Australia shows that regulatory compliance is superior and customer costs lower with performance based regulation than prescriptive regimes.
Typically, the regulatory authority will have the following obligations and associated powers: • Issue licences to generators and distributors who meet licence terms
• Determine performance standards (including financial performance) for facilities and services provided by licensees
• Promote industry competition to secure optimum supply of electricity at reasonable prices • Safeguard consumer interests and ensure that demands are satisfied
• Promote national economic development
4.2.3 Dividend Requirements
It is natural that newly independent corporations, whether privately or publicly owned, will seek to achieve benchmark or higher dividend returns to satisfy their shareholders. However, it is necessary for the regulator to control the dividends of monopoly fixed assets at a level related to the long-term bond rate plus an acceptable risk premium. Higher returns are neither acceptable in the customer market nor would they promote efficient allocation of resources or management of assets.
Experience in countries that have already moved to a NEM shows that, while initial dividends appear attractive, as the market settles down and excess capacity is absorbed or
decommissioned, dividend returns and price earnings ratios became comparable to a wide range of industrial assets as would be expected.
4.3WORKFORCE AND THE COMMUNITY
Table 4.1 sets out the direct employment workforce numbers for the different energy sources considered, for both construction and ongoing management and operation. The Table does not include workforce numbers required to provide for related community infrastructure and family support and which can lead to a significant increase in the availability of local and National employment. As with any country it is assumed there is a reasonably well understood ratio between the direct workforce and the related community population. Table 4.1: Workforce Requirements
Construction Workforce O & M
Energy Source Unit Output
Peak Total Workforce
MW Number Man years Number
Fossil fuel energy
Coal fired 500 400 1000 250
100 200 450 150
Oil fired 500 300 600 200
100 150 250 100
Natural gas fired 500 250 500 150
100 125 200 75 Renewable energy Solar photovoltaic 1 30 10 5 0.2 20 5 3 Solar thermal 1 40 15 8 0.2 25 10 4 Wind 5 20 10 10 0.5 15 5 5 Biomass 40 50 60 30 5 30 25 15 Nuclear energy PWR/BWR 1000 1000 3000 300 PWR/BWR 500 700 2000 200