Mapping Population onto Priority
Conservation Areas
Proceedings of the
European Population Conference
(EPC),
Vienna, Austria
September 2010David López-Carr
Department of Geography, University of California, Santa Barbara
Matthew Erdman
Department of Environmental Studies, University of Maryland
Alex Zvoleff
Department of Geography, San Diego State University
Laurel Suter
Department of Geography, University of California, Santa Barbara
ABSTRACT
This project aims to research natural human population growth (excluding migration) in some of WWF’s priority places, by identifying the current stage of demographic transition in each and prevailing fertility and mortality rates. It also examines population growth rates, and other demographic and health factors. The aim of the analysis is to provide information to help WWF prioritize areas where it should focus future population-health-environment efforts as it scales up this approach within its priority places in the developing world. PHE approaches help improve access to voluntary family planning in areas where high population growth correlates with high
priority for biodiversity conservation. Along with contributing to improving human health and local communities’ quality of life in parts of the world where few public or private sector entities are investing, slowing population growth may mitigate major and long-term threats to key habitats and their rare and endangered wildlife species. Results show statistically significant patterns of higher population growth, fertility and mortality rates, and lower demand for family planning within versus outside priority places and in rural versus urban areas.
ACKNOWLEDGEMENTS
We would like to recognize those who contributed to this report. In WWF Judy Oglethorpe (Managing Director, People and Conservation Program) helped plan and oversee this work. Cara Honzak, PHE Senior Program Officer and Terri Lukas, PHE Manager in WWF-US provided much help and encouragement. Charles Huang and Emily Jones provided help with the maps. All or parts of the report were reviewed by Jay Gribble, Heather D’Agnes and Kathleen Mogelgaard. We are also indebted to the PHE experts on whose work we have attempted to build this evaluation, including Lynne Gaffikin, Leona D’Agnes, John Pielemeier, Lori Hunter, Richard and Cheryl Margoluis, Roger-Mark De Souza, Charles Teller, and Theresa Finn. We are very grateful to Sea World Bush Gardens for the generous funding support that made this work possible. .
INTRODUCTION
The developing world is urbanizing at a dizzying pace. Indeed, following UN projections it is likely that by 2050 the number of people added to developing world cities will exceed the number of people added to the planet’s population from all other regions combined (UN 2007). Yet despite unprecedented rates of rural out-migration in recent years, the destruction of the world’s most biodiverse forests has continued unabated. Despite a rapid decline in fertility throughout the developing world, and attendant arguments that population growth is no longer a problem, remote rural areas retain the highest levels of fertility on the planet, suffer extraordinarily high rates of maternal and infant mortality and morbidity to a host of tropical illnesses and malnutrition, and generally receive little or no access to health care. Nowhere on the planet is the interface of natural population growth, poverty, disease, and environmental change as dramatic as in some of the remote areas in the developing world, which often have high biodiversity value. Yet we know little about the problem other than what we glean from disconnected local case studies. An analysis that combines geographical conservation data with data from the Demographic and Health Surveys (DHS)- the standard source of information on health in the developing world- provides the ideal and logical mechanism to investigate links among natural population growth, health, poverty, and the environment in the developing world. Such analysis provides a framework that can be used to inform national, regional and global governmental and non-governmental organizational strategies on population (excluding migration), development, and environmental conservation.
Many local communities in remote areas of high biodiversity have been stewards of their environment for generations. In some places, people have moved more recently to forest frontiers and other remote areas. In addition, natural resources may be under pressure from external forces
such as commercial logging and fishing, impacting local people’s way of life. People living in these areas often lack livelihood alternatives. And because of their remoteness, they often have limited or no access to social services including education, health and family planning. This results in poor health, poverty, and continued natural population growth; frequent child bearing adversely affects maternal as well as child health. Women may want to limit and space their families, but do not have access to knowledge and services in order to do so. Whether migrants or locals, fertility tends to be higher in remote rural areas both because of lack of demand for family planning services (and attendant demand for child labor for subsistence farming) but also because of lack of access to family planning services (Carr et al 2006).
Population growth often places new pressure on natural systems, leading for example to opening of new areas for agriculture or subdivision of land, and greater pressure on natural resources. In addition, when people are unhealthy they may put additional pressures on the environment, extracting more resources to treat the sick or pay for treatment. Hence it becomes increasingly difficult for them to use their environment sustainably.
WWF partners with communities in many remote areas of the developing world to support them in sustainable use of natural resources and development. In many places communities cite lack of access to health services as a major problem. Since around 2003 WWF has been integrating health and family planning into its livelihoods and other community conservation work in sites in several developing countries. To date this has involved working with health partners to provide basic health services and voluntary family planning for local communities in pilot projects in Madagascar, Kenya, Democratic Republic of the Congo, Central African Republic, Cameroon, Philippines, India and Nepal. For example, in the Khata area of Nepal, WWF has helped improve community access to a variety of health and environmental services including: family planning, HIV/AIDS awareness and prevention, improved sanitation and water supplies, and fuel-efficient stoves and biogas units. In areas where similar projects have been carried out by WWF, improved family planning outreach and access to family planning commodities have resulted in increases in contraceptive prevalence rates
1that average between 2 to 10 percent per year of project operations.
Sites in this first round of WWF PHE projects were not selected on the basis of a health and
family planning needs assessment across WWF priority places2 in the developing world. Instead,
selection was based on a combination of factors: countries where donors were willing to fund projects; WWF field staff interested in piloting the PHE approach in those places; and in most cases, surveys among local communities in those places indicating that health services were a high priority and need. WWF would now like to scale up population-health-environment (PHE) efforts with a focus on where they are most needed in relation to its priority places around the globe, and where they are most likely to help alleviate negative environmental and social impacts of rapid population growth.
1 Contraceptive prevalence rate is the percentage of women between 15-49 years of age who are practicing,
or whose sexual partners are practicing, any form of contraception.
2WWF-US priority places are areas selected for conservation action based on the wealth and diversity of life they
From a previous study of developing world priority places supported by WWF-US, the places with the highest population growth rates (migration and natural increase) are the following: Amazon and Guianas, Borneo and Sumatra, Coastal East Africa, Congo Basin, Coral Triangle, Eastern Himalayas, Galapagos, Namib-Karroo, Madagascar, Mekong, and Mesoamerican Reef (Honzak et al., unpublished analysis). That analysis produced estimates of population doubling times in the priority places (if population continued to grow at its current rate) - the fastest being the Galapagos at 16 years, and Congo basin, Madagascar and Namib-Karroo next at around 25 years. These figures gave WWF cause for concern, with little guidance towards solutions. For instance,
how much of this growth is likely to be caused by migration and how much by natural increase?3
Where within a priority place are growth rates highest, indicating where PHE interventions might be most urgently needed? Where do these priority places lie along the arc of the demographic transition (from high birth and death rates to low birth and death rates) and why? For natural increase, we know that populations grow fastest during the middle transition period, when there is a bulge of population growth attributed to declining mortality and stalled or more slowly declining fertility. Demographic stage-sensitive interventions are useful for PHE implementation to have a more immediate positive impact on environmental conservation and human health. The theory of demographic transition is that as countries develop from pre-industrial to industrialized economic systems, they move from high birth and death rates to low birth and death rates; historically mortality declines occur much more rapidly than fertility declines, leading to rapid rates of growth during this period. For example, the promotion of basic health services is fundamental to reduce
infant mortality, so that couples start to want smaller families in the earliest stages of transition.4
Later, a greater focus on provision of family planning to meet latent demand allows families to have smaller, healthier families. And for migration, a host of very different interventions may be required.
WWF and CI have documented the types of interventions conservation organizations can take to reduce adverse impacts of migration (Oglethorpe et al. 2007), and this remains outside the scope of the current study. We can find out the rates of natural increase and demographic transition situation by analyzing a country’s Demographic and Health Survey (DHS) – such as trends in fertility, mortality, living standards, and provision of services. These comprehensive surveys are repeated periodically, and measure the national and provincial pulse of demographic transition.
The aim of this study is to provide information to facilitate population-health-environment efforts as it scales up this approach within its priority places in the developing world. The paper evaluates demographic dynamics in ten of the WWF-US priority places in the developing world with the highest population growth rates, for which DHS data were available. A single priority place may comprise only part of a single country or may cross national or international borders and be
comprised of entire countries and/or parts of several countries. Since population growth rates and
3 The rate of natural increase (RNI) equals the crude birth rate (CBR) minus the crude death rate (CDR) of a given
population. Absent migration, a positive RNI means population increase and a negative RNI means a population decrease.
4Stageof demographic transition (SDT) is an indicator of where a population stands in comparison to other populations in
terms of fertility, infant mortality, and population age structure. The SDT ranges from a minimum of 3 for populations with high fertility, high infant mortality, and a young age structure, to a maximum of 12 for older populations with low fertility, and low infant mortality.
other demographic variables can vary greatly within and between countries, the study used the smallest areas of analysis possible for which data were available.
HYPOTHESES
The analyses reported here are guided by three interrelated hypotheses:
• Population: Rural areas and areas inside the ten WWF priority places examined will be at
earlier stages of demographic transition, will experience higher population growth, and have more rapid doubling times than urban and less remote rural areas due to poor access to primary health care including family planning.
• Mortality: Rural areas and areas inside the WWF priority places examined will suffer higher
infant and child mortality.
• Fertility: Rural areas and areas inside the WWF priority places examined will experience
higher actual and wanted fertility, and will demonstrate a greater difference between actual and desired number of children and a lower desire to limit childbearing (among married women).
Methods
Data Collection
Ten WWF-US priority places were selected for this study on the basis of having the highest natural population growth rates (as indicated by a previous WWF analysis), and for which there were DHS data. To enable sufficient observations for statistical analysis, two priority places (Borneo-Sumatra and Coral Triangle) were aggregated into a single unit - as demonstrated in Table 2-6, for a final total of nine places used as units of analysis. These places are referred to as “aggregated priority places” throughout the body of this paper, even though some have been not been aggregated. When the paper refers to “BSCT,” this area includes Borneo-Sumatra and the Coral Triangle.
The ten WWF priority places examined contain portions of 49 different countries. Seven of these countries were ignored in this study due to the relatively small portion represented within a WWF priority place (Angola, Bangladesh, Botswana, Malawi, Nicaragua, Nigeria, and Zambia), and comprehensive DHS data were only available for 25 of the remaining 42 countries. As the standard source of information on health in the developing world, Demographic and Health Surveys (DHS) provide the ideal and logical mechanism to monitor health, poverty, mortality, and fertility in the developing world within a consistent framework that can be scaled up to regional and global scales. Since 1984, the DHS project has given technical assistance to over 240 surveys in more than 85 countries, with the aim of advancing global understanding of health and population patterns in the developing world. DHS boasts a worldwide reputation for nationally representative data collection and dissemination on fertility, family planning, maternal and child health, gender, HIV/AIDS, malaria, and nutrition (DHS 2010).
GIS methods
A Geographic Information System (GIS) provides an easy way to spatially visualize tabular data. ArcGIS, a common GIS application, was used for this analysis. Global Administrative Areas (GADM) database (http://www.gadm.org) database provides shapefiles for country borders, as well as for borders of multiple levels of administrative divisions. A base map was created using a country borders shapefile for the entire world (downloaded from http://www.gadm.org/world). Countries located within a priority place were selected from the attribute table, and exported into a new shapefile with the name of the priority place. As the regions for which DHS reported data were often not the same as the administrative boundary shapefiles, the shapefiles were modified to match the DHS regions. This entailed renaming administrative units within a DHS region to the same name, and then using the “Dissolve” tool to aggregate the administrative units based on name. After dissolving the regions for each country, the analysis involved re-opening each attribute table and added three columns (type=text): PriConZone, Country, and Region. In order to give a visual aid to rural and urban data, global urban and rural extents were downloaded from CIESEN
(http://sedac.ciesin.columbia.edu/gpw). These data were part of CIESEN’s Global Rural and Urban Mapping Project (GRUMP) and were supplemented with data from CIESEN’s Global Population of the World, v. 3 database (GPWv3). Finally, boundaries for the ten WWF priority places were added to the base map to show which regions were part of each priority place. The boundaries of the places were extracted from a dataset provided by WWF-US
(19_wwf_priority_new_0208.shp) that identified its 19 overall priority places. The inclusion criterion for political units considered within a priority place was limited to any portion of the political unit having territory within the priority place shapefile.
Analytical methods
One-tailed comparison of means t-tests were run to test our hypotheses regarding differences in population, fertility, and infant mortality parameters within and outside of
conservation areas as well as in urban versus rural areas. The rural and urban areas analyzed are not necessarily within a WWF global priority place. Rather they are all the rural and urban areas in all countries where WWF priority places are present. Our specific hypotheses are detailed in the following section. The t-test statistics take the form T = Z/s, where Z and s are functions of the
data. In the one-sample t-test Z is , where is the data’s sample mean, n is the sample
size, and σ is the population standard deviation; s in the one-sample t-test is , where is the
sample standard deviation. The principal assumptions underlying a t-test are that Z is governed by a normal distribution, and that Z and s are independent (Tabachnik 1996).
RESULTS
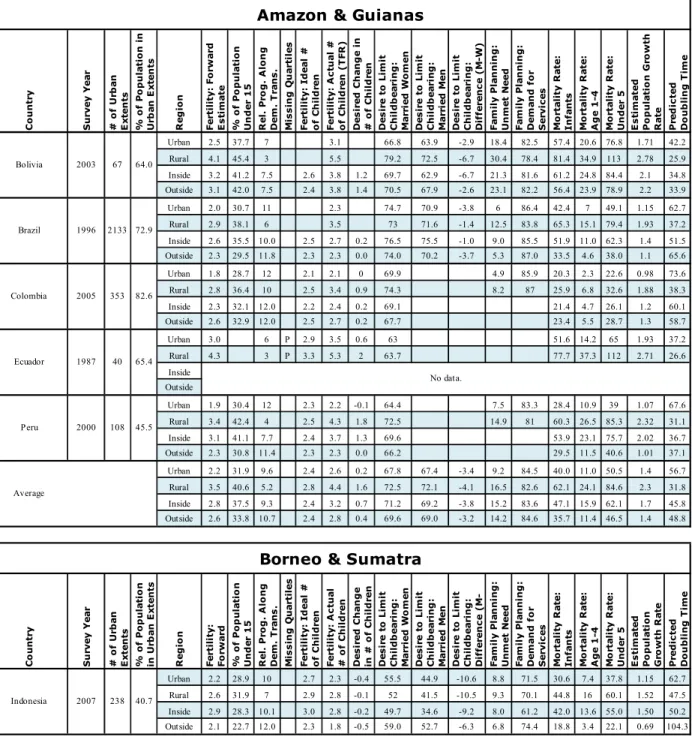
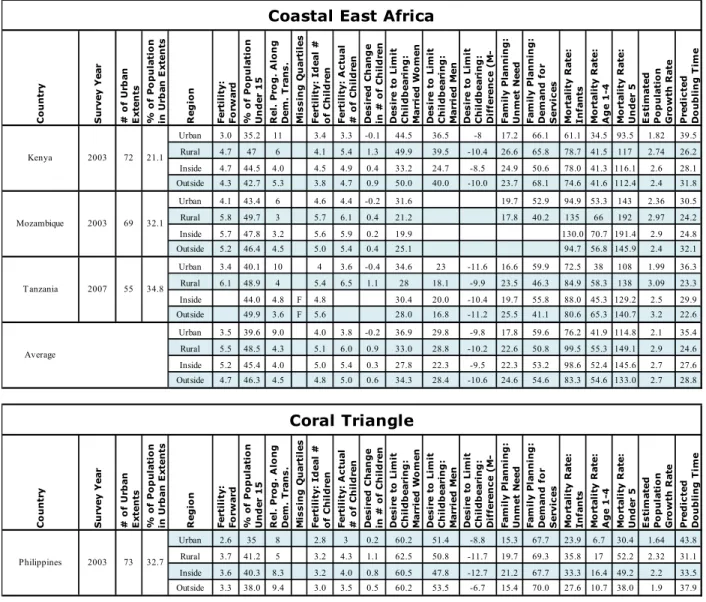
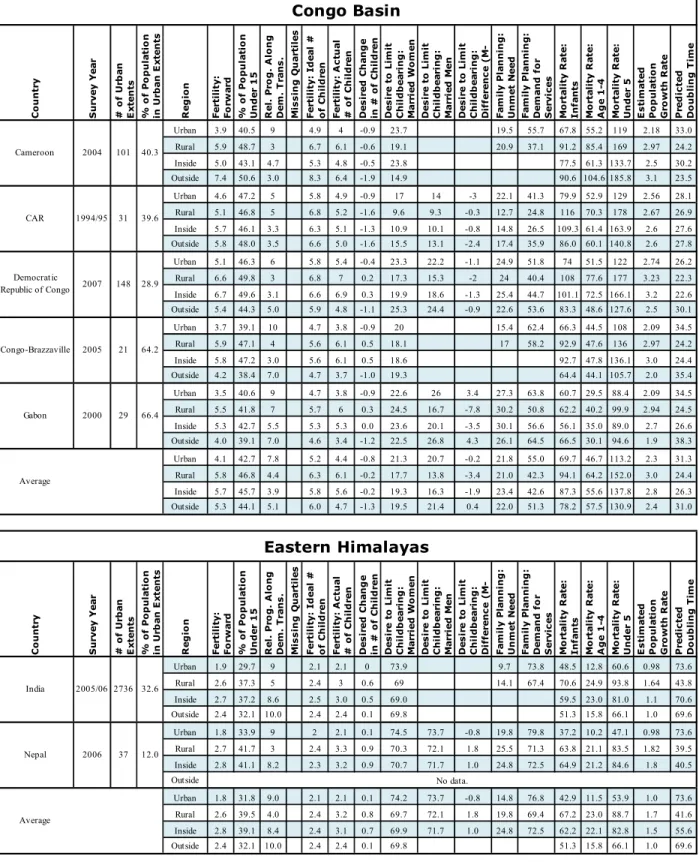
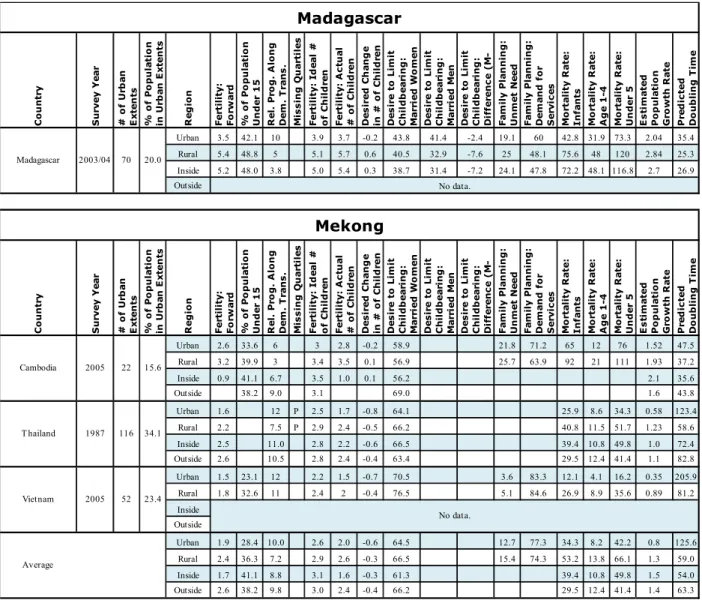
National level (unweighted) data are reported along with weighted means (calculated using the national level means) for the ten priority places in Table 1. Various population, health, and mortality indicators comparing rural versus urban and inside versus outside WWF priority places
demonstrate notable differences among priority places and comparing urban versus rural and inside versus outside priority places. These trends are spatially evident in the maps attached in the
Appendix. A clear trend emerges of higher population growth, fertility (calculated as the Total
Fertility Rate5, TFR ,forward estimate), and mortality in the Congo Basin followed by the Andes
region of the Amazon-Guianas. Also, lower population growth, fertility, and mortality are observed in the Asian priority places. Population growth, fertility, and mortality also remain consistently higher in rural versus urban areas and inside versus outside priority places. Further analysis remains unelaborated here due to sample-size limitations. To enable sufficient observations for statistical analysis, the Coral Triangle and Borneo-Sumatra were aggregated together in Tables 2-6. Results are displayed from comparison of means statistical tests between a. rural and urban and b. inside and outside WWF aggregated priority places. One-tailed statistical significance in means is reported at the 0.01, 0.05, and 0.10 probability levels at the global, continental, and aggregated priority place scales. The one-tailed distribution is consistent with our general hypotheses for each scale of analysis elaborated above.
Population
Table 2 displays several population trends comparing rural versus urban areas and inside versus outside aggregated priority places. Stage of demographic transition (SDT) is an indicator of where a population stands in comparison to other populations in terms of fertility, infant mortality, and population age structure. The SDT ranges from a minimum of 3 for populations with high fertility, high infant mortality, and a young age structure, to a maximum of 12 for older populations with low fertility, and low infant mortality. (See the corresponding map for these data labeled “Relative Progression Along Demographic Transition”). These results are evident at the aggregated priority place and continent scales in the stage of demographic transition (SDT). Values of the SDT are highest in the Asian urban population (mean SDT of 11.3) and lowest in the rural African population (mean SDT of 4.0). In accord with their SDT, the mean predicted doubling time in Africa (based on the DHS surveys we use) for the rural population is 24.6 years, compared to a mean doubling time of 86.1 years for the Asian urban population. Though the lowest values of the SDT occur in rural populations (the minimum being 3.5 in the rapidly growing Congo Basin), values of the SDT are also significantly lower in areas within aggregated priority places than in areas outside them (the SDT when all priority places are aggregated is 7.0 within priority places, 8.3 outside).
The estimated population growth rate expresses estimated population growth rate in percent per year while predicted doubling time expresses the estimated time it will take for a population to double (in years) based on the current estimated population growth rate. We do not make the assumption that population growth rates will remain constant over time, but doubling time is used to provide a snapshot perspective of current trends, enabling easier comprehension of statistics presented. As hypothesized, population growth is occurring fastest within rural areas and within aggregated priority places. Within every aggregated priority place, population growth rates and predicted doubling times
5Total fertility rate is the average number of live births per woman throughout her child bearing years if she were to
are higher in rural areas than in urban areas and are higher in areas within aggregated priority places than in areas outside. The African rural population is growing fastest (3.0% per year), where the Congo Basin as well as Madagascar have the highest infant mortality rates, child mortality rates, and population growth rates. The Asian urban population is growing slowest (1.1% per year mean population growth rate), with highest growth occurring in the Mekong and Eastern Himalayas aggregated priority places. While obvious differences in total population size means that the absolute number of people added yearly is larger in Asia than in Africa, despite higher growth rates in the latter, the rural Congo Basin has both higher growth rates and higher absolute growth in number of people than the rural areas of the BSCT.
Mortality
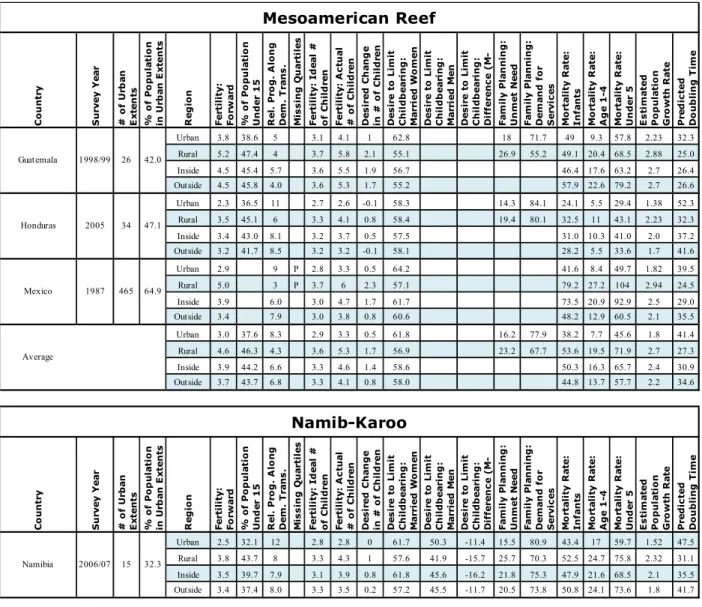
Table 3 examines mortality trends with a focus on where the majority of deaths occur in the aggregated priority places, among infants and children. Infant mortality expresses the number of infant deaths (under 1 year of age) per 1000 live births. Child Mortality represents the number of child deaths of children (under 5 years of age) per 1000 live births. Within every aggregated priority place, infant mortality rates and child mortality rates are higher in rural areas than in urban areas and (in every case except Mesoamerican Reef and Namib-Karoo) are higher in areas within aggregated priority places than in areas outside. To put these rates in a global context, infant mortality in the developed world is well below 10 deaths per 1,000 live births. In this study the range is in the 20s for developing urban areas to over 100 in rural areas of Coastal East Africa.
Fertility
Tables 4-6 express differences in actual versus wanted or ideal fertility.Total fertility rate is the
average number of births per woman throughout her lifetime, if she were to experience exact current age-specific fertility rates, estimated through aggregated five-year intervals. Consistent with the SDT results, total fertility rates are significantly higher in rural areas than in urban areas in every aggregated priority place, except for in BSCT, Madagascar, and the Mekong, where the difference exists but is insignificant. Rural areas in Namib-Karoo have the highest total fertility rates (mean rate of 6.2). Areas inside aggregated priority places in every case except BSCT and Coastal East Africa have higher total fertility rates than areas outside, though the difference is not always significant. The trend is most significant in Amazon and Guianas (3.4 inside, 2.6 outside) and in the Eastern
Himalayas (2.9 inside, 2.2 outside). In the latter case, fertility is approaching the replacement level of 2.1 births per woman achieved in developed countries.
Wanted fertility rate is the average number of wanted births per woman (it would equal the
total fertility rate were there no unwanted births).A birth is considered wanted if the number of
living children observed at the time of conception of the birth is less than the ideal number of
children as reported by the respondent.A caveat to this indicator is that it is subject to retrospective
adjustments. Potential bias may therefore be introduced in data collection. For example, women and couples may not be pleased to be expecting a birth at a given time, but are less likely to report that a child was unwanted following the child’s birth. Similar relationships are visible in wanted
fertility rates: rural areas and areas inside aggregated priority places have higher wanted fertility rates than urban areas and areas outside aggregated priority places. Rural Africa has the highest wanted fertility rates (mean of 5.2) and urban Asia and South America have the lowest (1.8). In Asia, the mean wanted fertility rate inside aggregated priority places (2.5) tops that in rural areas (2.3), and is significantly different from that outside (1.9).
Actual versus ideal number of children is the difference between the actual number of children each woman actually has and each woman’s declared ideal number of children. This measure differs from “wanted fertility rate”; the former subtracts actual versus reported unwanted births; the latter subtracts a stated perceived ideal number of children from the number of observed births. A negative number indicates women on average have fewer children than the ideal number, a positive number indicates they have more. Rural-urban differences, and differences between areas inside and outside aggregated priority places, are also visible when the actual versus ideal number of children is considered. Women in rural areas on average have more children than the ideal number in all aggregated priority places, with the exception of the Congo Basin and the Mekong (each of which is at opposite ends of the SDT spectrum). In Amazon and Guianas, the Eastern Himalayas, and the Mesoamerican Reef women in both rural and urban areas have more children than the ideal. The actual versus ideal number of children reported by women inside aggregated priority places is higher than that outside everywhere except the BSCT and Coastal East Africa, and is positive (meaning more children than the ideal) in all except the Congo Basin.
Desire to limit childbearing (married women) – The percentage of currently married women who want no more children. Family planning services (unmet need) – The percentage of currently married women who have unmet need for family planning services. In all aggregated priority places except the Mekong and Amazon and Guianas, fewer women in rural areas than in urban areas desire to limit childbearing. The difference is significant only in the Congo Basin and Amazon and Guianas (p < .10) and in the Mesoamerican Reef (p < .05). However, highly significant differences (p < .01) exist between areas inside and outside of priority places. In Asia and Africa as a whole, and in the BSCT, significantly fewer women inside the aggregated priority places desire to limit childbearing than do women outside. The same trend is observed in the Mekong (p < .05) and in Coastal East Africa / Namib Karoo (p < .10). In the BSCT, 60.1% of women outside the aggregated priority place desired no additional children, whereas within , only 52.3% of women wanted no additional children (p < .01). The Mekong region shows similar differences, with 65.2% of women outside the priority place wishing to limit their childbearing, while only 57.8% within have a similar desire (p < .05). In the worldwide mean of all the DHS data we analyzed in the project, the difference also holds (49.4% inside, 56.2% outside, p < .01). Only in Amazon and Guianas, the Congo Basin, and Namib-Karoo did more women within aggregated priority places express a desire to limit childbearing than those outside (although the difference is statistically insignificant).
Family planning services (demand) – Total demand, met or unmet. Family planning services (demand) measures the sum of the percentage of women who report met need and unmet need for family planning services. Because total demand conceals the important distinction between met and unmet need, we separate these two measures independently. We define met need as a reported desire to use family planning services and products that is satisfied by current availability of services.
Unmet need is defined as a reported desire to use family planning services and products that remains unsatisfied due to current lack of availability for the services.
Family planning services demand and unmet need show no consistent trends when comparing areas inside and outside of aggregated priority places. Clearer trends are visible when comparing urban and rural areas. In all aggregated priority places except for the Congo Basin, unmet need for family planning is highest in rural areas, though the difference is significant only in Coastal East Africa and the Mesoamerican Reef. Rural areas in the Congo Basin have the lowest demand for family planning services (39.6%), and a high unmet need (20.3%). The unmet need in urban areas of the Congo Basin is slightly higher (21.1%). Demand for family planning is highest in urban areas in all aggregated priority places except BSCT. The difference is only significant in the Congo Basin (p <.05).
Discussion and Conclusion
We undertook a demographic analysis of ten WWF priority places with high population growth rates in Africa, Asia, and Latin America. This is an effort towards guiding the design and location of future population-health-environment interventions, and supporting conservation activities in these areas. Specifically we identified, mapped, and statistically examined stage of demographic transition, natural population growth rates, infant and child mortality, fertility rates, and indicators of fertility demand. Our hypotheses of higher population growth, fertility rates, mortality, and lower demand for family planning services within versus outside of aggregated priority places and in rural versus urban areas were largely supported by the analysis.
While there are limitations to the data presented here, we hope that this analysis serves as a tool for conservation organizations to craft research-informed PHE program designs. WWF and partners have already used data from this report in planning PHE programs in Madagascar and Namibia. WWF is integrating information from the study into other programs, for example, climate adaptation training and planning. With future planning in mind, we elaborate several points as caveats and limitations to this research as well as potential avenues for future research. The first caveat is that geography matters. Particularly scale. Our results are a function of our units of analysis. The smallest scale we can use reliably here is the first sub-national level, or district. Unless the DHS greatly expands its sample size or specialized surveys are undertaken at local scales, the district, or in some cases the municipality, will remain the lowest common denominator for integrating further data layers (e.g. land coverage classifications). Easily modifiable in future research is the
inclusion/exclusion critieria for grouping of districts. For example, for this analysis we consider a district within a priority place if any portion of its territory overlaps with a priority place. This criterion could be changed, for example, to a minimum inclusion of 50% of the district within the priority place. Further, we separate overall (aggregated national level) rural vs urban (for all countries with at least a portion of their national territory within one of the 10 priority places); future research could usefully also examine rural vs urban differences inside vs outside priority places. Lastly, this study does not cover all areas within the WWF priority places. Rather it covers areas where DHS data are available. While this remains incomplete, it is the richest data available for the questions we
probe and affords sufficient spatial and temporal coverage to yield credible results. Any statistical differences between “inside” and “outside” priority places could be even more significantly divergent with more complete data coverage.
With these caveats expressed, based on the data examined here, it is possible to begin to prioritize among rural areas in priority places for future PHE interventions. While the majority of households surveyed in all priority places, save the Congo Basin, wish to limit childbearing, two geographic regions where investments in family planning are likely to have an impact on rapidly changing fertility, due to high unmet demand for family planning services, are Coastal East Africa and the Mesoamerican Reef. Demographic transition stage largely influences the findings here. For example, the Congo basin has low demand to limit childbearing in large part because infant mortality is still high; it is at an early stage of demographic transition as per those results. However, if much needed health services were provided in the Congo Basin, along with family planning services, child survival rates would increase, and couples would be more inclined to limit overall births. Under this scenario, once people have access to and knowledge about family planning, demand may grow very fast. Similarly, nearly a quarter of households in Coastal East Africa and the Mesoamerican Reef wish to have access to contraception yet their desire remains unfulfilled. Similarly, households within priority places in Coastal East Africa, the Mesoamerican Reef, Amazon and the Guianas and the Eastern Himalayas wish to have nearly one child fewer than they currently have.
While unmet demand is notable across priority areas, the lack of demand for family planning in priority places relative to non-priority regions is consistent with Caldwell’s (1976; 2007) notion of intergenerational wealth flows. According to this theory, at low levels of rural development, wealth flows from children to adults, for example through agricultural labor. As societies develop, women become educated, children attend school, and household heads find wage labor, a threshold is ultimately passed whereby wealth flows reverse and flow from parents to children. Once this transition occurs children become a financial burden rather than a source of economic stability. This transition is expected to influence downwards the ideal number of children and upwards the
demand for family planning. This theory is consistent with the unusually high fertility in remote rural areas, for example, in protected areas (Carr 2007). However, we also know that demand can be stimulated through increasing supply (Bongaarts 1987; Piotrow et al 1994).
Further research could usefully continue to fill in gaps between macro and micro scales, especially given the lack of demographic data available for small areas, particularly remote areas of high priority for conservation. Only with further refined data accompanied by qualitative on-the-ground field research can we credibly answer remaining questions such as why in Amazon and Guianas, the Congo Basin, and Namib-Karoo did more women within aggregated priority places express a desire to limit childbearing than those outside. The difference was statistically insignificant but was it meaningful? It is our hope that this report will serve as a catalyst for probing this and other questions with enhanced theoretical and methodological tools. Nevertheless, given
overwhelming statistically significant differences in mortality between rural-urban and aggregated priority place versus areas outside them, it does appear evident that rural areas within priority places should also become priority intervention areas for maternal and child health services.
REFERENCES
Bongaarts, J. (1978) A framework for analyzing the proximate determinants of fertility. Population and Development Review, 4, 105-132.
Caldwell, J. C. (1976) Toward a Restatement of Demographic Transition Theory. Population and Development Review, 2, 321-366.
Caldwell, J. (2007) The struggle for international consensus on population and development. Population and Development Review, 33, 179-181.
Carr, D. L. (2008). Farm households and land use in a core conservation zone of the Maya Biosphere Reserve, Guatemala. Human Ecology. 36(2): 231-248.
Carr, D. L. W. K. Pan and R.E. Bilsborrow (2006). Declining Fertility on the Frontier: The Ecuadorian Amazon. Population and Environment. 28(1): 17–39.
Center for International Earth Science Information Network (CIESIN), Columbia University; International Food Policy Research Institute (IPFRI); the World Bank; and Centro
Internacional de Agricultura Tropical (CIAT), 2004. Global Rural-Urban Mapping Project (GRUMP) alpha: GPW with Urban Reallocation (GPW-UR) Population grids. Palisades, NY: CIESIN, Columbia University. Available at http://sedac.ciesin.columbia.edu/gpw. Center for International Earth Science Information Network (CIESIN), Columbia University; and
Centro Internacional de Agricultura Tropical (CIAT), 2005. Gridded Population of the World (GPW), Version 3. Palisades, NY: CIESIN, Columbia University. Available at http://sedac.ciesin.columbia.edu/gpw.
DHS 2010. http://www.measuredhs.com/aboutdhs/ Global Administrative Areas database (GADM).
Global Administrative Areas shapefiles. Available at http://www.gadm.org.
Idaho State University (ISU)– GIS Training and Research Center. 1996. Major Cities of the World shapefile. Pocatello, ID. Available at
http://giscenter-sl.isu.edu/Other/World/world/cities.shp.
Macro International Inc, 2009. MEASURE DHS STATcompiler. http://www.measuredhs.com, December 23, 2009.
Piotrow, P. T., K. A. Treiman, S. H. Y. J.G.. Rioman II & B. V. Lozare (1994) Strategies for Family Planning Promotion. World Bank Technical Paper.
Tabachnick, B. & L. Fidell. 1996. Using Multiviariate Statistics. New York: Harper Collins College Publishers.
Table 1. National Level Data for each Priority Place C o u n tr y S u rv e y Y e a r # o f U rb a n E x te n ts % o f P o p u la ti o n i n U rb a n E x te n ts R e g io n F e rt il it y : F o rw a rd E s ti m a te % o f P o p u la ti o n U n d e r 1 5 R e l. P ro g . A lo n g D e m . T ra n s . M is s in g Q u a rt il e s F e rt il it y : I d e a l # o f C h il d re n F e rt il it y : A c tu a l # o f C h il d re n ( T F R ) D e s ir e d C h a n g e i n # o f C h il d re n D e s ir e t o L im it C h il d b e a ri n g : M a rr ie d W o m e n D e s ir e t o L im it C h il d b e a ri n g : M a rr ie d M e n D e s ir e t o L im it C h il d b e a ri n g : D if fe re n c e ( M -W ) F a m il y P la n n in g : U n m e t N e e d F a m il y P la n n in g : D e m a n d f o r S e rv ic e s M o rt a li ty R a te : I n fa n ts M o rt a li ty R a te : A g e 1 -4 M o rt a li ty R a te : U n d e r 5 E s ti m a te d P o p u la ti o n G ro w th R a te P re d ic te d D o u b li n g T im e Urban 2.5 37.7 7 3.1 66.8 63.9 -2.9 18.4 82.5 57.4 20.6 76.8 1.71 42.2 Rural 4.1 45.4 3 5.5 79.2 72.5 -6.7 30.4 78.4 81.4 34.9 113 2.78 25.9 Inside 3.2 41.2 7.5 2.6 3.8 1.2 69.7 62.9 -6.7 21.3 81.6 61.2 24.8 84.4 2.1 34.8 Outside 3.1 42.0 7.5 2.4 3.8 1.4 70.5 67.9 -2.6 23.1 82.2 56.4 23.9 78.9 2.2 33.9 Urban 2.0 30.7 11 2.3 74.7 70.9 -3.8 6 86.4 42.4 7 49.1 1.15 62.7 Rural 2.9 38.1 6 3.5 73 71.6 -1.4 12.5 83.8 65.3 15.1 79.4 1.93 37.2 Inside 2.6 35.5 10.0 2.5 2.7 0.2 76.5 75.5 -1.0 9.0 85.5 51.9 11.0 62.3 1.4 51.5 Outside 2.3 29.5 11.8 2.3 2.3 0.0 74.0 70.2 -3.7 5.3 87.0 33.5 4.6 38.0 1.1 65.6 Urban 1.8 28.7 12 2.1 2.1 0 69.9 4.9 85.9 20.3 2.3 22.6 0.98 73.6 Rural 2.8 36.4 10 2.5 3.4 0.9 74.3 8.2 87 25.9 6.8 32.6 1.88 38.3 Inside 2.3 32.1 12.0 2.2 2.4 0.2 69.1 21.4 4.7 26.1 1.2 60.1 Outside 2.6 32.9 12.0 2.5 2.7 0.2 67.7 23.4 5.5 28.7 1.3 58.7 Urban 3.0 6 P 2.9 3.5 0.6 63 51.6 14.2 65 1.93 37.2 Rural 4.3 3 P 3.3 5.3 2 63.7 77.7 37.3 112 2.71 26.6 Inside Outside Urban 1.9 30.4 12 2.3 2.2 -0.1 64.4 7.5 83.3 28.4 10.9 39 1.07 67.6 Rural 3.4 42.4 4 2.5 4.3 1.8 72.5 14.9 81 60.3 26.5 85.3 2.32 31.1 Inside 3.1 41.1 7.7 2.4 3.7 1.3 69.6 53.9 23.1 75.7 2.02 36.7 Outside 2.3 30.8 11.4 2.3 2.3 0.0 66.2 29.5 11.5 40.6 1.01 37.1 Urban 2.2 31.9 9.6 2.4 2.6 0.2 67.8 67.4 -3.4 9.2 84.5 40.0 11.0 50.5 1.4 56.7 Rural 3.5 40.6 5.2 2.8 4.4 1.6 72.5 72.1 -4.1 16.5 82.6 62.1 24.1 84.6 2.3 31.8 Inside 2.8 37.5 9.3 2.4 3.2 0.7 71.2 69.2 -3.8 15.2 83.6 47.1 15.9 62.1 1.7 45.8 Outside 2.6 33.8 10.7 2.4 2.8 0.4 69.6 69.0 -3.2 14.2 84.6 35.7 11.4 46.5 1.4 48.8 C o u n tr y S u rv e y Y e a r # o f U rb a n E x te n ts % o f P o p u la ti o n in U rb a n E x te n ts R e g io n F e rt il it y : F o rw a rd % o f P o p u la ti o n U n d e r 1 5 R e l. P ro g . A lo n g D e m . T ra n s . M is s in g Q u a rt il e s F e rt il it y : I d e a l # o f C h il d re n F e rt il it y : A c tu a l # o f C h il d re n D e s ir e d C h a n g e in # o f C h il d re n D e s ir e t o L im it C h il d b e a ri n g : M a rr ie d W o m e n D e s ir e t o L im it C h il d b e a ri n g : M a rr ie d M e n D e s ir e t o L im it C h il d b e a ri n g : D if fe re n c e ( M -F a m il y P la n n in g : U n m e t N e e d F a m il y P la n n in g : D e m a n d f o r S e rv ic e s M o rt a li ty R a te : I n fa n ts M o rt a li ty R a te : A g e 1 -4 M o rt a li ty R a te : U n d e r 5 E s ti m a te d P o p u la ti o n G ro w th R a te P re d ic te d D o u b li n g T im e Urban 2.2 28.9 10 2.7 2.3 -0.4 55.5 44.9 -10.6 8.8 71.5 30.6 7.4 37.8 1.15 62.7 Rural 2.6 31.9 7 2.9 2.8 -0.1 52 41.5 -10.5 9.3 70.1 44.8 16 60.1 1.52 47.5 Inside 2.9 28.3 10.1 3.0 2.8 -0.2 49.7 34.6 -9.2 8.0 61.2 42.0 13.6 55.0 1.50 50.2 Outside 2.1 22.7 12.0 2.3 1.8 -0.5 59.0 52.7 -6.3 6.8 74.4 18.8 3.4 22.1 0.69 104.3
Amazon & Guianas
Bolivia 2003 67 64.0 Brazil 1996 2133 72.9 Colombia 2005 353 82.6 Ecuador 1987 40 65.4 No data. Peru 2000 108 45.5 Average
Borneo & Sumatra
Table 1. Continued C o u n tr y S u rv e y Y e a r # o f U rb a n E x te n ts % o f P o p u la ti o n in U rb a n E x te n ts R e g io n F e rt il it y : F o rw a rd % o f P o p u la ti o n U n d e r 1 5 R e l. P ro g . A lo n g D e m . T ra n s . M is s in g Q u a rt il e s F e rt il it y : I d e a l # o f C h il d re n F e rt il it y : A c tu a l # o f C h il d re n D e s ir e d C h a n g e in # o f C h il d re n D e s ir e t o L im it C h il d b e a ri n g : M a rr ie d W o m e n D e s ir e t o L im it C h il d b e a ri n g : M a rr ie d M e n D e s ir e t o L im it C h il d b e a ri n g : D if fe re n c e ( M -F a m il y P la n n in g : U n m e t N e e d F a m il y P la n n in g : D e m a n d f o r S e rv ic e s M o rt a li ty R a te : I n fa n ts M o rt a li ty R a te : A g e 1 -4 M o rt a li ty R a te : U n d e r 5 E s ti m a te d P o p u la ti o n G ro w th R a te P re d ic te d D o u b li n g T im e Urban 3.0 35.2 11 3.4 3.3 -0.1 44.5 36.5 -8 17.2 66.1 61.1 34.5 93.5 1.82 39.5 Rural 4.7 47 6 4.1 5.4 1.3 49.9 39.5 -10.4 26.6 65.8 78.7 41.5 117 2.74 26.2 Inside 4.7 44.5 4.0 4.5 4.9 0.4 33.2 24.7 -8.5 24.9 50.6 78.0 41.3 116.1 2.6 28.1 Outside 4.3 42.7 5.3 3.8 4.7 0.9 50.0 40.0 -10.0 23.7 68.1 74.6 41.6 112.4 2.4 31.8 Urban 4.1 43.4 6 4.6 4.4 -0.2 31.6 19.7 52.9 94.9 53.3 143 2.36 30.5 Rural 5.8 49.7 3 5.7 6.1 0.4 21.2 17.8 40.2 135 66 192 2.97 24.2 Inside 5.7 47.8 3.2 5.6 5.9 0.2 19.9 130.0 70.7 191.4 2.9 24.8 Outside 5.2 46.4 4.5 5.0 5.4 0.4 25.1 94.7 56.8 145.9 2.4 32.1 Urban 3.4 40.1 10 4 3.6 -0.4 34.6 23 -11.6 16.6 59.9 72.5 38 108 1.99 36.3 Rural 6.1 48.9 4 5.4 6.5 1.1 28 18.1 -9.9 23.5 46.3 84.9 58.3 138 3.09 23.3 Inside 44.0 4.8 F 4.8 30.4 20.0 -10.4 19.7 55.8 88.0 45.3 129.2 2.5 29.9 Outside 49.9 3.6 F 5.6 28.0 16.8 -11.2 25.5 41.1 80.6 65.3 140.7 3.2 22.6 Urban 3.5 39.6 9.0 4.0 3.8 -0.2 36.9 29.8 -9.8 17.8 59.6 76.2 41.9 114.8 2.1 35.4 Rural 5.5 48.5 4.3 5.1 6.0 0.9 33.0 28.8 -10.2 22.6 50.8 99.5 55.3 149.1 2.9 24.6 Inside 5.2 45.4 4.0 5.0 5.4 0.3 27.8 22.3 -9.5 22.3 53.2 98.6 52.4 145.6 2.7 27.6 Outside 4.7 46.3 4.5 4.8 5.0 0.6 34.3 28.4 -10.6 24.6 54.6 83.3 54.6 133.0 2.7 28.8 C o u n tr y S u rv e y Y e a r # o f U rb a n E x te n ts % o f P o p u la ti o n in U rb a n E x te n ts R e g io n F e rt il it y : F o rw a rd % o f P o p u la ti o n U n d e r 1 5 R e l. P ro g . A lo n g D e m . T ra n s . M is s in g Q u a rt il e s F e rt il it y : I d e a l # o f C h il d re n F e rt il it y : A c tu a l # o f C h il d re n D e s ir e d C h a n g e in # o f C h il d re n D e s ir e t o L im it C h il d b e a ri n g : M a rr ie d W o m e n D e s ir e t o L im it C h il d b e a ri n g : M a rr ie d M e n D e s ir e t o L im it C h il d b e a ri n g : D if fe re n c e ( M -F a m il y P la n n in g : U n m e t N e e d F a m il y P la n n in g : D e m a n d f o r S e rv ic e s M o rt a li ty R a te : I n fa n ts M o rt a li ty R a te : A g e 1 -4 M o rt a li ty R a te : U n d e r 5 E s ti m a te d P o p u la ti o n G ro w th R a te P re d ic te d D o u b li n g T im e Urban 2.6 35 8 2.8 3 0.2 60.2 51.4 -8.8 15.3 67.7 23.9 6.7 30.4 1.64 43.8 Rural 3.7 41.2 5 3.2 4.3 1.1 62.5 50.8 -11.7 19.7 69.3 35.8 17 52.2 2.32 31.1 Inside 3.6 40.3 8.3 3.2 4.0 0.8 60.5 47.8 -12.7 21.2 67.7 33.3 16.4 49.2 2.2 33.5 Outside 3.3 38.0 9.4 3.0 3.5 0.5 60.2 53.5 -6.7 15.4 70.0 27.6 10.7 38.0 1.9 37.9
Coastal East Africa
Kenya 2003 72 21.1 Mozambique 2003 69 32.1 T anzania 2007 55 34.8 Average Coral Triangle Philippines 2003 73 32.7
Table 1. Continued C o u n tr y S u rv e y Y e a r # o f U rb a n E x te n ts % o f P o p u la ti o n in U rb a n E x te n ts R e g io n F e rt il it y : F o rw a rd % o f P o p u la ti o n U n d e r 1 5 R e l. P ro g . A lo n g D e m . T ra n s . M is s in g Q u a rt il e s F e rt il it y : I d e a l # o f C h il d re n F e rt il it y : A c tu a l # o f C h il d re n D e s ir e d C h a n g e in # o f C h il d re n D e s ir e t o L im it C h il d b e a ri n g : M a rr ie d W o m e n D e s ir e t o L im it C h il d b e a ri n g : M a rr ie d M e n D e s ir e t o L im it C h il d b e a ri n g : D if fe re n c e ( M -F a m il y P la n n in g : U n m e t N e e d F a m il y P la n n in g : D e m a n d f o r S e rv ic e s M o rt a li ty R a te : I n fa n ts M o rt a li ty R a te : A g e 1 -4 M o rt a li ty R a te : U n d e r 5 E s ti m a te d P o p u la ti o n G ro w th R a te P re d ic te d D o u b li n g T im e Urban 3.9 40.5 9 4.9 4 -0.9 23.7 19.5 55.7 67.8 55.2 119 2.18 33.0 Rural 5.9 48.7 3 6.7 6.1 -0.6 19.1 20.9 37.1 91.2 85.4 169 2.97 24.2 Inside 5.0 43.1 4.7 5.3 4.8 -0.5 23.8 77.5 61.3 133.7 2.5 30.2 Outside 7.4 50.6 3.0 8.3 6.4 -1.9 14.9 90.6 104.6 185.8 3.1 23.5 Urban 4.6 47.2 5 5.8 4.9 -0.9 17 14 -3 22.1 41.3 79.9 52.9 129 2.56 28.1 Rural 5.1 46.8 5 6.8 5.2 -1.6 9.6 9.3 -0.3 12.7 24.8 116 70.3 178 2.67 26.9 Inside 5.7 46.1 3.3 6.3 5.1 -1.3 10.9 10.1 -0.8 14.8 26.5 109.3 61.4 163.9 2.6 27.6 Outside 5.8 48.0 3.5 6.6 5.0 -1.6 15.5 13.1 -2.4 17.4 35.9 86.0 60.1 140.8 2.6 27.8 Urban 5.1 46.3 6 5.8 5.4 -0.4 23.3 22.2 -1.1 24.9 51.8 74 51.5 122 2.74 26.2 Rural 6.6 49.8 3 6.8 7 0.2 17.3 15.3 -2 24 40.4 108 77.6 177 3.23 22.3 Inside 6.7 49.6 3.1 6.6 6.9 0.3 19.9 18.6 -1.3 25.4 44.7 101.1 72.5 166.1 3.2 22.6 Outside 5.4 44.3 5.0 5.9 4.8 -1.1 25.3 24.4 -0.9 22.6 53.6 83.3 48.6 127.6 2.5 30.1 Urban 3.7 39.1 10 4.7 3.8 -0.9 20 15.4 62.4 66.3 44.5 108 2.09 34.5 Rural 5.9 47.1 4 5.6 6.1 0.5 18.1 17 58.2 92.9 47.6 136 2.97 24.2 Inside 5.8 47.2 3.0 5.6 6.1 0.5 18.6 92.7 47.8 136.1 3.0 24.4 Outside 4.2 38.4 7.0 4.7 3.7 -1.0 19.3 64.4 44.1 105.7 2.0 35.4 Urban 3.5 40.6 9 4.7 3.8 -0.9 22.6 26 3.4 27.3 63.8 60.7 29.5 88.4 2.09 34.5 Rural 5.5 41.8 7 5.7 6 0.3 24.5 16.7 -7.8 30.2 50.8 62.2 40.2 99.9 2.94 24.5 Inside 5.3 42.7 5.5 5.3 5.3 0.0 23.6 20.1 -3.5 30.1 56.6 56.1 35.0 89.0 2.7 26.6 Outside 4.0 39.1 7.0 4.6 3.4 -1.2 22.5 26.8 4.3 26.1 64.5 66.5 30.1 94.6 1.9 38.3 Urban 4.1 42.7 7.8 5.2 4.4 -0.8 21.3 20.7 -0.2 21.8 55.0 69.7 46.7 113.2 2.3 31.3 Rural 5.8 46.8 4.4 6.3 6.1 -0.2 17.7 13.8 -3.4 21.0 42.3 94.1 64.2 152.0 3.0 24.4 Inside 5.7 45.7 3.9 5.8 5.6 -0.2 19.3 16.3 -1.9 23.4 42.6 87.3 55.6 137.8 2.8 26.3 Outside 5.3 44.1 5.1 6.0 4.7 -1.3 19.5 21.4 0.4 22.0 51.3 78.2 57.5 130.9 2.4 31.0 C o u n tr y S u rv e y Y e a r # o f U rb a n E x te n ts % o f P o p u la ti o n in U rb a n E x te n ts R e g io n F e rt il it y : F o rw a rd % o f P o p u la ti o n U n d e r 1 5 R e l. P ro g . A lo n g D e m . T ra n s . M is s in g Q u a rt il e s F e rt il it y : I d e a l # o f C h il d re n F e rt il it y : A c tu a l # o f C h il d re n D e s ir e d C h a n g e in # o f C h il d re n D e s ir e t o L im it C h il d b e a ri n g : M a rr ie d W o m e n D e s ir e t o L im it C h il d b e a ri n g : M a rr ie d M e n D e s ir e t o L im it C h il d b e a ri n g : D if fe re n c e ( M -F a m il y P la n n in g : U n m e t N e e d F a m il y P la n n in g : D e m a n d f o r S e rv ic e s M o rt a li ty R a te : I n fa n ts M o rt a li ty R a te : A g e 1 -4 M o rt a li ty R a te : U n d e r 5 E s ti m a te d P o p u la ti o n G ro w th R a te P re d ic te d D o u b li n g T im e Urban 1.9 29.7 9 2.1 2.1 0 73.9 9.7 73.8 48.5 12.8 60.6 0.98 73.6 Rural 2.6 37.3 5 2.4 3 0.6 69 14.1 67.4 70.6 24.9 93.8 1.64 43.8 Inside 2.7 37.2 8.6 2.5 3.0 0.5 69.0 59.5 23.0 81.0 1.1 70.6 Outside 2.4 32.1 10.0 2.4 2.4 0.1 69.8 51.3 15.8 66.1 1.0 69.6 Urban 1.8 33.9 9 2 2.1 0.1 74.5 73.7 -0.8 19.8 79.8 37.2 10.2 47.1 0.98 73.6 Rural 2.7 41.7 3 2.4 3.3 0.9 70.3 72.1 1.8 25.5 71.3 63.8 21.1 83.5 1.82 39.5 Inside 2.8 41.1 8.2 2.3 3.2 0.9 70.7 71.7 1.0 24.8 72.5 64.9 21.2 84.6 1.8 40.5 Outside Urban 1.8 31.8 9.0 2.1 2.1 0.1 74.2 73.7 -0.8 14.8 76.8 42.9 11.5 53.9 1.0 73.6 Rural 2.6 39.5 4.0 2.4 3.2 0.8 69.7 72.1 1.8 19.8 69.4 67.2 23.0 88.7 1.7 41.6 Inside 2.8 39.1 8.4 2.4 3.1 0.7 69.9 71.7 1.0 24.8 72.5 62.2 22.1 82.8 1.5 55.6 Outside 2.4 32.1 10.0 2.4 2.4 0.1 69.8 51.3 15.8 66.1 1.0 69.6 Congo Basin Cameroon 2004 101 40.3 CAR 1994/95 31 39.6 Democrat ic Republic of Congo 2007 148 28.9 Congo-Brazzaville 2005 21 64.2 Gabon 2000 29 66.4 Average Eastern Himalayas India 2005/06 2736 32.6 Nepal 2006 37 12.0 No data. Average