Advanced resource planning as a decision support module for ERP
Abstract
The planning and decision support capabilities of the manufacturing planning and control system, which provides the core of any enterprise resource planning package, can be enhanced substantively by the inclusion of a decision support module as an add-on at the midterm planning level. This module, called advanced resource planning (ARP), provides a parameter-setting process, with the ultimate goal of yielding realistic information about production lead times for scheduling purposes, sales and marketing, strategic and operational decision making, and suppliers and customers. This article illustrates the ARP approach with reports from several real-life implementations by large industrial companies.
Keywords: Decision support; Midterm planning level; ERP; Advanced resource planning; Stochastic models
1. Introduction
The emergence and widespread adoption of enterprise resource planning (ERP) systems undoubtedly constitutes one of the most pervasive changes in the modern business environment. The term ERP has two different interpretations though [1]:
1. The information technology community emphasizes integration, such that an ERP system provides software that enables a firm to integrate different application programs (human resources, finance, sales, marketing, production planning) by tracking all transactions efficiently in real time and sharing them across functions through a common database. This is recognized as the core strength of ERP systems in real-life implementations (see e.g. [2]). The success and widespread implementation of ERP systems provides the groundwork for further integration across company borders to link partners in a supply chain. As the number of partners in a supply chain increases,
This is a postprint version of the paper published in Computers in Industry: Van Nieuwenhuyse, I., De Boeck, L., Lambrecht, M., Vandaele, N. (2011). Advanced resource planning as a decision support module for ERP. Computers in Industry, 62 (1), 1-8. DOI:http://dx.doi.org/10.1016/j.compind.2010.05.017. Available online at:http://
with members spread across the globe, the companies increasingly become aware that ERP is essential for their profit and market share goals [3].
2. Managers emphasize the planning aspect: an ERP system should be able to support decisions regarding the planning and execution of the business. For example, the production planning and control (PPC) module provides a key ERP feature (as stated in [4], it belongs to the most frequently implemented modules), and decision-making support offers a fairly important reason to adopt ERP (as shown by the surveys in [5],[6]). However, current ERP systems are ill-equipped for decision support and planning in a dynamic environment, mainly because current ERP systems continue to exhibit many of the weaknesses of material requirements planning (MRP), from which it originates [5], [7]. As argued in [7],[8], other than the speed with which the traditional MRP logic can be executed, little has changed since the 1970s.
While ERP vendors focused on integration capabilities, the academic community developed different approaches to improve the logic embedded in planning systems (see e.g. [9]; for more recent discussions, see [10], [11].) To the best of our knowledge, these enhanced planning solutions have not yet been implemented. To advance this research stream, this article describes the results obtained from implementing a custom-developed advanced resource planning (ARP) module as a decision support module (DSM) for ERP at a midterm planning level in several industrial companies. The proposed ARP module essentially models the production system as an open queueing network and thus adds value in three respects: (1) It facilitates setting more realistic PPC parameters (one of the greatest challenges to PPC [12]) by dynamically adjusting those parameters; (2) it incorporates the impact of several managerial decisions (e.g., lot sizing, outsourcing) to enable users to fine-tune system performance through optimization and what-if analyses; and (3) though it builds on ideas similar to those proposed in other research ([9], [10]), it models stochasticity in an explicit and unique way.
The next section focuses on the motivation for including ARP as a DSM in ERP. Section 3 presents some fundamental insights on the dynamic behavior of manufacturing systems and their implications for
manufacturing planning and control (MPC) modeling and decision support. It also summarizes relevant literature.A framework for integrating ERP and ARP is discussed in Section 4, followed by a description of the decision support benefits obtained from real-life implementations of ARP in several large industrial companies. Finally, Section 6 outlines our conclusions and summarizes the limitations and benefits of our approach.
2. Advanced resource planning as a necessary decision support module for ERP
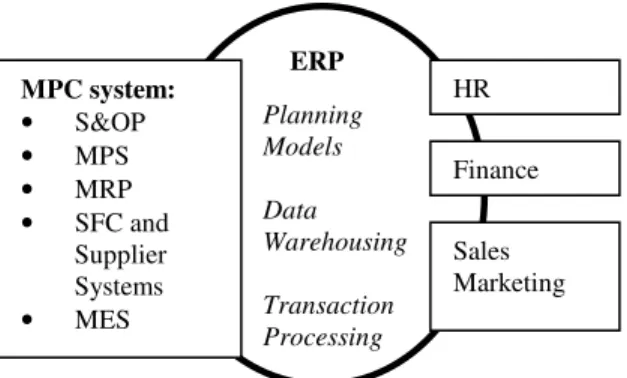
Enterprise resource planning systems evolved out of traditional MPC systems. As Fig. 1 indicates [1], the MPC system still constitutes the core of any ERP system, reflecting the hierarchy of planning from sales and operations planning (S&OP), master production scheduling (MPS) and material requirements planning (MRP) at the midterm level, to shop floor control (SFC), Manufacturing Execution Systems (MES) and supplier systems in the short-term.
[Insert Fig. 1 about here]
The feasibility of operational improvements that managers expect from an ERP implementation (e.g., lead time reductions, realistic capacity planning, improved on-time delivery, alignment of sales and planning) largely depends on the effectiveness of the embedded MPC system.
Unfortunately, the planning logic embedded in current MPC systems falls short on two fronts. First, the estimated production lead times used to set the production order release dates are treated as exogenous parameters, mostly estimated (or simply fixed) in an ad hoc fashion.Yet, it is beyond dispute that the actual lead time behavior of a production system changes dynamically as a function of the system load, the available capacity, and the amount of uncertainty (as is well-known from the theoretical literature on stochastic systems, see e.g. [13], [14], [15] for a detailed discussion). This shortcoming often leads to unrealistic parameter settings, which undermine the effectiveness of the MPC system [2], [12].
Second, the system offers no possibility for the user to intervene (through, e.g., lot size alterations, outsourcing, reducing downtimes, increasing capacity) to influence actual production lead times [16]. This limitation is a direct consequence of the inability to model (and forecast) the system’s dynamic and stochastic behavior in terms of its characteristics. Any inconsistencies or infeasibilities caused by unrealistic targets at the midterm level must be addressed at the short-term level (SFC), which results in nervousness and increased fire-fighting behavior.
Even so-called advanced planning systems (APS) that complement ERP systems by attempting to optimize system performance seem ill-equipped to resolve the basic shortcomings of MPC [17]. Advanced midterm planning systems (e.g., the Supply Network Planner by SAP, part of SAP’s Advanced Planning and Optimization –APO– module) tend to disregard uncertainty and ignore capacity restrictions [18]. The responsibility for creating a feasible schedule falls to the detailed scheduling level. Although advanced detailed scheduling systems (e.g., PP/DS in SAP) take capacities into account, they are reactive in nature and essentially represent deterministic simulation and monitoring tools that must be rerun often because of the short-term, deterministic nature of the solutions they propose [17].
This reactive method for dealing with problems seems largely inefficient: smart (re-)scheduling rarely can correct for fundamental errors at the higher (midterm) planning level. It merely leads to increased nervousness and fire-fighting behavior on the shop floor. This approach may even hinder performance, due to the risk of reacting to insignificant (e.g., random) changes by feeding back information or rerunning the planning tool, which in turn increases the variability of the system and may create a negative performance spiral [17] (see e.g. [19] and [20] for related insights on the impact of sequence changes on product lead times, and the impact of forecasting on the bullwhip effect).
To avoid this reactive behavior, the system must provide realistic parameter settings at the midterm level, which the firm may use to determine acceptable release dates, due dates, and time windows for scheduling and sequencing at the operational level [21, 22]. Therefore, the midterm planning level needs an enhanced model of the real-life system that can predict lead time behavior according to the system’s
characteristics in a sufficiently accurate way. The advanced resource planning module discussed in this paper is designed to meet this objective. This stochastic model copes with uncertainty and allows for proactive planning, which distinguishes it fundamentally from APS tools. Furthermore, because the model explicitly incorporates several managerial decisions, it provides a tool for fine-tuning the system’s behavior to reach, for example, lead time or customer service level targets set by management. This is a key innovative contribution of the ARP module: in this way, it offers crucial decision support at the midterm planning level. This is illustrated in Section 5 with results from real-life implementations.
3. ARP module: Functionalities
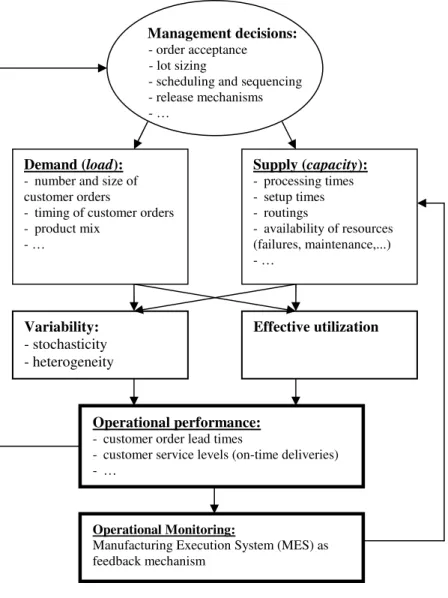
Some fundamental insights into the dynamic behavior of a stochastic system appear in the ARP model. Fig. 2 depicts the basic factors that determine the performance of a manufacturing system, including lead time behavior and customer service levels (i.e., on-time delivery performance). Manufacturing Execution Systems (MES) may function as a central depository for data collection. In Section 4, the role of MES is discussed in further detail.
[Insert Fig. 2 about here]
The relationships in Fig. 2 have been well described [14]; we limit ourselves to a quick overview. In particular, the key determinants of lead time behavior are the effective utilization of the manufacturing system and the presence of variability (uncertainty). Utilization results from the confrontation of demand and supply: the demand side represents customers, who place orders and add load to the manufacturing system. This load depends on both the quantity and timing of customer orders. The supply side consists of the capacity and resources (e.g., machines, transportation, personnel) that the manufacturer disposes of to fulfill customer demands. Variability is inherent to all real-life systems, on both the demand (e.g., uncertainty in the timing and quantities of customer orders) and the supply (e.g., planned outages, such as setup times and preventive maintenance; unplanned outages, such as machine breakdowns and power outages) sides. The supply-side outages influence utilization, because they decrease the effective capacity
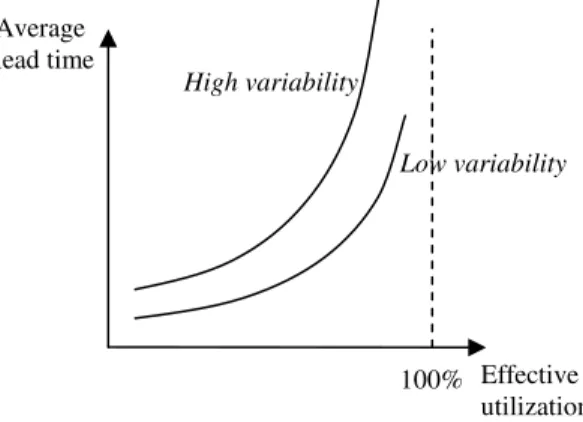
of the system. Effective capacity is finite, so the load on the system, determined by customer orders, results in competition for resources. In a system that is subject to variability, such competition causes congestion, and average lead times increase, as represented by the well-known, highly nonlinear relationship between utilization and average lead time in Fig. 3 [14]. Variability thus acts as an amplifier, beyond congestion, such that the greater the variability in the system, the more congestion occurs for a given effective utilization.
[Insert Fig. 3 about here]
The main relationship in Fig. 3 appears in prior literature in various related forms, including operating curves that link throughput and average lead time [23], clearing functions that connect average work-in-process and throughput [9], [10], and characteristic curves linking average work-in-work-in-process and average lead time [24]. The main insight provided by Fig. 3 is the fundamental importance of recognizing both limited effective capacity and variability when developing production plans, because both elements drive lead time behavior. Yet current MPC systems contain no tools to evaluate effective capacity or variability, let alone adequately model the resulting dynamics, so the plans they provide often assume both high capacity utilization (i.e., “efficient” resource utilization) and attractive (i.e., target or “wishful thinking”) lead times, making them inherently unrealistic. As noted already in Section 2, the negative consequences of this approach appear primarily at the short-term, SFC planning level in the form of continuous replanning and rescheduling efforts and increased fire-fighting behavior.
Instead of focusing on fixing problems at the SFC level, our ARP model attempts to improve the decisions at the midterm level (i.e., S&OP, MPS and MRP), which then enables smarter and more robust planning at the lower level (SFC). To reflect the inherent dynamics in Fig. 3, the manufacturing system is modeled as a multi-class, open queueing network [21]. To estimate the average lead time of the network, the decomposition approach is used [13]. Further details about the queueing approximations used in the module appear in previous research (see [21]). The model also incorporates the impact of management decisions (e.g., order release [25], routing changes, outsourcing, process lot sizing [26], transfer batching
[27]) on lead time behavior. As Fig. 2 shows, such management decisions influence both demand and supply side parameters and therefore the effective utilization of the system, as well as inherent system variability. As another contribution, this model yields an estimate of not only the average production lead time but also the entire lead time probability distribution (see [21] for the corresponding expressions), which means it provides percentiles. This information is vital for incorporating realistic safety times in the lead time–offsetting phase of MRP, because it makes the schedule more robust; a feature that is essential for avoiding the typical nervousness of traditional MRP systems (as discussed in Section 2), and promoting a stable, smoothly running system at the SFC level. Information about the lead time distribution also is vital to determine (and, if necessary, improve) the customer service level that the company can guarantee for a given delivery date, an issue that remains unaddressed by current ERP systems but is of key importance for businesses in the make-to-order industry [7].
4. ERP and ARP: Framework
As mentioned in Section 3, the backbone of the proposed ARP system is an open queueing network, which yields a largely generic model that can apply in many different industry and service settings without major changes. Moreover, the runtimes are very short: even for complicated, real-life systems, different what-if scenarios can be analysed in a matter of seconds. This feature seems crucial when the ARP model serves as decision support, because in the decision stage, firms likely need to investigate many different what-if scenarios. As the queueing model provides direct estimates of steady-state performance, no further statistical output analysis is needed. In spite of the continuous improvements in computing power and software efficiency, other types of models (such as discrete-event simulation models) still tend to be more time-consuming to run and analyse – though the gap is likely closing. (Other authors use simulation to estimate the clearing functions [10].)
The disadvantage, however, is that the model is approximate, does not provide great detail, and cannot reflect transient behavior [11]. The promising results obtained in real-life implementations of the model
(results from a first test case implementation have been described previously in [28],[29]; in this paper results from a recent number of real-life implementations are discussed in Section 5) support its sufficient precision to enhance midterm planning. As the existing literature pertaining to open queueing networks is vast, the reader is referred to the existing literature for detailed technical expressions (see e.g. [13] and [15] for key references in this field; [21] and [25] give further details on the specific expressions used in the ARP framework). This section focuses on the interface of ERP and ARP to determine which input parameters are needed for the ARP module and which output parameters feed back into the MPC system.
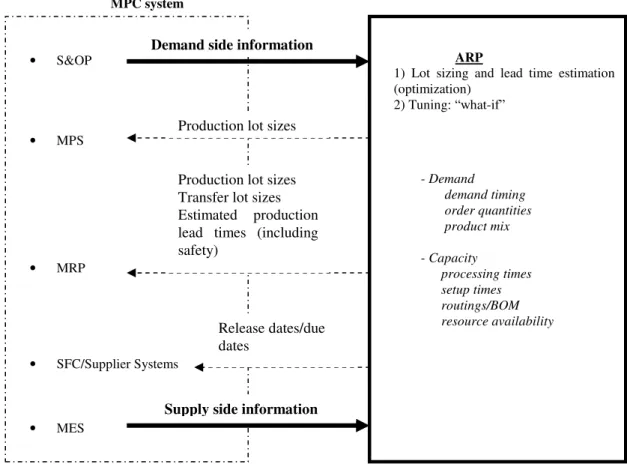
As shown in Fig. 4, ARP uses input parameters available at the S&OP level (demand side information) and the MES level (supply side information). Information about demand for the upcoming planning period (i.e., which products need to be produced, the timing of the demand, and the quantities requested) comes from the demand management process (e.g., the Demand Planning –DP– module in SAP). With this information, ARP can quantify the load and the variability inherently present in demand. Information about the supply side can be obtained from two major sources. Information concerning the routing of products, resource capacities, shift structure, etc. is usually available from standard ERP files such as bills of material, routing files, and resource files. Another major source of information is the Manufacturing Execution System (MES). The MES module typically keeps track of all manufacturing information in real time; it functions as a central depository for data collection. Information about processing times (and their variability), setup times (and their variability), planned and unplanned outages (maintenance, machine breakdowns, quality problems) is readily available from the MES files. This information is crucial for the ARP module, because it determines the effective capacity.
[Insert Fig. 4 about here]
The queuing model of the ARP module then translates these input characteristics for the upcoming planning period into the following output estimates: suggested optimal production lot sizes, average and variance of the corresponding order lead time, average and variance of the waiting time in queue before
different work centers, and estimates of the lead time percentiles. This information may be retrieved for every end item and/or component.
The ARP procedure consists of two phases. During the lot sizing and lead time estimation phase, ARP models the manufacturing system as an aggregate queuing network in which all parameters are functions of the manufacturing lot sizes. The objective function to be minimized consists of the weighted average lead time of customer orders through the shop E(W), whereas the decision variable is a set of manufacturing lot sizes Q that consists of K product-specific manufacturing lot sizes Qk (where the index k refers to the product type, k = 1, …, K). The optimization problem is constrained, because Q must be such that the effective utilization rate of all resources in the network remains below 100% (
ρ
m <1 forall resources m, m = 1, …, M). Moreover, the queueing approach requires that the characteristics of aggregate flow through the network satisfy a set of M linear equations. In brief, the optimization problem can be written as follows (for further details on the queueing expressions for objective function and constraints, see [25]): Min E(W) Q s.t.
ρ
m <1 ∀m k Qk ≥1 ∀Set of M linear flow equations
A dedicated optimization routine performs this optimization and minimizes the nonlinear objective function, taking the set of constraints into account. This routine yields an optimal manufacturing lot size
Qk for every product type k, along with estimates of the corresponding performance measures (average, variance and distribution of production order lead times, and waiting times in queue).
The tuning phase then enables managers to adjust the capacity or demand structure through what-if analyses (e.g., using overtime, altering lot sizes, introducing lot splitting, implementing capacity expansions, off-loading heavily loaded resources, considering alternative routings, outsourcing part of the production) if they consider the performance measures unacceptable or the proposed order portfolio
leads to infeasibilities (e.g., resources used beyond their effective capacity). After the tuning phase, if management is satisfied with the estimated performance measures, output can be communicated to the next levels in the MPC hierarchy (MRP and SFC/Supplier Systems), as shown in Fig. 4.
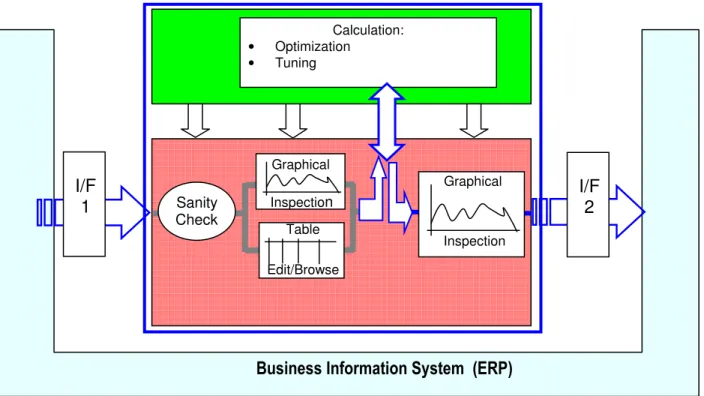
The design scheme in Fig. 5 details the ARP–ERP integration for the first implementation of our methodology, which was carried out at Spicer Off-Highway Products Division (Belgium), a subsidiary of DANA Corporation. The data for this test case came from a machine dump in a flat file format, and a data sanity check (which removes outliers, unrealistic values, and so on) confirmed the correct execution of the queueing network calculations. The ARP implementation allowed for graphical analysis of the input data (e.g., load profiles, machinery availability charts) and tabular information listings (e.g., on-demand data for different product types). All ARP calculations for the DANA case used an Application Service Provider (ASP) system, with data transferred to and from the calculation engine over the Internet. The calculation output (optimization and consecutive tuning phases) went back to the user, who analyzed the results graphically (average production lead times and required safety times) and suggested further what-if questions. The final results were uploaded into the ERP system in flat file format.
[Insert Fig. 5 about here]
Because the required input data may be retrieved from standard ERP database records, the ARP add-on essentially represents an intermediate calculatiadd-on and optimizatiadd-on engine that enables robust planning and scheduling at the lower levels of the MPC system.Previous articles provide further details about the models [21],[25], software [28], and quantitative business results [29] of this case study. This first implementation returned valuable insights for further developments and refinements of the ARP approach. The next section reports results obtained from more recent real-life implementations, which use the ARP module routinely to support decision making at the S&OP level and even at the strategic level.
5. Decision-support benefits of ARP: Results from real-life implementations
In Fig. 4, the ARP module acts as a DSM situated at the midterm MPC level. In several recent implementations, we observed decision support benefits for large industrial companies that applied the ARP logic, using C++ code or Excel spreadsheets with Visual Basic code. The ARP runs at the start of every planning period to note the conditions of the upcoming planning horizon and communicates updated information to the lower planning levels. The benefits accrue to various functional areas.
5.1. Scheduling (and execution)
The midterm plans devised by the MPC system are based on more realistic information, so schedulers can devise short-term plans that fit the anticipated time windows more easily, which offers both operational and financial advantages. As the effectiveness of the schedule improves, those responsible for executing it have little incentive to deviate from it, so schedule stability increases. Moreover, materials and components are launched only as needed, which prevents shortages or excess work-in-process on the shop floor. Thus, the company avoids unnecessary investments in working capital.
Atlas Copco, the world’s largest compressed air equipment manufacturer, implemented ARP for its scheduling and execution efforts. Four assembly plants receive core components from a manufacturing plant (Atlas Copco Airtec, located near Antwerp, Belgium). The orders placed by these assembly plants include agreed-upon due dates and corresponding service levels (specified in service-level agreements [SLA]). Managers at Airtec must determine the lot sizes and the release dates for the shop orders, for which they implemented an add-on system based on the ARP concept and logic. If the lead times grow too long (i.e., release dates past due) or the required service levels can’t be guaranteed, the ARP system helps management alter their decisions about capacity extensions, outsourcing, investments, vacation allowance, working hours, shift changes, engineering changes, maintenance plans, and so forth. The ARP module, which runs on a PC, was encoded in Visual Basic, receives input from a legacy ERP system, and reports to the monthly sales and operations meeting. The results from the lot sizing and lead time estimation phase enables the calculation of the impact of various suggestions and final decisions quickly
during the meetings (tuning phase). When the team reaches their decisions, the resulting parameter values (e.g., lead times, lot sizes, release dates, outsourcing percentages) are uploaded into the mainframe architecture of the ERP system, and the installed ERP functionalities take over again.
Fig. 6 illustrates a typical output result pertaining to the average lead time and some corresponding (user-defined) lead time percentiles (in days) for six items from a product family. The differences in safety time needed to preserve the service level show that these products differ in the way they are produced (e.g., scrap percentages, routings). Using this information, Atlas Copco can set realistic release dates for the shop orders, while still taking into account a very complex job shop of roughly 250 machines and a few hundred products. The actual safety level used in the lead time off-setting phase can be chosen by the user (the higher the chosen percentile, the more safety time will be included in the calculation of the order release times, and the more robust the schedule will be).
[Insert Fig. 6 about here]
Such information is available in monthly time buckets, for a planning horizon of 18 months. Therefore, Atlas Copco can conduct time-phased midterm planning and preserve required service levels, even as it notes differences in parameters (e.g., due to seasonality, changing product mixes, new product introductions) over the planning horizon. Observations on the shop floor confirm that the short-term schedules became more stable, and work-in-process declined after the ARP implementation; the reliability of deliveries to the final assembly plants also increased significantly.
5.2. Sales and marketing
Companies in make-to-order (MTO) industries must quote reliable lead times for customers. Increased demand for customized products makes this MTO sector increasingly important [7]. The functionality of the ARP module allows such companies to adjust their lead time quotations dynamically in response to changes in demand or shop floor conditions, such that the sales department’s promises remain in sync with the manufacturing department’s capabilities, and due date performance can be secured.
A good example of an implementation in a MTO environment involves the Manufacturing Laboratory of Janssen Pharmaceutica, a division of Johnson & Johnson (located in Geel, Belgium). This environment is characterized by the erratic arrival of samples gathered at various steps during the pharmaceutical production process, including raw material inspections. These samples must be analyzed in a report with time restrictions specified by a SLA for the lab. To meet the SLA requirements, the lab must manage its capacity (i.e., personnel and expensive, scarce equipment), a task complicated by several factors. Lab processes are intrinsically subject to variability (e.g., high degree of human intervention) and regularly subject to rework, verification, and contamination. Moreover, samples arrive in highly variable patterns due to a campaign manufacturing approach typical of pharmaceuticals, irregular requests for sample analyses from raw material inspectors, and special requests from R&D.
In this case, the ARP tool receives the projected sample load from the ERP system (input from the MPS and an Advanced Lab Information Management System [ALIMS]), then helps the laboratory manager plan capacity to ensure delivery of the analysis reports within the agreed time (e.g., typically 95% of reports within 10 days). Because different laboratory professionals have certifications for various processes, temporary versus permanent work force numbers, vacation allowances, and training time (for certification) have considerable impacts on lab performance. The results of the decisions derived through the ARP finally get uploaded into the ERP system. A typical lead time profile appears in Fig 7.
[Insert Fig. 7 about here]
The top of Fig. 7 shows the observed lead times of a particular type of samples along with the target times (i.e., the SLA for this particular sample type requests that analysis reports be available within nine days 90% of the time). Before ARP, the laboratory lead times almost invariably violated the SLA; after its implementation (in November, as indicated by the dashed vertical line), the lab consistently met the nine-day lead time with the required service level. The lower part of Fig. 7 also shows the number of on-time releases in manufacturing related to the on-timely availability of the laboratory reports. The
improvements since the ARP implementation are evident; furthermore, observations on the shop floor confirmed that demand for rescheduling and/or rush orders had largely disappeared.
5.3. Strategic and operational decision making
The ARP module also allows managers to fine-tune their strategic (e.g., capacity investments, outsourcing decisions) and operational (e.g., lot sizing) decisions in view of their preferred operational targets (e.g., lead time reduction). Thus, the module offers a tool for analysis as well as a lever for operational improvement. Although planning and scheduling models frequently appear independently, we consider them linked, in line with the hierarchical production planning philosophy. That is, decisions at higher planning levels impose constraints on lower planning levels.
ARP can support strategic decision making, as illustrated by the implementation at a major, global pharmaceutical company.1 The company uses the ARP model to determine where to allocate demand
quantities for production across its network of 24 European plants, each of which operates multiple production lines; each production line also possesses unique characteristics (e.g., speed, product range, reliability, scrap rates, degree of automation). The allocation of production volumes and mixes to different lines thus significantly influences overall system performance. The ARP model application estimates the impact of these allocation choices on production lead times and customer service levels using what-if analysis and reconsiders allocation choices on a monthly basis over a planning horizon of 18 months. Constraints exist to avoid allocations of very small volumes to particular plants and avoid erratic month-to-month changes in production volumes. In this case, the ARP application is a stand-alone spreadsheet system that receives necessary demand and capacity data from an ERP data dump. The resulting allocations are uploaded in a flat file format. The ARP model also serves to assist in planning the required capacities for new production lines (e.g., green field production lines in China).
5.4. Cross-company benefits
1
In addition to these benefits, the ARP add-on offers advantages to the company’s customers and suppliers. Customers clearly benefit from realistic lead time quotes. Furthermore, because the timing and quantity of purchase orders generated by the MRP system rely on the company’s own build schedule, the more stable schedule creates a more reliable order pattern (e.g., less expediting or de-expediting, fewer quantity changes, fewer rush orders) for the supplier. Thus, the improved transparency and data accuracy provided by the ARP implementation improve supply chain effectiveness and help mitigate a primary source of the bullwhip effect.
The main goal of any ERP system consists of enhancing transparency, knowledge, and information management for the company and its customers (clients and suppliers). In this respect, the importance of the add-on ARP module for providing realistic and reliable information can hardly be overstated.
6. Conclusion
This paper illustrates the logic and decision support benefits of an advanced resource planning module, that provides additional intelligence to ERP systems at the midterm planning level. The ARP enables planners to capture relationships among variability and uncertainty on the one hand and capacity utilization, lead time, and customer service on the other hand. The approach relies on queuing approximations, the details of which can be found in previous literature. Although this approach suffers several downsides—for example, it cannot model the system in great detail or reflect transient behavior—the results obtained from several real-life implementations show that including ARP as an add-on to ERP provides substantial added value. Its relatively short run times also make it an invaluable tool for what-if analyses that can effectively support managerial decision making.
The key output of the ARP module consists of realistic estimates of key planning parameters, such as expected production lead times and estimates of required safety times. As illustrated by the real-life implementation results, such improved information benefits not only the scheduling and execution phase of the PPC system, because it provides realistic time windows for scheduling and reliable production
order release dates, but also the sales department, because it offers realistic and up-to-date information for reliable lead time quotations, and strategic decisions, including volume and mix allocations.
The results reported in this paper underscore the strong potential of the ARP approach. Prior to this point, implementations have proceeded on a case-by-case basis, such that the ARP software runs as a stand-alone add-on to ERP. The major issue that these implementations confront has been their interface with the ERP system, which is necessary to retrieve input data and upload the results. Further developments of an automated interface between, for example, SAP and ARP might offer even more possibilities for large-scale implementations. Currently, our further research focuses on opportunities for the implementation of ARP in health care systems and product service systems.
Acknowledgements
This research was supported by the Research Foundation-Flanders (grant no. G.0547.09).
References
[1] T.E. Vollmann, L.B. Berry, D.C. Whybark, and F.R. Jacobs, Manufacturing Planning and Control Systems for Supply Chain Management (McGraw Hill, New York, 2005).
[2] C. Berchet and G. Habchi, The implementation and deployment of an ERP system: an industrial case study, Computers in Industry 56 (6) (2005) 588-605.
[3] D. Simchi-Levi, P. Kaminsky, and E. Simchi-Levi, Designing and Managing the Supply Chain (McGraw-Hill, New York, 2000).
[4] V. Botta-Genoulaz and P.A. Millet, A classification for better use of ERP systems, Computers in Industry 56 (6) (2005) 573-587.
[5] C.W. Holsapple and M.P. Sena, ERP plans and decision-support benefits, Decision Support Systems 38 (4) (2005) 575-590.
[6] C.W. Holsapple and M.P. Sena, The decision-support characteristics of ERP systems, International Journal of Human-Computer Interaction 16 (1) (2003) 101-123.
[7] M. Stevenson, L.C. Hendry, and B.G. Kingsman, A review of production planning and control: the applicability of key concepts to the make-to-order industry, International Journal of Production Research 43 (5) (2005) 869-898.
[8] F.R. Jacobs and F.C. Weston Jr., Enterprise resource planning (ERP) – A brief history, Journal of Operations Management 25 (2) (2007) 357-363.
[9] U. Karmarkar, Capacity loading and release planning with work-in-progress and leadtimes, Journal of Manufacturing and Operations Management 2 (1989) 105-123.
[10] J. Asmundsson, R.L. Rardin, and R. Uzsoy, Tractable nonlinear production planning models for
semiconductor wafer fabrication facilities, IEEE Transactions on semiconductor manufacturing 19 (1) (2006) 95-111.
[11] H. Missbauer, Aggregate order release planning for time-varying demand, International Journal of Production Research 40 (3) (2002) 699-718.
[12] H.P. Wiendahl, G. Von Cieminski, and H.P. Wiendahl, Stumbling blocks of PPC: Towards the holistic configuration of PPC systems, Production Planning & Control 16 (7) (2005) 634-651.
[13] J.A. Buzacott and J.G. Shantikumar, Stochastic Models of Manufacturing Systems, (Prentice Hall, Englewood Cliffs, NJ, 1993).
[14] W. Hopp and M. Spearman, Factory Physics, (McGraw-Hill, New York, 2008).
[15] R. Suri, J.L. Sanders, and M. Kamath, Performance evaluation of production networks, in: S.C. Graves, A.H.G. Rinnooy Kan, P.H. Zipkin, Eds., Logistics of Production and Inventory, (Elsevier Science Publishers, 1993).
[16] S.C.L. Koh and S.M. Saad, A holistic approach to diagnose uncertainty in ERP-controlled manufacturing shop floor, Production Planning & Control 14 (3) (2003) 273-289.
[17] M. Spearman, Realities of risk: Supply chains must scrutinize the unknown, Industrial Engineer, 39 (2) (2007) 36-41.
[18] G. Knolmayer, P. Mertens, A. Zeier, and J.T. Dickersbach, Supply Chain Management Based on SAP Systems: Architecture and Planning Processes (Springer, 2002).
[19] A. Dupon, I. Van Nieuwenhuyse, and N. Vandaele, The impact of sequence changes on product lead time, Robotics and Computer-Integrated Manufacturing 18 (3) (2002) 327-333. [20] S. Disney and M.R. Lambrecht, On replenishment rules, forecasting and the bullwhip effect in supply chains, Foundations and Trends in Technology, Information and Operations Management 2 (1) (2007) 1-80.
[21] M.R. Lambrecht, P.L. Ivens, and N.J. Vandaele, ACLIPS: A capacity and lead time integrated procedure for scheduling, Management Science 44 (11) (1998) 1548-1561.
[22] N. Vandaele and L. De Boeck, Advanced resource planning, Robotics and Computer Integrated Manufacturing 19 (1) (2003) 210-218.
[23] A.K. Schoemig, On the corrupting influence of variability in semiconductor manufacturing, in: P.A. Farrington, H.B. Nembhard, D.T. Sturrock and G.W. Evans, Eds., Proceedings of the 1999 Winter Simulation Conference (1999) 837-842.
[24] H.-P. Wiendahl, Load-oriented manufacturing control (Springer, 1995).
[25] N. Vandaele, I. Van Nieuwenhuyse, D. Claerhout, and R. Cremmery, Load-based POLCA: An integrated material control system for multiproduct, multimachine job shops, Manufacturing & Service Operations Management 10 (2) (2008) 181-197.
[26] I. Van Nieuwenhuyse, N. Vandaele, K. Rajaram, and U. Karmarkar, Buffer sizing in multi-product multi-reactor batch processes: Impact of allocation and campaign sizing policies, European Journal of Operational Research 179 (2) (2007) 424-443.
[27] I. Van Nieuwenhuyse and N. Vandaele, A queueing model for a two-stage stochastic manufacturing system with overlapping operations, International Journal of Flexible Manufacturing Systems 17 (3) (2006) 175-199.
[28] N. Vandaele and M. Lambrecht, Planning and scheduling in an assemble-to-order environment: Spicer Off-Highway products division, in: J. Song and D. Yao, Eds., Supply Chain Structures: Coordination, Information and Optimisation, (Kluwer, 2002).
[29] N.J. Vandaele, M.R. Lambrecht, N. De Schuyter, and R. Cremmery, Spicer Off-Highway Products Division-Brugge improves its lead time and scheduling performance, Interfaces 30 (1) (2000) 83-95.
Fig. 1. Scope of the ERP system ERP MPC system: • S&OP • MPS • MRP • SFC and Supplier Systems • MES HR Finance Planning Models Data Warehousing Transaction Processing Sales Marketing
Fig. 2. Determinants of operational performance of a manufacturing system, with MES as feedback mechanism
Demand (load): - number and size of customer orders
- timing of customer orders - product mix - … Supply (capacity): - processing times - setup times - routings - availability of resources (failures, maintenance,...) - … Operational performance: - customer order lead times
- customer service levels (on-time deliveries) - … Variability: - stochasticity - heterogeneity -… Effective utilization Management decisions: - order acceptance - lot sizing
- scheduling and sequencing - release mechanisms - …
- …
Operational Monitoring:
Manufacturing Execution System (MES) as feedback mechanism
Fig. 3. Relationship among effective utilization, variability, and expected lead time Average lead time 100% Effective utilization High variability Low variability
Fig. 4. Framework for the integration of the ARP module and ERP • S&OP • MPS • MRP • SFC/Supplier Systems • MES ARP
1) Lot sizing and lead time estimation (optimization) 2) Tuning: “what-if” MPC system - Demand demand timing order quantities product mix - Capacity processing times setup times routings/BOM resource availability Production lot sizes
Production lot sizes Transfer lot sizes Estimated production lead times (including safety)
Release dates/due dates
Demand side information
Fig. 5. ARP design scheme
Business Information System (ERP)
I/F 2 I/F 1 Calculation: • Optimization • Tuning Graphical Inspection Graphical Inspection Table Edit/Browse Sanity Check
0 10 20 30 40 50 60 70 80
Product 1 Product 2 Product 3 Product 4 Product 5 Product 6
d a y s Expected LT (days) 70% LT (days) 80% LT (days) 90% LT (days)
0 5 10 15 20 25 A u g '0 5 S e p '0 5 O c t' 0 5 N o v '0 5 D e c '0 5 J a n '0 6 F e b '0 6 M a r' 0 6 N u m b e r o f d a y s Month Backlog Target On Time Release 0 10 20 30 40 50 60 70 80 90 100 A u g '0 5 S e p '0 5 O k t'0 5 N o v '0 5 D e c '0 5 J a n '0 6 F e b '0 6 M a a '0 6 %
Fig. 7. Implementation results: Lead time and on-time releases (Janssen Pharmaceutica case) Start of use of
ARP module Start of use of ARP module