Wealth Management Bulletin
Markets down, sentiment down, interest rates heading up, recession, oil
prices, property – what to do??
In the last 30 days the FTSE 100 Index is down approximately 7%, in the last 12 months peak to trough the index is approximately 20% down. There is a similar story around the globe in most developed markets. In the last 12 months the spot price for Brent Crude has very nearly doubled, inflation expectations are 4% to 5%, or higher depending on your preferred calculation method. Residential and commercial property prices are falling.
Many investors are wondering what to do. Most of our clients are suffering losses on their portfolios. As most readers will know, the answer to the above is, in summary:
Do nothing or buy more of the underperforming assets – avoid emotional involvement with the investment decisions at all cost.
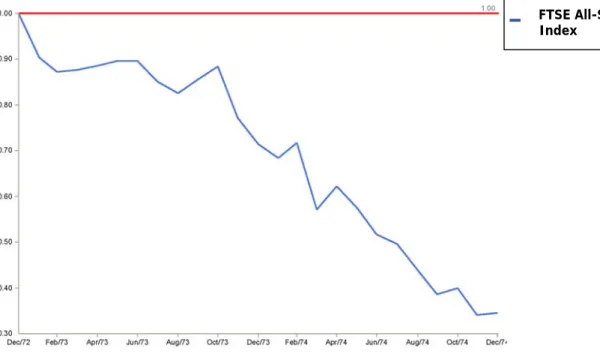
I thought it would be worthwhile to look back in history at other rotten times to be invested. I have looked at the FTSE All Share for the last 50 years. I think the worst possible month to invest would probably have been January 1973. Here’s a graph of what happened in the next 24 months.
Fig 1. Monthly: 01/1973 – 12/1974
FTSE data published with the permission of FTSE
FTSE All-Share Index
As you can see after 12 months the loss is very nearly 30%, and this data includes reinvested dividends. First time investors must have questioned their sanity if their first experience was January 1973.
During 1974 the market lost a further 51.6%. That is a total loss of over 60% in 24 months. The cold scientific reaction would be to stay invested but how many investors, particularly retail investors, managed to hold their nerve? I do not know where to get the data but all my experience and more recent studies suggest that many many investors sold at some point during this rotten time. If you started with £1,000,000 in January 1973, by December 1974 it had shrunk to less than £400,000. Why pay advisers?
Many see parallels between the situation now and the situation in the 70s particularly in respect of the high oil prices and rising inflation.
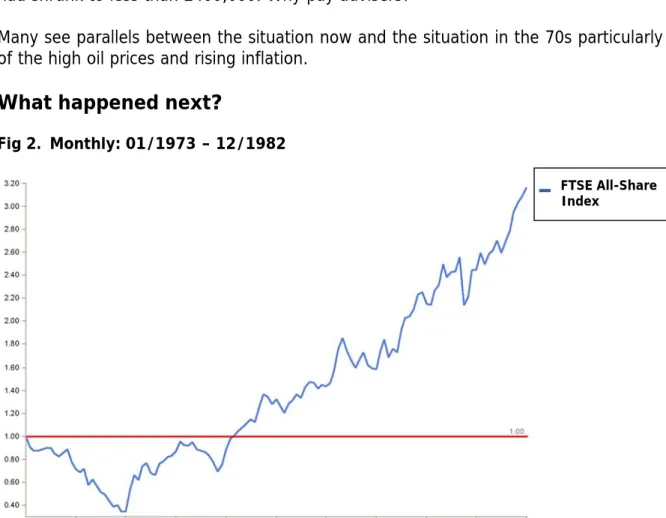
What happened next?
Fig 2. Monthly: 01/1973 – 12/1982
FTSE data published with the permission of FTSE
1975 was the best year for the UK stockmarket since the Second World War. The market ultimately surged forward shrugging off the winter of discontent. After ten years the £1,000,000 invested in January 1973 was worth over £3,000,000 (this ignores taxation). The real value of the £1,000,000 would have just about been preserved whereas the same sum on deposit (using treasury bills as a proxy for cash) would have lost real value. But in the thick of say winter 1973, the decision to invest would have looked life changingly poor.
In fact our clients never invest all their investments in one asset. Typically money is split between property, fixed interest, equities and cash. A simplified portfolio would hold 60% UK equities and 40% short dated fixed interest securities.
FTSE All-Share Index
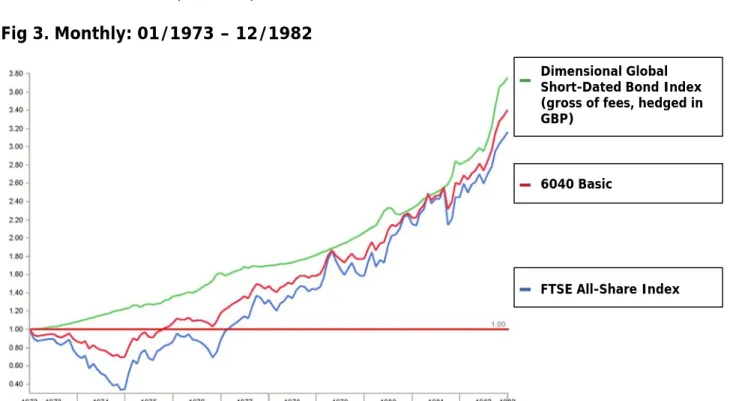
Here are the results from 1973 for ten years if a fictitious client had, on 1 January 1973, invested 60% of his capital in equities and 40% in short dated bonds.
Fig 3. Monthly: 01/1973 – 12/1982
FTSE data published with the permission of FTSE. Data includes composite data from multiple sources
As you would expect, this mixed portfolio did not suffer the same falls as the 100% equity portfolio. It performed better than the equity portfolio but not as well as the best performing asset, which was in this case short dated bonds. This is the basic rationale for diversification – less volatility leading to a smoothed return. It would have been nice to know in advance that short dated bonds were going to be the best asset class for 1973 to 1983.
In fact longer standing clients will know that we also encourage clients to rebalance their portfolios. We normally do this annually though there are exceptions, also tax consequences must be taken into account. Rebalancing means taking the portfolio back to the model constitution. In practice it usually means behaving counter-intuitively – take profits on the best performing assets and invest in the poorly performing assets. In the 1973 example, the client started out with 60% in equities and 40% in bonds. At the end of 12 months, the client would have had a portfolio consisting of almost exactly 50% equities and 50% bonds.
To rebalance the portfolio to 60/40 means selling sufficient bonds to bring the portfolio back to 60/40. At the end of 1974 the same exercise would have been repeated – equities had lost significantly and bonds had been between good and pedestrian. However, when equities took off in 1975, our cold scientific rebalancing would have forced selling of equities and buying of bonds – again to try and retain the 60/40 balance.
Dimensional Global Short-Dated Bond Index (gross of fees, hedged in GBP)
6040 Basic
FTSE All-Share Index
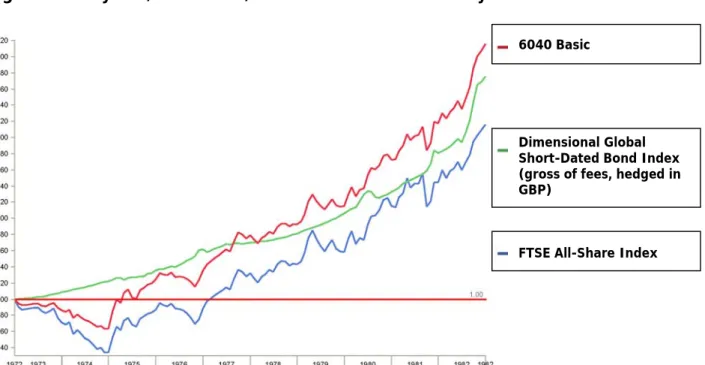
What effect does this rebalancing have on returns?
Fig 4. Monthly: 01/1973 – 12/1982 Rebalanced Annually
FTSE data published with the permission of FTSE. Data includes composite data from multiple sources
The 60/40 portfolio rebalanced annually outperforms both asset classes. £1,000,000 would have become £4,000,000. This mathematical phenomenon is basically a result of regularly taking small profits.
Where does all this “light on the stern” backward looking get us in July 2008? I hope it provides balance and moderation. The repeated use of the term “unprecedented” in the context of financial markets is sensationalist. We have been here before and we will be here again. The fictitious investors imagined in the graphs above would have suffered real pain in 1973 and for several years afterwards. However, their ability to stick to the philosophy through thick and thin would ultimately have paid great rewards. In particular the discipline of taking profits and reallocating back to model is a significant factor.
I have no idea where markets are heading. My position is in line with the bulk of academic thinking. I do know that historically investing in equities and property has always paid off eventually. I do know that trying to avoid the down days/months/years is a high risk strategy that fails more often than it succeeds. Long term investors reap the losses of the short term speculators. In order to achieve this they will sometimes suffer losses and sometimes these losses will occur for a protracted period of time. This is the price of superior returns over the long term.
The key is to keep focussed on the long term. Volatility is not unusual. Rebalancing is a key part of portfolio management. Unless your needs or tolerance for loss have changed it is unlikely that we would recommend wholesale changes to your portfolio.
6040 Basic
Dimensional Global Short-Dated Bond Index (gross of fees, hedged in GBP)
FTSE All-Share Index
Watford 64 Clarendon Road Watford Herts WD17 1DA T 01923 232938 F 01923 817159 Aylesbury
2a Alton House Office Park Gatehouse Way Aylesbury Bucks HP19 8YF T 01296 484831 F 01296 437157 Hemel Hempstead Charter Court Midland Road Hemel Hempstead Herts HP2 5GE T 01442 269341 F 01442 219517 www.hillierhopkins.co.uk [email protected] London 10 Dover Street London W1S 4LQ T 0207 4933166 F 0207 4936202
If you have any queries on the above, would like to discuss any aspect of the above theories, or would like to read more about them, do contact me. Many thanks.
Ben Sherwood Principal
Email: [email protected] Direct Dial: 01442 220713
© Hillier Hopkins LLP July 2008
The key data sources are FTSE indices and a simulated index of global short dated bonds hedged into sterling. Data includes reinvested dividends. Performance data represents past performance and is no guarantee of future results. Actual results may be higher or lower than the data shown and will certainly be different from the data shown. This article is intended to be of general interest. It does not constitute investment advice. Any party considering taking action or refraining from taking action should seek professional advice.