European Journal of Heart Failure. 2018; 20(7):1081-1099
Comprehensive in
‐
hospital monitoring in acute heart failure:
applications for clinical practice and future directions for
research. A statement from the Acute Heart Failure Committee of
the Heart Failure Association (HFA) of the European Society of
Cardiology (ESC)
Veli-Pekka Harjola
1, JohnParissis
2, Hans-Peter Brunner-La Rocca
3, Jelena Čelutkiené
4,
Ovidiu Chioncel
5, Sean P. Collins
6, Daniel De Backer
7, Gerasimos S. Filippatos
2,
Etienne Gayat
8, Loreena Hill
9, Mitja Lainscak
10,11, Johan Lassus
12, JosepMasip
13,14,
Alexandre Mebazaa
15,16,17,18, ÒscarMiró
19, Andrea Mortara
20, Christian Mueller
21,
Wilfried Mullens
22, Markku S. Nieminen
23, Alain Rudiger
24, Frank Ruschitzka
25, Petar
M. Seferovic
26, Alessandro Sionis
27, Antoine Vieillard-Baron
28, Jean Marc Weinstein
29,
Rudolf A. de Boer
30, Maria G. Crespo-Leiro
31, Massimo Piepoli
32, and Jillian P. Riley
331 Emergency Medicine, University of Helsinki, Department of Emergency Medicine and Services, Helsinki University
Hospital, Helsinki, Finland; 2 Athens University Hospital Attikon, Athens, Greece; 3 Department of Cardiology, Maastricht University Medical Center, Maastricht, The Netherlands; 4 Vilnius University, Faculty of Medicine,
Institute of Clinical Medicine, Clinic of Cardiac and Vascular Diseases, Vilnius, Lithuania; 5 University of Medicine Carol Davila/Institute of Emergency for Cardiovascular Disease, Bucharest, Romania; 6 Department of Emergency Medicine, Vanderbilt University Medical Center, Nashville, TN, USA; 7 Department of Intensive Care Medicine , CHIREC Hospitals, Université Libre de Bruxelles, Brussels, Belgium; 8 Département d’Anesthésie- Réanimation-SMUR, Hôpitaux Universitaires Saint Louis-Lariboisière, INSERM-UMR 942, AP-, HP, Université Paris Diderot, Paris, France; 9 Queens University, Belfast, UK; 10 Department of Internal Medicine and Department of Research and Education, General Hospital Murska Sobota, Murska Sobota, Slovenia; 11 Faculty of Medicine, University of Ljubljana, Ljubljana, Slovenia; 12 Cardiology, Heart and Lung Center, University of Helsinki, Helsinki University Hospital, Helsinki, Finland; 13 Consorci Sanitari Integral, University of Barcelona, Barcelona, Spain; 14 Hospital Sanitas CIMA, Barcelona, Spain; 15 U942 INSERM, AP-HP, Paris, France; 16 Investigation Network Initiative Cardiovascular and Renal Clinical Trialists (INI-CRCT), Nancy, France; 17 University Paris Diderot, Sorbonne Paris Cité, Paris, France; 18 AP-HP, Department of Anesthesia and Critical Care, Hôpitaux Universitaires Saint Louis-Lariboisière, Paris, France; 19 Emergency Department, Hospital Clínic, University of Barcelona, Barcelona, Catalonia, Spain; 20 Department of Cardiology, Policlinico di Monza, Monza, Italy; 21 Department of Cardiology and Cardiovascular Research Institute Basel (CRIB), University Hospital Basel, Basel, Switzerland; 22 Department of Cardiology, Ziekenhuis Oost Limburg, Genk – Biomedical Research Institute, Faculty of Medicine and Life Sciences, Hasselt University, Diepenbeek, Belgium; 23 Department of Cardiology, University of Helsinki, Helsinki, Finland; 24 Cardio-surgical Intensive Care Unit, University and University Hospital Z urich, Zurich, Switzerland; 25 University Heart Center, University Hospital Zurich, Zurich, Switzerland; 26 Department of Internal Medicine, Belgrade
University School of Medicine and Heart Failure Center, Belgrade University Medical Center, Belgrade, Serbia; 27 Cardiology Department, Hospital de la Santa Creu i Sant Pau, Universitat Autònoma de Barcelona, Barcelona, Spain; 28 INSERM U-1018, CESP, Team 5 (EpReC, Renal and Cardiovascular Epidemiology), UVSQ, 94807 Villejuif, France, University Hospital Ambroise Paré, AP-, HP, Boulogne-Billancourt, France; 29 Cardiology Division, Soroka University Medical Centre, Beer-Sheva, Israel; 30 Department of Cardiology, University Medical Center Groningen, University of Groningen, Groningen, The Netherlands; 31 Complexo Hospitalario Universitario A Coruña (CHUAC), Instituto de Investigación Biomédica de A Coruña (INIBIC), CIBERCV, UDC, La Coruña, Spain;
32
Introduction
Professionals within clinical practice frequently encounter patients hospitalized with acute heart failure (AHF).1-5 These patients commonly present with signs and symptoms of congestion, but some patients also present with signs of tissue hypoperfusion contributing to impaired organ function.6 Regardless of their clinical profile or type of heart failure (i.e. reduced or preserved ejection fraction7), comprehensive inpatient monitoring in conjunction with thorough physical examination is crucial to optimize management. Clinicians are under increasing pressure to keep inpatient length of stay as short as possible while also preventing post‐discharge emergency visits, rehospitalization and short‐term mortality. More effective monitoring might help to achieve these goals and improve the accuracy of discharge readiness assessments.
The 2016 European Society of Cardiology (ESC) heart failure guidelines provide recommendations based on the available evidence for the inpatient management of AHF. It is notable that 17 of the 18 recommendations related to monitoring, all class I recommendations, are rated as level of evidence C (‘consensus of opinion of the experts and/or small studies, retrospective studies, registries’) (Table 1).6 Thus, a substantial evidence gap exists regarding the optimal inpatient monitoring strategies for these severely ill patients.
Table 1. ESC guideline recommendations and further considerations for in‐hospital monitoring of patients with acute heart failure
Topic Guideline recommendation6
Diagnostic evaluation: baseline and initial monitoring; usually in emergency department or at point of initial admission Non‐invasive vital
signs
Standard non‐invasive monitoring of heart rate, rhythm, respiratory rate, oxygen saturation and blood pressure is recommended (class I, level of evidence C).
Biomarkers Upon presentation, a measurement of plasma natriuretic peptide level (BNP, NT‐proBNP or MR‐proANP) is recommended in all patients with acute dyspnoea and suspected AHF to help in the differentiation of AHF from non‐cardiac causes of acute dyspnoea (class I, level of evidence A).
Electrocardiogram 12‐lead ECG is recommended at admission in all patients presenting with suspected AHF (class I, level of evidence C).
Chest X‐ray Chest X‐ray is recommended at admission in all patients presenting with suspected AHF to assess signs of pulmonary congestion and detect other cardiac or non‐cardiac diseases that may cause or contribute to the patient's symptoms (class I, level of evidence C).
Laboratory assessments
Cardiac troponins, blood urea nitrogen, creatinine, electrolytes (sodium, potassium), glucose, complete blood count, liver function tests, and thyroid stimulating hormone are recommended at admission in all patients presenting with suspected AHF (class I, level of evidence C).
Echocardiography Echocardiography is recommended immediately in haemodynamically unstable AHF patients and within 48 h when cardiac structure and function are either not known or may have changed since previous studies (class I, level of evidence C).
Clinical status monitoring: usually in intensive or critical care unit; less invasive components of monitoring continued on the general ward or prior to discharge
Vital signs Standard non‐invasive monitoring of heart rate, rhythm, respiratory rate, oxygen saturation and blood pressure is recommended (class I, level of evidence C).
Body weight and fluid balance
It is recommended that patients should be weighed daily and have an accurate fluid balance chart completed. This includes accurate measurements of urine output in critically ill patients (class I, level of evidence C). Signs and symptoms It is recommended to evaluate signs and symptoms relevant to heart failure (e.g. dyspnoea, pulmonary rales,
peripheral oedema, weight) (class I, level of evidence C). Laboratory
assessment
Frequent, often daily measurement of renal function (blood urea, creatinine) and electrolytes (potassium, sodium) during i.v. therapy and when renin–angiotensin–aldosterone system antagonists are initiated is recommended (class I, level of evidence C).
Invasive monitoring Invasive monitoring with an arterial line is recommended in patients with cardiogenic shock (class I, level of evidence C).
Intra‐arterial line should be considered in patients with hypotension and persistent symptoms despite treatment (class IIa, level of evidence C).
Pulmonary artery catheter may be considered in patients who, despite pharmacological treatment, present refractory symptoms (particularly with hypotension and hypoperfusion) (class IIb, level of evidence C). Oxygenation Transcutaneous monitoring of arterial oxygen saturation is recommended (class I, level of evidence C). Blood gas analysis Measurement of blood pH and carbon dioxide tension (possibly including lactate) should be considered,
especially in patients with acute pulmonary oedema or history of COPD using venous blood. In patients with cardiogenic shock, arterial blood is preferable (class IIa, level of evidence C).
AHF, acute heart failure; BNP, B‐type natriuretic peptide; COPD, chronic obstructive pulmonary disease; ECG, electrocardiogram; NT‐proBNP, N‐terminal pro B‐type natriuretic peptide; MR‐proANP, mid‐regional pro‐atrial natriuretic peptide.
Despite this lack of evidence, physicians are expected to deploy the best monitoring tools to guide management decisions for their patients. Importantly, monitoring is a dynamic process involving a spectrum of different clinical, biochemical and physiological parameters. These variables should be interpreted in the context of the whole patient, rather than as isolated measurements. Importantly, equal attention should be paid to changes in measurements over time. Moreover, the feasibility, costs, and possible harms of monitoring, as well as the required knowledge and skills for appropriate use of monitoring tools should be considered when optimizing monitoring approaches for an individual patient. This document provides the multidisciplinary team with practical applications of guideline
recommendations for the inpatient monitoring of patients with AHF (Figure 1). Recommendations that are taken from the ESC guidelines are noted by reference and the description of the accompanying recommendation class and level of evidence. Practical suggestions for clinical application do not have an associated recommendation class or level of evidence. Identifying research priorities to address the gaps in evidence (Table 2) to improve the evidence base for future guideline recommendations is also addressed.
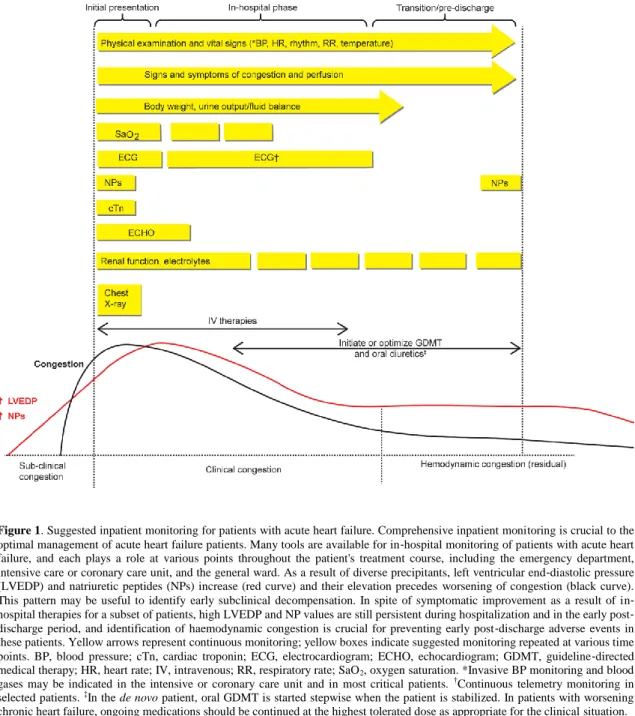
Figure 1. Suggested inpatient monitoring for patients with acute heart failure. Comprehensive inpatient monitoring is crucial to the optimal management of acute heart failure patients. Many tools are available for in‐hospital monitoring of patients with acute heart failure, and each plays a role at various points throughout the patient's treatment course, including the emergency department, intensive care or coronary care unit, and the general ward. As a result of diverse precipitants, left ventricular end‐diastolic pressure (LVEDP) and natriuretic peptides (NPs) increase (red curve) and their elevation precedes worsening of congestion (black curve). This pattern may be useful to identify early subclinical decompensation. In spite of symptomatic improvement as a result of in‐ hospital therapies for a subset of patients, high LVEDP and NP values are still persistent during hospitalization and in the early post‐ discharge period, and identification of haemodynamic congestion is crucial for preventing early post‐discharge adverse events in these patients. Yellow arrows represent continuous monitoring; yellow boxes indicate suggested monitoring repeated at various time points. BP, blood pressure; cTn, cardiac troponin; ECG, electrocardiogram; ECHO, echocardiogram; GDMT, guideline‐directed medical therapy; HR, heart rate; IV, intravenous; RR, respiratory rate; SaO2, oxygen saturation. *Invasive BP monitoring and blood gases may be indicated in the intensive or coronary care unit and in most critical patients. †Continuous telemetry monitoring in selected patients. ‡In the de novo patient, oral GDMT is started stepwise when the patient is stabilized. In patients with worsening chronic heart failure, ongoing medications should be continued at the highest tolerated dose as appropriate for the clinical situation.
Table 2. Gaps in knowledge and priorities for research
Topic Research priorities
Body weight, urine output,
and fluid balance Impact of daily weight and fluid balance monitoring
Quantify and validate definition for diuretic responsiveness (e.g. urine sodium loss) vs. diuretic resistance
Electrolytes Normalization of serum sodium during hospitalization
Guiding diuretics or alternative treatment (e.g. haemofiltration) based on electrolytes (particularly sodium and chloride)
Markers of kidney function Prospectively test decongestive strategies guided by kidney biomarker profiles
Evaluate the impact of various strategies (i.e. primarily vasodilator‐based vs. primarily diuretic‐based) on kidney marker profiles and clinical outcomes
Examine pathophysiology of serum creatinine increases in the context of decongestion
Identify and validate new kidney markers for accurate reflection of renal function in acute settings
Liver function Assess utility of liver function markers to evaluate decongestion and guide treatment decisions
Prospectively test whether markers of cholestasis (reflecting congestion) and/or markers of hypoxic hepatitis (reflecting hypoperfusion) offer additional prognostic and therapeutic information to clinical evaluation
Cardiac biomarkers Validate the multimarker approach for informing diagnosis and prognosis
Establish the incremental value of a multimarker approach, including the combination of biomarkers with imaging markers
Identify markers of low‐risk that can facilitate safe early discharge from the emergency department or hospital
Identify biomarkers to guide therapy selection (i.e. precision medicine) or monitor response to therapy and improve patient outcome
Rhythm monitoring Delineate which patients need continuous ECG monitoring
Validate risk prediction tools (e.g. scores, biomarkers, clinical assessment, history, or a combination of these) used to triage patients for ‘high‐intensity inpatient monitoring’ or ‘low‐intensity inpatient monitoring’
Echocardiography Determine the best indices of elevated LAP
Evaluate using LAP indices or cardiac output to guide decongestive therapy
Identify echocardiography findings that indicate a need for inotropic support
Determine criteria that indicate failure of medical therapy and need for mechanical support Lung ultrasound Evaluate lung ultrasound (i.e. changes in the quantity of B‐lines) to guide decongestive
therapy
Determine utility of lung ultrasound to indicate discharge readiness
Directly compare B‐lines with chest X‐ray
Non‐invasive monitoring Validate thoracic bioimpedance to assess volume responsiveness and central haemodynamic response to physiological and pharmacological stimulation
Identify target values for microvascular flow
Determine how therapeutic interventions could be tailored to microvascular flow data
Evaluate the usefulness of microcirculation assessments for guiding treatment decisions
Comparison of direct vs. surrogate measurements of microcirculation Risk score Externally validate risk stratification and prognostic scores
Evaluate generalizability of scores
Determine whether application of risk scores improves patient outcome (i.e. through better risk stratification, application of appropriate therapies or better health care utilization)
Clinical monitoring
Overview
Congestion is present in >90% of patients and is the leading cause of hospitalization in patients with AHF.6,8,9 Most patients present as ‘wet and warm’ with normal or elevated blood pressure and adequate perfusion, symptoms (e.g. dyspneoa, orthopnoea, breathlessness on minimal exertion, abdominal discomfort, or loss of appetite), and signs (e.g. pulmonary rales, oedema, elevated jugular venous pressure, hepatomegaly, ascites) of congestion due to either volume overload or fluid redistribution.6 Since a single clinical symptom or sign may lack sensitivity or specificity, clinical decisions should be based on comprehensive evaluation of all findings.10 Congestion in the setting of AHF is also associated with organ dysfunction and poor prognosis.11-13 Far fewer patients present with symptoms or clinical signs of hypoperfusion or cardiogenic shock (e.g. cool sweaty extremities, oliguria, mental confusion, dizziness, hypotension, narrow pulse pressure), but these situations require urgent interventions to be taken to prevent ensuing death.14 In the ESC Heart Failure Long‐Term Registry, 70% presented with congestion without hypoperfusion, 13.6% with congestion and hypoperfusion, and 0.9% with hypoperfusion without congestion.15
The clinical picture may be more dramatic in new‐onset, acute de novo patients than in patients with chronic heart failure who present with gradually worsening dyspnoea. In the EuroHeart Failure Survey II, the prevalence of pulmonary oedema was 26% in patients with de novo AHF and 10.4% in patients with acutely decompensated chronic heart failure. Cardiogenic shock occurred in 6.8% of acute de novo heart failure patients and in 2.2% of acutely decompensated chronic heart failure patients.8
The initial primary therapeutic objectives in AHF are the control of symptoms and relief of congestion and fluid overload while preventing further organ injury.6,13 The ESC guidelines recommend daily assessment of weight and accurate fluid balance charting.6,16 While perhaps intuitive, data are scarce linking these practices with improved management or outcome.
Non‐invasive vital sign monitoring
In accordance with the ESC guidelines, non‐invasive monitoring of blood pressure, respiratory rate, and pulse oximetry should be performed at the time of initial presentation (class I, level of evidence C).6,17 Although not specified in the guidelines, these measurements should be repeated at intervals based on the changing clinical status of the patient. Rapid changes in vital signs may indicate multi‐organ injury.13 For those more severely ill or with a very dynamic clinical profile, this may be every 15 min. In those patients whose profile changes gradually and who are less severely ill, this could be as infrequent as three times daily. Of note, recent advances in pulse oximetry technology may provide broader information, including perfusion index and some indirect indices of cardiac output,18 but more research is needed.
Body weight, urine output, and fluid balance
Monitoring weight change and targeting a negative net fluid balance assumes that congestion is always accompanied by fluid overload and weight gain. However, as many as 50% of patients with AHF are hospitalized without significant weight gain in the days to weeks before presentation.19-21 Pulmonary congestion, manifested as a rise in left‐ and right‐sided filling pressures, often can occur without significant weight gain or even relative hypovolaemia through volume redistribution.13,22,23 Thus, first establishing the patient's volume phenotype (i.e. redistribution vs. overload recognizing there is overlap) is critical to facilitate the value of body weight monitoring. Nevertheless, it is reasonable to monitor weight (class I, level of evidence C) and targeting a specific euvolaemic weight may be appropriate in many patients. Weight gain that immediately precedes a hospitalization may help identify patients who
have been non‐adherent to diet or medications, and reinforcement of education during the in‐hospital stay may be warranted for such patients. Weight gain in hospital is a predictor of 30‐day death or rehospitalization.24
Exact urine output measurement and accurate fluid charting are basic measures in intensive and cardiac care units. However, in regular wards these are more susceptible to errors. Moreover, calculation of net fluid balance should also include evaporation, which at best is an estimate. Exact and continuous measurement of urine output requires an indwelling urinary catheter, which is associated with patient discomfort, infection risk, and long‐term complications such as incontinence.6,17 The ESC guidelines do not recommend the routine use of a urinary catheter.6 Intensive care unit (ICU) patients are an exception in whom more intensive monitoring most often includes a more precise evaluation of urine output.
In case of incontinence, weighing an incontinence pad25 or use of disposable urinary sheaths in males26 may be a better approach than estimation. Emerging data suggest that urinary characteristics (i.e. urine sodium excretion/mg loop diuretic administered) can indicate either diuretic efficiency since sodium content/urine volume tends to drop quickly during decongestion, or diuretic resistance.27-29 Other quantitative measures of diuretic response, such as weight or net fluid loss per unit of diuretic (e.g. per 40 mg furosemide or equivalent), have also been proposed to assess response to decongestive therapy. There are no single cut‐offs for these indices; in general, the higher the values, the better the response. Haemoconcentration has also been proposed as a measure of decongestion.30 Poor diuretic response in patients with AHF has been associated with less symptom relief, in‐hospital worsening of heart failure, increased mortality, and higher rehospitalization rates.28,31-33
Biomarker monitoring
Arterial blood gas analysis and acid–base balance
Arterial blood gas analysis provides vital information on oxygenation, ventilation, metabolic balance, an indication of tissue hypoxia. The selective use of these may assist with determining prognosis. It is usually performed on point of care analyzers measuring the partial pressures of oxygen (pO2), carbon dioxide (pCO2) and pH. Haemoglobin oxygen saturation (SpO2) can be either calculated or measured directly. Bicarbonate and base deficit/excess are derived values from pH and pCO2. Arterial blood gas analysis is generally restricted to patients with pulmonary oedema, severe AHF (on the verge of needing artificial ventilation), cardiogenic shock, or a history of chronic obstructive pulmonary disease (class IIa, level of evidence C) and can be obtained hourly as dictated by the patient's changing condition.6
Practical interpretation of arterial blood gas measurements consists of assessing pH and the respiratory and metabolic (i.e. base deficit/excess) components, calculating the anion gap in the presence of metabolic acidosis, and evaluating the primary disturbance and compensatory response. The most common acid–base imbalance in AHF is respiratory alkalosis, but metabolic acidosis, most often as a sign of poor end‐organ perfusion, has been associated with an increased mortality risk.34 Of note, both metabolic acidosis and alkalosis are associated with increased mortality.35 The prognostic value of admission pO2 and pCO2 remains controversial.36 The ratio of pO2/fraction of inspired oxygen gives a better impression of the adequacy of pulmonary gas exchange than pO2 alone. A high correlation has been demonstrated between pCO2 and pH measured in venous and arterial blood;37,38 thus, venous blood gas analysis is a very good alternative method, especially in those patients in whom pulse oximetry is over 90%.
The veno–arterial gradient in pCO2 measured in central lines can be used as a marker of tissue perfusion, although not specifically recommended in the ESC guidelines. Veno–arterial pCO2 gradient is affected by microvascular perfusion, as well as metabolism. As flow adapts to metabolism, an increased veno–arterial gradient in pCO2 (>6 mmHg) suggests that tissue perfusion is inadequate.39 An increased veno–arterial pCO2 gradient has been associated with poor outcome.40
Lactate
Lactate, measured from either venous or arterial blood, is a very important indicator of tissue hypoperfusion. Elevated lactate levels may result from either excess production, impaired lactate clearance (e.g. liver dysfunction), or both. While lactate is often of anaerobic origin in the early hours after the onset of circulatory failure, other sources of lactate predominate at later stages.41 Hence, lactate is a good marker of tissue perfusion mostly in the early stages of circulatory failure. Elevations in lactate can cause metabolic acidosis, and lactic acidosis is a common cause of raised anion gap. Lactate concentrations >2 mmol/L are generally considered as abnormal and associated with higher mortality, but levels at the higher end of the normal reference range (>0.75 mmol/L) have also been associated with slightly increased mortality in patients admitted to the ICU.42 Furthermore, lactate levels that do not decrease following appropriate treatment are associated with a poor outcome.43,44 The optimal measurement intervals are not specifically described in the guidelines, but practically, lactate levels should be assessed in haemodynamically unstable or hypoxaemic patients with AHF at the time of admission and repeated at shorter intervals initially (e.g. every 1–2 h) during the acute phase of hospitalization. The lactate time interval can then be increased as the patient stabilizes.44
Electrolytes
Electrolytes should be routinely measured on admission in patients with AHF (class I, level of evidence C) together with serum creatinine and urea nitrogen (Table 1).6 During administration of vasoactive and diuretic therapy, electrolytes should be reassessed at least daily until discharge, particularly if intravenous loop diuretics are used, with more frequent testing if clinically indicated6 (e.g. with deteriorating renal function or initiation of renin–angiotensin–aldosterone system antagonists). Serum hyponatraemia at admission predicts poor prognosis in patients hospitalized for AHF.45,46 Additional testing is needed to distinguish between depletional and dilutional hyponatraemia as this will guide further therapy.47 Hypo‐ or hyperkalaemia are associated with arrhythmias (e.g. QT prolongation, torsades de pointes, or other life‐threatening arrhythmias), and confirmed abnormal potassium levels should be corrected. Hypokalaemia as well as hypomagnesaemia are risk factors for new‐onset atrial fibrillation.48 Chloride plays a role in renal salt sensing, neurohormonal activation, and regulation of diuretic targets, and hypochloraemia predicts mortality in acute and chronic heart failure.49
Markers of kidney function
The optimal measurement of renal function is uncertain, particularly in the acute setting and interpretation should consider the absolute value as well as the change from baseline. The use of serum creatinine to estimate glomerular filtration rate (eGFR), which is only one of the three major aspects of kidney physiology (filtration, absorption, secretion) has known limitations (e.g. imprecision in non‐steady state situations, influenced by muscle mass, tubular secretion affected by certain drugs, influenced by diet),50,51 but it remains the standard in most hospitals. Measuring serum creatinine is inexpensive, and studies of other renal markers (e.g. cystatin C, neutrophil gelatinase‐associated lipocalin) have not generated sufficient evidence of superiority over repetitive serum creatinine measurements.
Frequent, most often daily, monitoring of renal function is recommended by the current guidelines when intravenous treatments are administered or when renin–angiotensin–aldosterone system antagonists are initiated (class I, level of evidence C; Table 1), although guidelines do not give specific recommendations for responding to these measurements (Table 3).6 Importantly, decreases in eGFR most often occur during the first days of hospitalization, which suggests they are caused either by administered treatments or were secondary to congestion and already in the process of worsening before admission.52,53 Decongestion can result in either improvement or worsening of renal function, such as an initial improvement followed by decline or vice versa. Worsening renal function is associated with poor outcome both in acute and chronic heart failure.54 Importantly, small (<15–20%) changes in eGFR can be accepted if the patient is effectively being decongested, a concept based on recent data that suggest such
changes are not associated with worse outcome.55,56 Additionally, most of the changes observed are related to alterations in intraglomerular haemodynamics that result from differences in the tonus of the afferent and efferent glomerular arterioles and are not linked with adverse outcomes.57 However, in the case of worsening eGFR, decreasing urinary output, and persistent congestion, further actions need to be taken.57 Congestion is an important driver of worsening renal function and, as outlined previously, also related to worse prognosis.
Table 3. Potential use of biomarkers in acute heart failure Potential clinical
use Biomarkers
Evidence
level* Current role in clinical practice Limitations
Diagnosis of AHF
NPs Level 1 Well established, recommended† NPs also influenced by age,
obesity, renal function, atrial fibrillation, concomitant medications (e.g. ARNI and BNP)
Diagnosis of concomitant diseases
Infection (CRP, WBC, PCT) Level 3 Well established, recommended†
Renal dysfunction (creatinine, urea, others)
Level 3 Well established, recommended† Anaemia (Hb, ferritin,
transferrin saturation)
Level 3 Well established, recommended† Liver function (AST, ALT,
alkaline phosphatase, GGT, INR), lactate
Level 3 Well established, recommended†
Risk stratification Many biomarkers (e.g. NPs, MR‐proADM, troponins, sST2, GDF‐15, renal markers, multi‐ markers)
Level 4 NP and troponin generally available; other markers have limited clinical availability in some locations; risk scores should be applied when available
Useful for assessing prognosis, but lack of evidence that biomarkers facilitate clinical actions that improve outcome Select treatment
or predict response to treatment
PCT for use of antibiotics in AHF
Level 3 Currently investigational Limited evidence, prospective study ongoing
Determine treatment effects
NPs, lactate, sST2, haemoconcentration
Level 4 No general recommendation Treatment‐induced changes in biomarkers not yet directly linked to clinical outcome Monitor safety Renal function, liver function Level 5 Highly recommended†, but expert
opinion only. No recommendations on how to act based on biomarker(s)
Current renal function markers (i.e. SCr) do not adequately reflect changing eGFR in acute settings
Monitor post‐ discharge outcome
NPs Level 4 Recommended† to measure at
discharge, but clinical consequences unclear
NPs also influenced by age, obesity, renal function, atrial fibrillation, concomitant medications (e.g. ARNI and BNP)
Other biomarkers such as sST2, Gal‐3, GDF‐15
Level 5 Limited clinical availability in some locations or investigational
AHF, acute heart failure; ALT, alanine aminotransferase; ARNI, angiotensin receptor–neprilysin inhibitor; AST, aspartate aminotransferase; BNP, B‐type natriuretic peptide; CRP, C‐reactive protein; eGFR, estimated glomerular filtrate rate; GGT, gamma‐glutamyl transferase; Gal‐3, galectin‐3; GDF‐15, growth differentiation factor‐15; Hb, haemoglobin; INR, international normalized ratio; MR‐proADM, mid‐regional pro‐adrenomedullin; NP, natriuretic peptide; PCT, procalcitonin; SCr, serum creatinine; sST2, soluble ST2; WBC, white blood cells.
* Level 1: different prospective studies showing that biomarker(s) change management of patients with positive effect on outcome.
Level 2: one prospective study showing that biomarkers may change management with positive effect on outcome. Level 3: retrospective studies suggesting that biomarker may change management, but not yet prospectively tested.
Level 4: different prospective studies showing positive findings, but no consequences of changes in therapy/management tested.
Level 5: retrospective studies only/limited results with no impact on management/therapy. † Recommended by the authors.
Markers of liver function
Liver function tests should be performed on admission in accordance with current guidelines (class I, level of evidence C).6 Liver dysfunction in AHF is most commonly the result of elevated central venous pressure and manifested by increases in alkaline phosphatase and gamma‐glutamyl transferase58 or total bilirubin;59 these abnormalities often improve with decongestion. Elevated transaminases occur with hypoxic liver injury in the setting of hypoperfusion, which is less common, but associated with worse outcome.13 Alternative causes for liver dysfunction should be sought if liver function tests do not normalize after decongestion has been achieved and perfusion corrected.
Cardiac biomarkers
Cardiac biomarkers are evidence‐based tools for the diagnosis of AHF and determining prognosis. The utility of biomarkers to predict response to therapy, determine treatment effects, and monitor changes in disease processes or organ‐specific function over time is an area of intense interest and research (Table 3). Recently, recommendations for their use was discussed by the American Heart Association,60 but definitive evidence of their role in clinical practice for these purposes has not been confirmed.61
Natriuretic peptides
The ESC guidelines recommend measuring a natriuretic peptide level at admission for all patients with acute dyspnoea and suspected AHF. This recommendation is based on a strong body of evidence (class I, level of evidence A; Table 1).6 Clinicians should be aware of factors that can confound interpretation of natriuretic peptide values (e.g. renal impairment, atrial fibrillation, other co‐morbidities, age, obesity). Pre‐discharge natriuretic peptide levels are also useful for prognosis,6 and pre‐discharge levels have demonstrated stronger prediction of post‐discharge outcomes than admission levels.62-64 Thus, pre‐discharge assessment of natriuretic peptides may be informative in determining readiness for discharge since a reduction of natriuretic peptide levels after decongestive therapy portends a better prognosis, but it has not yet been tested if this approach causally improves outcome and therefore it is not a specific guideline recommendation. A >30% decrease in N‐terminal pro B‐type natriuretic peptide (NT‐ proBNP) from admission was associated with a lower risk of subsequent death or readmission compared to patients without this threshold NT‐proBNP decrease.65 In patients who, based on the clinician's judgment, fail to adequately reduce BNP, a more intensified follow‐up might be warranted.
While using natriuretic peptide levels to guide treatment is of substantial interest, it has not improved clinical outcomes compared to standard care in randomized studies to date;66 most guided studies have been in the setting of chronic heart failure. In some randomized trials evaluating treatments for AHF, natriuretic peptide and other biomarker profiles improved after treatment with the agent under study, but long‐term outcomes were not improved. For example, despite favourable effects on biomarkers, patient outcomes were not improved in the SURVIVE (Survival of Patients with Acute Heart Failure in Need of Intravenous Inotropic Support),67 RELAX‐AHF‐2 (Relaxin in Acute Heart Failure‐2),68 or TRUE‐AHF (Trial of Ularitide Efficacy and Safety in Acute Heart Failure)69 trials. Post‐hoc analyses have shown an association between decreasing natriuretic peptide levels during an admission for AHF and all‐cause mortality after multivariate adjustment that included treatment allocation.70 These findings provide more evidence that clinical outcomes in AHF are influenced by multiple pathways, some of which may not be primarily related to heart failure, and natriuretic peptides alone do not appear to sufficiently reflect all relevant processes that contribute to mortality.
Cardiac troponin
Cardiac troponin obtained at admission in patients with AHF (class I, level of evidence C) is useful to evaluate the possibility of acute coronary syndrome as a precipitating factor,6,71 but a dynamic change pattern should be observed to confirm the acute myocardial infarction diagnosis according to current acute coronary syndrome guidelines.72 The majority of patients presenting with AHF will have elevated cardiac troponin levels, and although elevated cardiac troponin is associated with adverse prognosis,6 it does not necessarily indicate an acute coronary event if other criteria for acute myocardial infarction are absent. Current evidence therefore does not support the role for serial cardiac troponin monitoring in patients with AHF without an acute coronary syndrome.
Other innovative markers
Many new biomarkers have emerged in the field of AHF, but several studies have suffered from inadequate or poorly described methods, optimistically interpreted results, publication bias, and mixing of opinion vs. fact.73 Thus, guideline recommendations have not yet been made regarding their use, but future studies should determine their role. Even more importantly, no study has tested specific strategies for altering AHF treatment based on biomarker profiles.
Most biomarker studies in AHF have investigated the prognostic value of single biomarkers, but the MOCA (Multinational Observational Cohort on Acute heart failure) study showed that dual biomarker combinations improved risk stratification over a single biomarker for 30‐day [C‐reactive protein (CRP) in combination with mid‐regional pro‐adrenomedullin, soluble ST2 (sST2), or NT‐proBNP] and 1‐year survival (CRP and sST2 reclassified risk to the greatest extent).74 Similar improvements in prognostication using combined biomarkers have been demonstrated in other studies.75 However, use of these biomarker panels in clinical practice will depend on their routine availability.
The detection of important co‐morbidities is a promising application for biomarkers in patients with AHF, not only for risk assessment but primarily to assess the need for treatment of co‐morbidities (e.g. detection of bacterial infection such as pneumonia). Procalcitonin is more specific for infection than other inflammatory markers (e.g. CRP), and retrospective data suggest that both untreated bacterial infection and unnecessary antibiotic treatment in AHF are associated with worse outcome.76 IMPACT‐EU (Improve Management of Heart Failure with Procalcitonin, NCT02392689) is an ongoing prospective study of the effect of procalcitonin‐guided antibiotic therapy vs. physician‐determined antibiotic therapy on the primary endpoint of 90‐day all‐cause mortality. If effective, this approach would be one of the first proven biomarker‐guided treatment approaches in AHF.
Electrocardiography and telemetry
Rhythm disturbances and ischaemia may be a primary cause of an AHF episode.77 Conversely, haemodynamic instability may give rise to arrhythmias, or these may be iatrogenic in origin (e.g. secondary to inotrope or vasopressor administration).
Obtaining an electrocardiogram (ECG) during the initial evaluation is routine practice (class I, level of evidence C).6 Telemetry monitoring is recommended by the American Heart Association in all patients with AHF who are at significant risk of an immediate, life‐threatening arrhythmia and should be continued until the patient is stabilized.78 Telemetry monitoring may also help with detecting episodes of ischaemia. Patients hospitalized for AHF commonly have multiple co‐morbidities, and telemetry monitoring may be recommended with concomitant conditions such as acute respiratory failure, shock, acute pulmonary embolus, or renal failure with electrolyte abnormalities (e.g. hyperkalaemia) where the risk of arrhythmia is increased. It is also recommended in patients on inotropic support.
Telemetry monitoring is presumed to improve patient safety, but there is no definitive evidence that it improves patient outcomes.79-81 Continuous telemetry beds are increasingly available in many hospitals. Risk stratification tools to detect high‐risk patients and specific protocols for them may be helpful to triage which patients need telemetry to ensure efficient resource utilization since continuously monitoring all patients with AHF may be inappropriate and not cost‐effective.
Imaging
Chest X‐ray
Chest X‐ray can be an informative test in the evaluation of patients with suspected AHF, but its main utility is in identifying alternate causes for the patients' symptoms. Pulmonary venous congestion, pleural effusion, interstitial or alveolar oedema and cardiomegaly are the most specific findings for AHF.82,83 However, up to 20% of patients with AHF will have no or little congestion visible on their emergency department chest radiograph;84 thus, chest X‐ray alone cannot rule out AHF. Supine chest radiographs have limited value in the evaluation of patients with AHF.85,86 A chest X‐ray is recommended at admission in patients with suspected AHF (class I, level of evidence C). To avoid unnecessary irradiation, serial chest X‐rays are not routinely recommended.87 Evidence is lacking to support monitoring patients with AHF by chest X‐ray, and few data are available comparing chest X‐ray to other clinical and haemodynamic tools. There is old evidence from patients with chronic cardiomyopathy showing decreasing wedge pressure88 as well as clinical improvement86 before remission of chest X‐ray findings. Repeat chest X‐rays should be reserved for patients with a clearly worsening clinical condition or in whom concurrent pulmonary diseases are suspected.6 Other imaging modalities (e.g. lung ultrasound) may be used as an alternative to repeat chest X‐ray to assess congestion or diagnose pleural effusions.89
Distinguishing between pulmonary oedema and acute respiratory distress syndrome is one of the most challenging differential diagnoses in the emergency department and the ICU.90 Cardiogenic pulmonary oedema is the main radiographic differential diagnosis, but acute respiratory distress syndrome is favoured when cardiomegaly, septal lines, or pleural fluid are absent, and peripheral alveolar opacities are present.91 The Berlin definition of acute respiratory distress syndrome consists of timing, chest imaging (chest X‐ray or computed tomography scan), origin of oedema, and degree of oxygenation.92 In practice, acute respiratory distress syndrome and cardiogenic pulmonary oedema can coexist. Discrimination between the two is often difficult using chest radiography alone, but it may be improved by echocardiography to detect cardiac failure.91,93
Echocardiography
Specific guideline recommendations for the use of echocardiography in AHF are provided in Table 1. Echocardiography may also be useful for monitoring filling pressure and cardiac output; research supporting this role is further described below. The value of strain imaging in the monitoring of AHF requires further research.
Echocardiography for monitoring filling pressures
There is little evidence to date of either clinical utility or diagnostic accuracy of Doppler echocardiography indices for monitoring left ventricular filling pressures in the setting of AHF. Only a few studies simultaneously performed invasive and non‐invasive estimation of left ventricular filling pressures.94-98
The American Society of Echocardiography (ASE) and the European Association of Cardiovascular Imaging (EACVI) proposed an algorithm for estimating mean left atrial pressure based on a comprehensive assessment of diastolic indices (Table 4).99 It was originally based on expert consensus but recently has been validated in a multicentre European study against invasive measurement of left ventricular filling pressure.100 Solely assessing mitral annular velocities is poorly correlated with left ventricular filling pressures in several clinical scenarios (e.g. patients with coronary artery disease which affected basal septal or lateral segments, significant mitral annular calcification, surgical rings or prosthetic mitral valves, left bundle branch block, right ventricular pacing, cardiac resynchronization therapy, and pericardial disease).99 Several studies have also challenged the utility of E/e′ ratio for estimation of pulmonary capillary occluded pressure in patients with advanced or decompensated heart failure with reduced ejection fraction.98,101
Table 4. Echocardiography parameters to estimate cardiac pressures
Parameter and findings Interpretation
For estimation of LAP E/A ratio <0.8
Peak E velocity ≤50 cm/s99
Normal or low E/A ratio ≥2
Deceleration time <160 ms (in patients with reduced LVEF)99
Elevated LAP
Average E/e′ <899 Normal or low LAP
Average E/e′ >1499 Elevated LAP
Increased systolic and diastolic PAP estimated by CW Doppler TR systolic jet velocity
Elevated in approximately 70% of HF cases157 (match of left and right); can also be encountered in normal or low LAP
E/A ratio >0.8 and <299 Recommended assessment of peak velocity of TR jet by CW Doppler, E/e' ratio, and LA volume index for accurate evaluation
For estimation of RAP
IVC <2.1 cm that collapses >50% with a sudden inspiratory manoeuvre (i.e. sniff)158
Suggests normal RAP of 3 mmHg (range 0–5 mmHg)158 IVC diameter >2.1 cm that collapses <50% with a
sniff158
Suggests high RAP of 15 mmHg (range 10–20 mmHg)158 Scenarios in which IVC diameter and collapse do
not fit the above paradigms158
An intermediate value of 8 mmHg (range 5–10 mmHg) may be used or, preferably, other indices of RAP should be integrated to downgrade or upgrade to the normal or high values of RAP158
IVC ≤12 mm (in patients with positive pressure ventilation degree of IVC collapse cannot be used)159
RAP <10 mmHg159
Hepatic vein flow pattern Vs >Vd (systolic predominance in hepatic vein flow)158
Low or normal RAP160 Hepatic vein systolic filling fraction (VTIs/VTIs +
VTId) <55%160 or Vs/Vd <1158 (lost systolic predominance)
Elevated RAP160
CVP, central venous pressure; CW, continuous wave; HF, heart failure; IVC, inferior vena cava; LAP, left atrial pressure; LV, left ventricular; LVEF, left ventricular ejection fraction; PAP, pulmonary artery pressure; RAP, right atrial pressure; TR, tricuspid regurgitation; Vd, diastolic wave; Vs, systolic wave; VTI, velocity–time integral.
Despite these limitations, recent ASE guidelines favour the use of comprehensive echocardiography assessment to monitor therapeutic interventions and indicate that mitral inflow velocities and E/e′ are reliable indices of left atrial pressure.102 Besides, indices of diastolic dysfunction may reflect pathogenic mechanisms related to vascular and cardiac stiffness independent of filling pressures.103 In the setting of atrial fibrillation, a recent review showed that diastolic parameters such as E/e′, isovolumetric relaxation time, and E/Vp correlated with invasive filling pressure and demonstrated adequate reproducibility. For optimal acquisition in atrial fibrillation patients, cardiac cycles with controlled heart rate (<100 b.p.m.) and similar preceding and pre‐preceding RR intervals are required.104 A restrictive mitral inflow pattern on Doppler echocardiography had a diagnostic accuracy for heart failure of 91% in patients hospitalized with acute dyspnoea.105 Repeat Doppler examination after initiation of diuretic and vasodilator therapy and clinical improvement often showed markedly different findings from baseline,105 suggesting that it might be a tool to monitor response to therapy. In a single‐centre study of 60 patients, the significant decrease in E/e′ was observed as early as within the first 12 h of treatment with further decline during 48 h, contrary to the delayed response of inferior vena cava (IVC) and BNP values.106 Change in pulmonary capillary occluded pressure was strongly correlated with change in E/e′ at 48 h but not with BNP in 50 patients admitted to intensive care,94 although many factors other than left atrial pressure can affect BNP levels. Non‐invasive indices should be used cautiously in patients with heart failure with preserved ejection fraction because of the high variability of individual linear regression slopes relating E/e′ and E/Vp with invasive measures. Nevertheless, these indices have been useful to identify a cardiac source in patients who fail to wean from mechanical ventilation.107,108 Importantly, filling pressures do not always correlate with volume overload; thus, diuretic therapy cannot solely be guided by echocardiographic examination.6,109
Inferior vena cava diameter and respiratory variation can be used to estimate right atrial pressure, being similarly altered in heart failure with reduced or preserved ejection fraction7 (Table 4). In patients with advanced heart failure, echocardiographic right atrial pressure prediction methods showed modest precision; a single IVC diameter measurement was non‐inferior to complex prediction methods.110 Nagueh et al.95 also demonstrated a strong correlation between invasive and non‐invasive estimates of mean right atrial pressure in patients with acute decompensated heart failure. A recent systematic review111 showed that the diagnostic accuracy of IVC measurement parameters was generally high, with the C‐statistic ranging from 0.76–0.91 for IVC diameter and 0.66–0.93 for IVC collapsibility index.111 The novel 3D echocardiography right atrial volume index has been proposed and validated in conjunction with IVC diameter as having an incremental value for detection of elevated right atrial pressure in patients with AHF.112 Interestingly, assessment of renal venous flow might be an emerging technique to assess early changes in renal response to volume overload before overt congestion is evident.113 The reasonable diagnostic performance of pre‐specified cut‐points justifies the current guideline recommendations99 for using IVC diameter to estimate right‐sided filling pressure.
Echocardiography for monitoring cardiac output
Echocardiography is capable of monitoring cardiac output, although discontinuously, using pulsed‐ wave Doppler in the left ventricular outflow tract. Either transthoracic or transoesophageal echocardiography may be used to estimate cardiac output. However, few studies have validated the accuracy of echocardiography compared to the ‘gold standard’ pulmonary artery catheter (PAC).114 One recent study in 38 mechanically ventilated patients found high correlation (r=0.95) between cardiac output measured by PAC and cardiac output measured by transthoracic echocardiography.115 The techniques are not interchangeable when measuring cardiac output, but they may be interchangeable to follow directional changes in cardiac output.114
Echocardiography has been strongly recommended by consensus groups in patients presenting with circulatory failure.116,117 It should be noted that echocardiography allows performance of the full haemodynamic evaluation, including chamber volumes, systolic and diastolic function, and heart–lung interactions, filling pressure, and cardiac output.
Lung ultrasound
Lung ultrasound can be performed at the bedside using portable devices; thus, its application to both general medicine and emergency or intensive settings has expanded considerably. The performance of lung ultrasound is better than chest X‐ray to rule out interstitial and alveolar oedema.89,118
Many aetiologies are possible in patients presenting with acute dyspnoea. Lung ultrasound can stratify patients according to the likely underlying pathology based on visualization of B‐lines.89 B‐lines are an important and reliable marker of pulmonary congestion, but it is difficult to identify the source of pulmonary oedema (hydrostatic or non‐hydrostatic) with lung ultrasound alone. Pleural effusion is also reliably detected with lung ultrasound, with good performance and a better detection threshold than chest X‐ray. The combination of lung ultrasound and point‐of‐care natriuretic peptide testing may be helpful in the immediate evaluation of patients with dyspnoea in the emergency department.119 Lung ultrasound is helpful to differentiate cardiac vs. non‐cardiac causes of acute dyspnoea in the emergency department.120 B‐lines appear to be dynamic in nature, as they decrease in proportion to the amount of fluid removed in patients undergoing dialysis.121 They have also been shown to decrease with treatment of AHF.106,122-124 According to a recent systematic review, B‐line number changed within as few as 3 h of heart failure treatment.123 However, the number of studies and sample sizes were small and investigator blinding was inadequate.123
Invasive monitoring
Arterial, central venous, and pulmonary artery catheters
The ESC guidelines recommend the insertion of an arterial line in patients with AHF and clinical evidence of cardiogenic shock (class I, level of evidence C; Table 1).6 The arterial line allows for repetitive sampling of arterial blood gases, providing important information on oxygenation (PaO2), ventilation (PaCO2), acid–base balance, electrolytes and lactate levels.17 The continuous measurement of arterial pressure allows for the appropriate titration of vasoactive medication, if needed. Respiratory variations of invasive arterial pressure might indicate, among others, right ventricular failure or pericardial tamponade.
The central venous catheter enables the monitoring of central venous pressure and allows the safe and continuous administration of vasoactive drugs and inotropes in patients with AHF who require intensive treatment. Central venous oxygen saturation (ScvO2) can also be monitored with the central venous catheter.125 ScvO2 declines when oxygen delivery decreases and, particularly in patients with AHF, when cardiac output deteriorates. In combination with increased lactate levels and signs of organ dysfunction, a ScvO2 <60% indicates severe hypoperfusion and mandates further diagnostics and urgent treatment.
There is no agreement on the optimal method of extended haemodynamic monitoring in assessing and treating the patient in cardiogenic shock.17 One option is the PAC, i.e. Swan–Ganz catheter. A PAC may be considered in patients who, despite pharmacological treatment, present with refractory symptoms, particularly with hypotension and hypoperfusion (Table 1).6 However, data from the PAC‐Man (Pulmonary Artery Catheters in Management of Patients in Intensive Care) study did not support either benefit or harm from use of a PAC in critically ill patients (decompensated heart failure 11% of the population).126 Furthermore, the ESCAPE (Evaluation Study of Congestive Heart Failure and Pulmonary Artery Catheterization Effectiveness) trial in patients hospitalized for decompensated heart failure but not in cardiogenic shock showed that though the rate of effective decongestion was increased, the use of a PAC did not impact the number of days alive and out of the hospital at 6 months, but it was associated with more adverse events.127 Based on these data and the imbalance between potential benefits and known risks, PAC should not routinely be used to monitor patients with AHF, but it can still be justified to use PAC in selected populations. PAC is most appropriately used by experienced physicians in clinically compromised situations, where rapid evaluation of vasoactive medications or fluid balance is needed.
Risk scores
Risk scores can be useful to identify the lowest risk patients who could safely be managed in an observation unit or discharged and followed in the outpatient setting in contrast to identifying high‐risk patients who require hospital admission and to determine prognosis.128,129 Most risk scores were designed to estimate high risk, but low risk is not always simply the inverse of high risk. Calculating low risk to some extent is more useful than calculating high risk, as low‐risk patients may be safely discharged, saving expensive hospital admission.130 The same concept applies to hospitalized patients, in order to get a better selection of the best moment for hospital discharge to minimize the risk of rehospitalization.
Clearly, risk scores must be developed in patient cohorts matching the setting where they will be applied, as they are not interchangeable. A recent review found 11 risk scores (nine for hospitalized patients and two for emergency department patients) that could be applied in patients with AHF.131 Two additional scores for use in the emergency department have subsequently been developed.132,133 Although some of these risk scores reached promising high discriminatory capacity (C‐statistic for EHMRG risk score 0.807; C‐statistic for MEESSI‐AHF risk score 0.836), none have been sufficiently validated or prospectively tested to support widespread use.129
Role of nursing in clinical monitoring
Nurses are involved across the continuum of care from early identification of AHF or decompensated heart failure symptoms, to monitoring the patient's response to therapeutic intervention,17 early facilitated discharge,134 and prompt community follow‐up.135 As key members of the multidisciplinary team, they are responsible for the 24 h monitoring of patients admitted with AHF ensuring effective communication among professionals as well as education and support to patients and caregivers. Over recent years, evidence has shown the value of nurse‐led interventions, in terms of improved survival and quality of life as well as reduced length of hospital stay and rates of readmission.17,136-138 Reviewing patients during the critical post‐discharge phase (7–14 days) enables evaluation of clinical status and patient's self‐ management behaviours.
Potential future monitoring applications
Non‐invasive haemodynamic monitoring
The complications associated with invasive monitoring (e.g. mechanical complications and infectious risks) have contributed to the development of non‐invasive technologies. Non‐invasive techniques are undergoing considerable development, although none can be currently recommended for routine clinical use. Invasive techniques such as the PAC and transpulmonary thermodilution remain the reference standard.
Contour of the pulse wave
Several algorithms have been proposed to determine cardiac output based on determination of systolic area by analysis of the contour of the pulse wave.139 In most cases, these signals are obtained from an arterial line. The system may be calibrated (by transpulmonary thermodilution or lithium dilution) or not. Some of the non‐calibrated systems estimate arterial elastance and vascular tone.140
Digital photoplethysmography
Digital photoplethysmography is a technique for continuous measurement of blood volume changes.141,142 Severe skin vasoconstriction, which is common in cardiogenic shock, impairs signal quality of blood pressure and is an important limitation of the technique. These monitors are not useful when arterial impedance is variable, such as with vasoconstrictor administration, unless given continuously and steady state has been reached. Digital photoplethysmography techniques do not appear to be sufficiently effective in assessing cardiac output in resuscitation patients with microcirculatory disorders, peripheral vasoconstriction, or high blood pressure lability.143,144
Thoracic bioimpedance
Transthoracic electric bioimpedance, also called impedance plethysmography or impedance cardiography, is a non‐invasive method for measuring cardiac output.145 Several haemodynamic parameters can be measured and calculated using the technique including flow (e.g. stroke volume/stroke index), resistance (e.g. systemic vascular resistance/index), contractility (e.g. cardiac power index, systolic time ratio, pre‐ejection period, left ventricular ejection time, velocity index, acceleration index), and fluid (e.g. thoracic fluid content).146-148
Thoracic bioimpedance data may be informative in several clinical contexts, such as fluid management in patients with AHF,146,149 and the differentiation of cardiogenic from pulmonary causes of acute dyspnoea, among others.150 Bioimpedance might be useful for trend analysis, but the data should be interpreted cautiously, as the method is associated with limitations that may affect its accuracy (e.g. diseases of the aortic valve or aorta, arrhythmias, acute changes in tissue water such as pulmonary or chest wall oedema or pleural effusion, mechanical ventilation, body motion, and factors that affect conductivity between the electrodes and the skin like temperature and humidity).147,151-153
Bioreactance has a higher signal‐to‐noise ratio,145,148 and initial validation studies revealed promising results in different clinical settings.154 Currently available data are insufficient to support guideline recommendations for use of bioimpedance and bioreactance in the routine monitoring of patients with AHF, although new systems show potential promise.
Videomicroscopy
Microvascular perfusion can be directly assessed by videomicroscopic techniques, mostly applied sublingually, although these are employed more often as research tools and are not widely applicable in routine clinical practice. Microcirculatory perfusion is altered in patients with AHF and cardiogenic shock.155 Alterations in microvascular perfusion are more severe in non‐survivors.155,156 More importantly, changes over time also differ between survivors and non‐survivors. Sublingual perfused capillary density may be an effective tool to measure tissue microvascular perfusion and estimate prognosis.156 Measurements of veno–arterial pCO2 differences may be an interesting surrogate.39
Conclusion
Many tools are available for the in‐hospital monitoring of patients with AHF, and each may play a role at various points throughout the patient's treatment course (Table 5, Figure 1). At present, clinical judgment guides the application of many of these tools. Physicians must set goals for monitored variables and tailor management according to their comprehensive interpretation of acquired clinical, biochemical, haemodynamic, and physiologic patient data. Future research initiatives should aim to identify the optimal in‐hospital monitoring strategies for patients with AHF that reduce morbidity, prolong survival and are safe and cost‐effective.
Table 5. Use of monitoring across points of care delivery
Emergency department Intensive care unit/coronary
care unit General ward
Patient population All patients Cardiogenic shock; pulmonary
oedema
Congestive heart failure/‘wet and warm’
Non‐invasive vital sign monitoring
At initial presentation and regularly during ED stay (blood pressure, heart rate, respiratory rate, pulse oximetry)
See haemodynamic monitoring (continuous blood pressure, respiratory rate monitoring)
Ideally three times daily, but at a minimum once daily (blood pressure, respiratory rate, pulse oximetry)
Body weight On admission if possible/available Daily when possible (requires specific bed with a scale)
Daily Urine output/fluid
balance
Check response to first dose of diuretic in the ED
Daily monitoring of net fluid balance
When indicated; urinary catheter not recommended Blood gases and
lactate
See ICU/coronary care unit recommendation
On admission to ICU and every 1–2 h during acute phase, then decrease frequency
As indicated by clinical situation and co‐morbidities Electrolytes and
markers of renal function
All patients Daily or more often if clinically
indicated
Every 1–2 days until discharge
Complete blood count
All patients As indicated by clinical
situation and co‐morbidities
As indicated by clinical situation and co‐morbidities
Liver function All patients As indicated after decongestion
achieved
As indicated by clinical situation and co‐morbidities Cardiac biomarkers NP and cTn
ST2 may be considered
cTn only to evaluate for suspected AMI
NP may be considered pre‐ discharge
Procalcitonin On admission
Procalcitonin may be useful in patients with suspected coexisting infection
As indicated by clinical situation and co‐morbidities
As indicated by clinical situation and co‐morbidities ECG and telemetry
monitoring
ECG on admission, telemetry in selected cases
All Continuous telemetry in
selected cases
Chest X‐ray On admission Only as needed Only as needed
Echocardiography Immediate echocardiography in patients with haemodynamic instability (cardiogenic shock) and in patients suspected of acute life‐threatening structural or functional cardiac abnormalities
Upon ICU admission (unless direct admission from ED) and repeated as needed
Early (preferably within 48 h of admission) in de novo patients and those with unknown cardiac function.
Repeated echocardiogram not needed unless relevant deterioration (or lack of improvement) in clinical status Lung ultrasound Lung ultrasound if available As indicated by clinical
situation and co‐morbidities; assessment of decongestion
As indicated by clinical situation and co‐morbidities; assessment of decongestion Haemodynamic
monitoring
Non‐invasive measurements of blood pressure
Invasive blood pressure; CVC; cardiac output monitoring (various devices); PAC in selected patients in cardiogenic shock
N/A
AMI, acute myocardial infarction; cTn, cardiac troponin; CVC, central venous catheter; ECG, electrocardiogram; ED, emergency department; ICU, intensive care unit; N/A, not applicable; NP, natriuretic peptide; PAC, pulmonary artery catheter.