Genomic Studies in
Non-Alcoholic Fatty Liver Disease
Yang-Lin Liu
A thesis submitted to the University of Newcastle for the Degree of Doctor of Philosophy
Institute of Cellular Medicine Newcastle University
i
Abstract
Non-alcoholic fatty liver disease (NAFLD) encompasses a spectrum that spans simple steatosis, through steatohepatitis (NASH) to fibrosis and ultimately cirrhosis. NAFLD is characterised by substantial inter-patient variation in rate of progression and disease outcome: whilst up to 25% of the general population are at risk of progressive disease, only a minority experience associated liver-related morbidity. Inter-patient genetic variation and environment determine severity and progression of NAFLD. This thesis reports a series of studies examining the association of genetic variations in two genes patatin-likephospholipase domain-containing 3 (PNPLA3,
rs738409 c.444 C>G, p.I148M) and transmembrane 6 superfamily member 2, (TM6SF2, rs58542926 c.449 C>T, p.E167K) with severity of NAFLD and risk of NAFLD-associated hepatocellular carcinoma (HCC).
Addressing first the role of PNPLA3, I demonstrate that the rs738409 variant is associated with steatosis, steatohepatitis and fibrosis in the largest histologically characterised NAFLD cohort of European-Caucasian descent (n=1,005) studied to date. Subsequently, adopting a case-control analyses in a cohort of 100 consecutive Northern European Caucasian patients with NAFLD-associated HCC arising and a cohort of patients with histologically characterised NAFLD, I demonstrate that carriage of the rs738409 minor (G) allele is significantly associated with increased risk of developing NAFLD-associated HCC, independent of potential confounding factors including gender, age at diagnosis, presence of advanced fibrosis/cirrhosis, T2DM and BMI.
During my studies, a genome-wide association study identified a SNP in TM6SF2 as a modifier of hepatic triglyceride accumulation measured by MR Spectroscopy. It was therefore pertinent to determine whether this variant also affected risk of
steatohepatitis or fibrosis in NAFLD. Using the aforementioned cohorts, I
demonstrate for the first time that, in addition to its association with steatosis, the rs58542926 SNP is significantly associated with stage of fibrosis in NAFLD. In contrast to PNPLA3 however, no association with NAFLD-HCC was found. In conclusion, the current thesis confirms the association of PNPLA3 with NAFLD severity and provides new evidence of its association with HCC risk. In addition, it
ii
demonstrates for the first time that TM6SF2 is associated with NAFLD-fibrosis
severity. These studies provide important new insights into NAFLD pathogenesis and mandate further functional study.
iii
Acknowledgements
I would like to show my gratitude to my supervisors Professor Quentin M. Anstee, Professor Ann K. Daly, and Professor Christopher Day for giving me the opportunity to work in their lab and for their full guidance and support throughout this journey. I am grateful for the support and help of my colleagues: Julian Leathart, Julia Patch, Jeremy Palmer, Mohammad Alshabeeb, Tom Chamberlain, Salah Abohelaika, Salwani Bakar, Wipaporn Phatvej, Olivier Govaere, and Emma Scott.
I am also grateful for the support of my dearest friends through this journey: Yvonne Lai, Shirley Ho, Tawei Wang, Axilleas Floudas, Eirini Giannoudaki, Evie Mallini, Karolien Jordens, Michael Jin, and Chiao-En Peter Wu.
This thesis would not have been possible without the support of my supervisory team and most importantly, my beloved family. I thank my father and my sisters for their love, encouragement and many years of support. I owe my deepest gratitude to my late mother for her endless love, support, patience and understanding throughout this time. This work is dedicated to her.
iv
Declaration of Originality
I hereby certify that the work described in this thesis is entirely my own, except where specifically stated otherwise.
v
Table of Contents
Abstract ... i Acknowledgements ... iii Declaration of Originality ... iv Table of Contents ... v Publications ... ix Abbreviations ... xList of Figures ... xvi
List of Tables ... xvii
Chapter 1. Introduction ... 1
1.1 NAFLD ... 2
1.2 Epidemiology ... 3
1.3 Diagnosis, staging and grading of NAFLD ... 4
1.3.1 Diagnosis ... 4
1.3.2 Staging and grading of NAFLD ... 7
1.4 Natural history of NAFLD ... 10
1.5 Risk factors ... 16
1.5.1 NAFLD and obesity ... 17
1.5.2 NAFLD and type 2 diabetes mellitus ... 18
1.5.3 NAFLD, cardiovascular disease and chronic kidney disease ... 19
1.6 Pathogenesis ... 20
1.6.1 Lipid metabolism in NAFLD ... 21
1.6.2 Oxidative stress ... 23
1.6.3 Lipotoxicity and insulin resistance in NAFLD ... 28
1.7 Genetics of NAFLD ... 31
1.7.1 Evidence for a heritable component to NAFLD ... 31
vi
1.7.3 Identified genetic risk factors for NAFLD by GWAS ... 34
1.8 Aims ... 49
Chapter 2. Materials and Methods ... 50
2.1 Patients ... 51
2.2 Liver biopsy ... 51
2.3 Laboratory methods ... 53
2.3.1 Materials ... 53
2.3.2 DNA extraction from blood samples ... 54
2.3.3 Polymerase chain reaction (PCR) ... 54
2.3.4 Genotyping ... 56
2.3.5 Statistical analysis ... 60
2.4 Tissue culture ... 60
2.4.1 Cell culture conditions ... 60
2.4.2 DNA/RNA isolation from cultured cells ... 61
2.4.3 Western-blot analysis ... 65
Chapter 3. Candidate Gene Association Study between PNPLA3 and Severity of NAFLD in FLIP Cohort ... 70
3.1 Introduction ... 71
3.2 Methods ... 73
3.2.1 Patients ... 73
3.2.2 Liver biopsy ... 73
3.2.3 DNA preparation from blood samples ... 73
3.2.4 PNPLA3 SNPs genotyping ... 73
3.2.5 Statistical analysis ... 74
3.3 Results ... 77
3.3.1 PNPLA3 rs738409 genotype analyses ... 77
3.3.2 PNPLA3 rs139051 genotype analyses ... 81
vii
Chapter 4. TM6SF2 rs58542926 Influences Hepatic Fibrosis Progression in Patients
with Non-Alcoholic Fatty Liver Disease ... 88
4.1 Introduction ... 89
4.2 Methods ... 92
4.2.1 Patients ... 92
4.2.2 Liver biopsy ... 92
4.2.3 DNA preparation from blood samples ... 93
4.2.4 TaqMan SNP genotyping assays ... 93
4.2.5 Statistical analysis ... 93
4.3 Results ... 96
4.3.1 Increased TM6SF2 rs58542926 C>T minor allele carriage in NAFLD ... 96
4.3.2 TM6SF2 and degree of histological steatosis ... 97
4.3.3 TM6SF2 and severity of histological steatohepatitis ... 97
4.3.4 TM6SF2 and stage of histological fibrosis ... 100
4.4 Discussion ... 102
Chapter 5. Genetic Modifiers for NAFLD-Associated Hepatocellular Carcinoma .... 108
5.1 Introduction ... 109
5.2 Methods ... 111
5.2.1 Patients ... 111
5.2.2 Liver biopsy ... 112
5.2.3 DNA preparation from blood samples ... 112
5.2.4 PNPLA3 rs738409 and TM6SF2 rs58452926 genotyping ... 112
5.2.5 Statistical analysis ... 112
5.3 Results ... 114
5.3.1 Cohort characteristics ... 114
5.3.2 PNPLA3 rs738409 C>G polymorphism carriage is associated with increased risk of HCC relative to a tertiary centre NAFLD cohort ... 115
5.3.3 PNPLA3 rs738409 C>G polymorphism carriage in NAFLD-HCC relative to an unselected population cohort ... 115
viii
5.3.4 Contribution of the PNPLA3 rs738409 C>G polymorphism to
NAFLD-HCC risk is independent of presence of cirrhosis ... 119
5.3.5 TM6SF2 rs58542926 C>T polymorphism and risk of hepatocellular carcinoma ... 121
5.4 Discussion ... 122
Chapter 6. Investigation of the Functional Significance of the PNPLA3 rs738409 and TM6SF2 rs58542926 ... 128
6.1 Introduction ... 129
6.2 Methods ... 131
6.2.1 Cell culture ... 131
6.3 Results ... 138
6.3.1 The role of PNPLA3 polymorphism rs738409 in vitro ... 138
6.3.2 The effect of oleic acid treatment on PNPLA3 expression in vitro ... 140
6.3.3 The effect of retinol/palmitate treatment on PNPLA3 expression in LX-2 . ... 142
6.3.4 The role of TM6SF2 rs58542926 polymorphism in vitro ... 146
6.4 Discussion ... 148
Chapter 7. General Discussion ... 152
7.1 General discussion ... 153
ix
Publications
Liu, Y.L., Patman, G.L., Leathart, J.B., Piguet, A.C., Burt, A.D., Dufour, J.F., Day, C.P., Daly, A.K., Reeves, H.L. and Anstee, Q.M. (2014) 'Carriage of the PNPLA3
rs738409 C>G polymorphism confers an increased risk of non-alcoholic fatty liver disease associated hepatocellular carcinoma', J Hepatol, 61(1), pp. 75-81.
Liu, Y.L., Reeves, H.L., Burt, A.D., Tiniakos, D., McPherson, S., Leathart, J.B., Allison, M.E., Alexander, G.J., Piguet, A.C., Anty, R., Donaldson, P., Aithal, G.P., Francque, S., Van Gaal, L., Clement, K., Ratziu, V., Dufour, J.F., Day, C.P., Daly, A.K. and Anstee, Q.M. (2014) 'TM6SF2 rs58542926 influences hepatic fibrosis progression in patients with non-alcoholic fatty liver disease', Nat Commun, 5, p. 4309.
Liu, Y.L., Day, C.P. and Anstee, Q.M. (2016) 'Can genetic influence in non-alcoholic fatty liver disease be ignored?', Clinical Dilemmas in Non-Alcoholic Fatty Liver
Disease (eds R. Williams and S. D. Taylor-Robinson).
Liu, W., Anstee, Q.M., Wang, X., Gawrieh, S., Gamazon, E.R., Athinarayanan, S., Liu, Y.L., Darlay, R., Cordell, H.J., Daly, A.K., Day, C.P. and Chalasani, N. (2016) 'Transcriptional regulation of PNPLA3 and its impact on susceptibility to nonalcoholic fatty liver disease (NAFLD) in humans', Aging (Albany NY), 9(1), pp. 26-40.
Anty, R., Liu, Y.L., Canivet, C.M., Iannelli, A., Patouraux, S., Ben-amor, I., Schneck, A.-S., Saint-Paul, M.C., Gugenheim, J., Day C.P., Daly A.K., Tran, A., Gual, P. and Q.M., A. (2016) 'The FNDC5 rs3480 is protective on the steatosis and fibrosis in patients with NAFLD', submitted to publication.
x
Abbreviations
·OH Hydroxyl radical
1H-MRS Proton magnetic resonance spectroscopy
1O2 Singlet oxygen
ABCC ATP-binding cassette, sub-family C (CFTR/MRP), member 2 ACC Acetyl-coenzyme A carboxylase
AFP Alpha-fetoprotein
AGTR1 Type-1 angiotensin II receptor Akt Protein kinase B
ALT Alanine transaminase
AMPK Adenosine monophosphate-activated protein kinase ApoB Apolipoprotein B
APOC3 Apolipoprotein C-III APOE Apolipoprotein E
AST Aspartate transaminase
ATF6 Activating transcription factor 6 ATG16L1 Autophagy related 16 like 1 ATGL Adipose triglyceride lipase ATP Adenosine triphosphate
AUROC Area under the receiver operator characteristics curve
BMI Body mass index
BSA Bovine serum albumin
CAPS 3-(Cyclohexylamino)-1-propanesulfonic acid
CARD15 Known as NOD2, nucleotide binding oligomerization domain containing 2 CD14 Monocyte differentiation antigen CD14
CE Cholesterol ester
ChREBP Carbohydrate response element-binding protein CHUK Conserved helix-loop-helix ubiquitous kinase CILP2 Cartilage intermediate layer protein 2
CKD Chronic kidney disease CPN1 Carboxypeptidase N subunit 1 CPT-I Carnitine palmitoyl transferase I CPT-II Carnitine palmitoyl transferase II
xi CT X-ray computed tomography CVD Cardiovascular disease DAG Diacylglycerol
DEN Diethylnitrosamine DEPC Diethylpyrocarbonate DM Diabetes mellitus
DMEM F-12 Dulbecco's modified Eagle's medium-F12 DNL de novo lipogenesis
ECM Extracellular matrix
eQTL Expression quantitative trait ER Endoplasmic reticulum
ERGIC ER-Golgi intermediate compartments ERLIN1 ER lipid raft associated 1
ETC Electron transport chain FADH2 Flavin adenine dinucleotide FAS Fatty acid synthase
FDFT1 Farnesyl diphosphate farnesyl transferase 1 FDR False discovery rate
FFAs Free fatty acids
FOXO1 Folkhead box protein O1 G6Pase Glucose-6-phosphatase GCKR Glucokinase regulatory protein GCL Glutamate cysteine ligase
GCLC Glutamate cysteine ligase, catalytic subunit GCLM Glutamate cysteine ligase, modifier subunit GPx Glutathione peroxidase
GS Glycogen synthase
GSH Glutathione
GSK3 Glycogen synthase kinase-3 GSSG Glutathione disulphide
GULT Glucose transporter
GWAS Genome-wide association studies GWAS Genome-wide association studies H2O2 Hydrogen peroxide
xii HapMap Haplotype map
HbA1c Haemoglobin A1c
HCC Hepatocellular carcinoma HCV Hepatitis C virus
HFE Hereditary hemochromatosis protein HIV Human immunodeficiency virus infection HMG-CoA Hydroxymethylglutaryl-CoA
HNE 4-hydroxy-2-nonenal
HOMA-IR Homeostatic model assessment HSCs Hepatic stellate cells
HSD17B13 Hydroxysteroid 17-beta dehydrogenase 13 HSL Hormone-sensitive lipase
HTGC Hepatic triglyceride content IL23R Interleukin 23 receptor IL-6 Interleukin-6
IL-8 Interlukine-8
IMT Intima-media thickness IR Insulin resistance
IRE-1 Inositol-requiring enzyme-1 IRS Insulin receptor substrates
JAK Janus kinases
KCNJ11 Potassium voltage-gated channel subfamily J member 11 KLF6 Kruppel-like factor 6
LCFAs Long chain fatty acids LD Linkage disequilibrium
LDL-C Low-density lipoprotein-cholesterol LPIN1 Phophatidate phosphatase LPIN1 L-PK Liver-type pyruvate kinase
LXR Liver X receptor
LXR-RXR Liver X receptor–retinoid X receptor LYPLAL1 Lysophospholipase-like protein 1 MAF Minor allele frequency
MAPK10 Mitogen-activated protein kinase 10 MAT Methionine adenosyl transferase
xiii
MDA Malondialdehyde
MRI Magnetic resonance imaging
mRNA Messenger RNA
mtDNA Mitochondrial DNA
mTOR Mammalian/Mechanistic target of rapamycin MTTP Microsomal triglyceride transfer protein NADH Nicotinamide adenine dinucleotide NAFLD Non-alcoholic fatty liver disease NAS NAFLD activity score
NASH Non-alcoholic steatohepatitis NASH CRN NASH Clinical Research Network
NCAN Neurocan
NEAA Non-essential amino acid
NECP: ATPIII National Cholesterol Education Program’s Adult Treatment Panel III NEFAs Nonesterifed fatty acids
NF-ĸB Nuclear factor kappa-light-chain-enhancer of activated B-cells NO· Nitric oxide
NO2· Nnitric dioxide
NR1I2 Nuclear receptor subfamily 1 group I member 2 O2- Superoxide anion
OONO- Peroxynitrite
OR Odds ratio
OXPHOS Oxidative phosphorylation PAR Population attributable risk PBS Phosphate-buffered saline
PBX4 PBX homeobox 4
PC Pyruvate carboxylase
PEMT Phosphatidylethanolamine N-methyltransferase PEPCK Phosphoenolpyruvate carboxykinase
PERK Protein kinase R-like ER kinase PI3K Phosphoinositide-3 kinase PKC Protein kinase C
PKCε Protein kinase C isoform in the liver
xiv
PPARG Peroxisome proliferator activated receptor gamma PPAR-α Peroxisome-proliferator-activated receptor α PPP1R3B Protein phosphatase 1 regulatory subunit 3B PUFAs Polyunsaturated fatty acids
PVDF Polyvinylidene fluoride
RFLP Restriction fragment length polymorphism RO· Alkoxyl radical
ROO· Peroxyl radical
SAF Steatosis, activity and fibrosis SAMe S-adenosylmethionine
SAMM50 Sorting and assembly machinery component SFAs Saturated fatty acids
SLC27A5 Very long-chain acyl-CoA synthetase
SLC2A1 Solute carrier family 2, facilitated glucose transporter member 1 SNPs Single nucleotide polymorphisms
SOD Superoxide dismutase
SREBP-1c Sterol regulatory element-binding protein-1c STAT Signal transducers and activators of transcription SUGP1 SURP and G-patch domain containing 1
T2DM Type 2 diabetes mellitus TAE Tris-acetate-EDTA TC Total cholesterol
TCF7L2 Transcription factor 7-like 2 TEMED Tetramethylethylenediamine
TG Triglycerides
TGFβ Transforming growth factor beta TLR4 Toll-like receptor 4
TM6SF2 Transmembrane 6 superfamily member 2 TNF Tumour necrosis factor
TNFα Tumour necrosis factor-alpha TRIB1 Tribbles pseudokinase 1 UPCs Uncoupling proteins
UPR Unfolded protein response VLDLs Very low-density lipoproteins
xv WHO World Health Organization
xvi
List of Figures
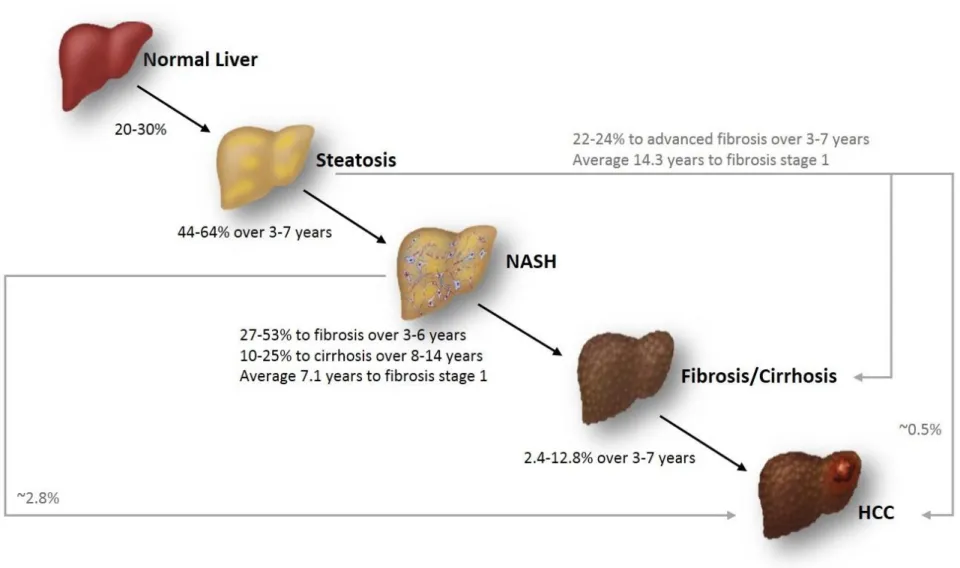
Figure 1.1: Summary of the progression and natural history of NAFLD. ... 15 Figure 2.1: Allelic discrimination is achieved by the selective annealing of TaqMan®
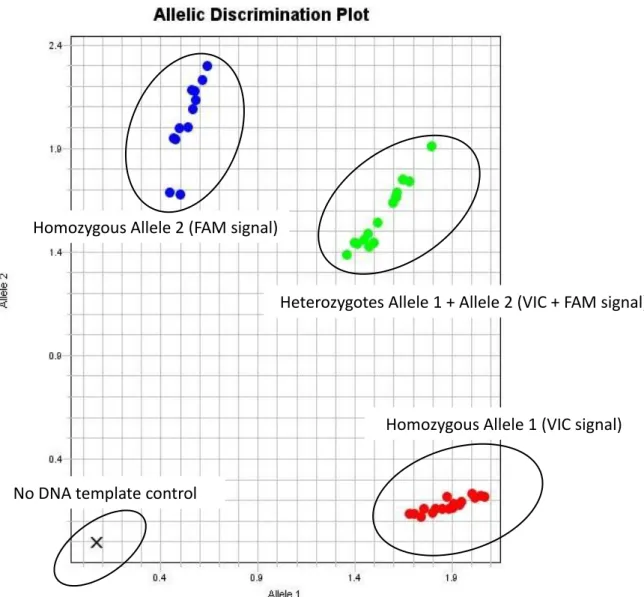
MGB probes ... 58 Figure 2.2: Example of an allelic discrimination plot of TaqMan SNP genotyping
assay. ... 59 Figure 2.3: The assembly of electrophoretic blotting sandwich. ... 68 Figure 4.1: Outcomes of the metabolic syndrome: TM6SF2 dissociates NAFLD from
cardiovascular disease. ... 107 Figure 6.1: Layout of study design and purposes for retinol or/and palmitate
treatment on LX-2. ... 135 Figure 6.2: Study procedure for group B, LX-2 treated with retinol (10 µM) alone. . 135 Figure 6.3: Study procedure for group C, LX-2 treated with palmitate (300 µM) alone.
... 136 Figure 6.4: Study procedure for group D, LX-2 treated with both retinol (10 µM) and
palmitate (300 µM). ... 136 Figure 6.5: Basal messenger RNA levels and protein expression of PNPLA3 in
HepG2, Hep3B, HUH-7, SNU182, LX-2 and primary human hepatocytes. ... 139 Figure 6.6: Effect of oleic acid on expression of PNPLA3 in the selected cell lines. 141 Figure 6.7: Effect of retinol/palmitate treatment on expression of PNPLA3 in LX-2 for
0, 12, 24, and 48 hours. ... 144 Figure 6.8: Oil red O staining of LX-2 at 4 time points. ... 145 Figure 6.9: Basal expression levels of TM6SF2 mRNA in the selected cell lines .... 147
xvii
List of Tables
Table 1.1: Comparison of the FLIP SAF Score and the NAFLD CRN Score for the
histological grading and staging of NAFLD/NASH. ... 9
Table 1.2: Genetic risk factors identified by GWAS ... 40
Table 1.3: Additional genetic risk factors for NAFLD identified in candidate gene studies. ... 41
Table 2.1: List of suppliers and addresses. ... 53
Table 2.2: Compositions of commonly used stock solutions. ... 53
Table 2.3: Reagents used for PCR. ... 55
Table 2.4: Composition of 2% agarose gel. ... 55
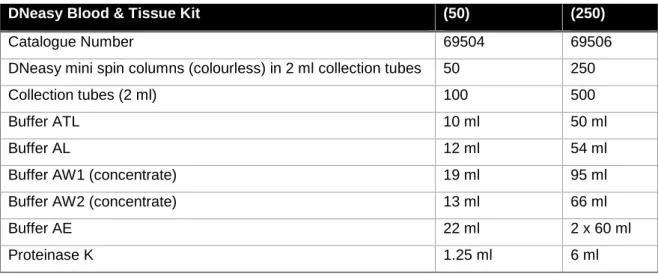
Table 2.5: DNeasy Blood & Tissue Kit contents abstracted from the QIAGEN manual provided. ... 64
Table 2.6: Materials used for RNA isolation. ... 64
Table 2.7: Reagents used for reverse transcription. ... 64
Table 2.8: Materials used for Western blotting. ... 69
Table 3.1: Clinical characteristics of FLIP cohort. ... 75
Table 3.2: Genotype frequency of PNPLA3 rs738409 in FLIP NAFLD Cohort vs. the 1000 Genomes European Caucasian population. ... 77
Table 3.3: Multivariate analysis of association between PNPLA3 rs738409 genotype and histological steatosis. ... 78
Table 3.4: Multivariate analysis of association between PNPLA3 rs738409 genotype and histological steatohepatitis. ... 79
Table 3.5: Multivariate analysis of association between PNPLA3 rs738409 genotype and histological fibrosis. ... 80
Table 3.6: Genotype frequency of PNPLA3 rs139051 in FLIP NAFLD Cohort vs. the 1000 Genomes European Caucasian population. ... 81
Table 3.7: Multivariate analysis of association between PNPLA3 rs139051 genotype and histological NAFLD. ... 83
Table 3.8: Haplotype association with NAFLD histological features and effect of each haplotype on phenotype severity in the FLIP NAFLD Cohort ... 84
Table 4.1: Patients were recruited from hepatology clinics across Europe. ... 94
xviii
Table 4.3: Genotype frequency of TM6SF2 rs58542926 in Discovery Cohort NAFLD
patients vs. the 1000 Genomes European Caucasian population. ... 96
Table 4.4: Genotype frequency of PNPLA3 rs738409 in Discovery Cohort NAFLD patients vs. the 1000 Genomes European Caucasian population. ... 96
Table 4.5: Multivariate analysis of association between TM6SF2 rs58542926 genotype and steatosis stage S0-1 (mild) vs. S2-3 (advanced). ... 98
Table 4.6: Multivariate analysis of association between TM6SF2 rs58542926 genotype and steatohepatitis stage (Activity Score A0-4). ... 99
Table 4.7: Multivariate analysis of association between TM6SF2 rs58542926 genotype and fibrosis stage F0-1 (mild) vs. F2-4 (advanced). ... 101
Table 5.1: Details of NAFLD-HCC and NAFLD Cohorts. ... 114
Table 5.2: PNPLA3 rs738409 genotype frequencies and their relationship to risk of HCC development. ... 117
Table 5.3: Comparison of selected characteristics according to PNPLA3 rs738409 genotype within NAFLD-HCC and NAFLD Cohorts. ... 118
Table 5.4: Multivariate analysis of the effect of PNPLA3 genotype on NAFLD-related HCC risk. ... 119
Table 5.5: Multivariate analysis of the effect of PNPLA3 genotype on NAFLD-related HCC risk adjusted for age, gender, BMI and diabetes but not cirrhosis. ... 120
Table 5.6: PNPLA3 rs738409 genotype frequencies and their relationship to risk of HCC development adjusted for age, gender, BMI and diabetes but not cirrhosis. ... 120
Table 6.1: Complete RPMI medium for growing HepG2, Huh-7, Hep3B and SNU182 cells. ... 132
Table 6.2: Complete RPMI medium for growing LX-2 cells. ... 132
Table 6.3: Materials used for BSA-bound oleic/palmitic acids. ... 133
Table 6.4: PNPLA3 rs738409 genotypes of the selected cell lines. ... 138
Table 6.5: TM6SF2 rs58542926 genotypes of the selected cell lines. ... 146
Table 7.1: Reanalysis focusing on clinical utility of PNPLA3 genotype testing in HCC risk prediction. ... 158
1
2 1.1 NAFLD
Non-alcoholic fatty liver disease (NAFLD) is the most common cause of liver dysfunction worldwide (Angulo, 2007; Yilmaz, 2012). It is estimated that one third of the population in Western countries is afflicted by NAFLD (Day, 2010), and the prevalence is increasing owing to its close association with metabolic syndrome (central obesity, insulin resistance/type 2 diabetes mellitus (T2DM), dyslipidaemia, hypertension and thus with cardiovascular disease (CVD)) (Sanyal and American Gastroenterological, 2002; Anstee et al., 2013b). NAFLD represents a spectrum of liver disease that ranges from steatosis to more progressive forms of non-alcoholic steatohepatitis (NASH), fibrosis, cirrhosis, and ultimately hepatocellular carcinoma (HCC) and liver failure without a history of excess alcohol consumption (Anstee et al., 2011b). Observations on fatty degeneration in the liver was first described by Thomas Addison in 1836 (Addison, 1836). A “fatty liver hepatitis” was first described by Adler and Schaffner more than three decades ago, discovering that the
histopathological patterns of non-alcoholic patients resembled those of
alcoholics (Adler and Schaffner, 1979). However, it was Ludwig that originally coined the term non-alcoholic steatohepatitis ‘’NASH’’ one year later (Ludwig
et al., 1980) whilst describing a small group of 20 patients with fatty liver disease of unknown cause. The majority of these patients were obese and had comorbidities including hyperlipidaemia and diabetes. Their liver biopsy specimens were characterized by lobular hepatitis, focal necrosis with mixed inflammatory infiltrates and Mallory bodies, the most common histological feature of alcohol-induced liver disease (Ludwig et al., 1980). In line with the resemblance of histopathology between the two diseases, several other terms as pseudo-alcoholic liver disease, alcohol-like hepatitis, diabetic hepatitis, non-alcoholic Laennec’s disease and steatonecrosis had been adopted to refer to this entity prior to the umbrella term NAFLD which was first introduced in 1986 (Schaffner and Thaler, 1986; Sheth et al., 1997). Ever since then, both clinical and research interest in NAFLD has increased, with
investigations encompassing heritability, diagnosis and natural history, the association with the metabolic syndrome, underlying mechanisms, and
3
developing possible pharmaceutical treatments (Dietrich and Hellerbrand, 2014).
1.2 Epidemiology
The prevalence of NAFLD has risen rapidly due to prevalent lifestyle habits of diets enriched in fat and carbohydrates and sedentary behaviour, which have changed profoundly over the past few decades (Angulo, 2007; Ratziu et al., 2010). However, accurate estimates of NAFLD/NASH prevalence remain challenging as the numbers vary greatly by the population studied (different ethnicities, genders, and comorbidities), and the sensitivity of the diagnostic methods employed (radiology or histology). Nevertheless, studies performed so far provide some information on the global trend of the NAFLD epidemic. A recent meta-analysis that included twenty-one population-based studies (Europe: 6, East Asia: 7, South Asia: 5, and 3 in Middle East) has
demonstrated that the pooled worldwide prevalence of NAFLD is 24.24% and was significantly correlated to economic status (Zhu et al., 2015). When taking regions/ethnicity into account, the numbers changed slightly: Western
countries have a higher incidence rate of NAFLD with 20-30% of the
population affected (Day, 2010; Masarone et al., 2014) compared to a rate of 5-18% in Asia (Masarone et al., 2014). Using proton magnetic resonance spectroscopy (1H-MRS) to assess hepatic steatosis in a multi-ethnic
population from The Dallas Heart Study, 33.6% of 2349 US individuals were found to have NAFLD. Once again, an ethnicity effect was seen: the
frequency of hepatic steatosis showed a distinct variation between Hispanics (45%), Caucasians (33%), and African Americans (17%) (Browning et al., 2004b; Szczepaniak et al., 2005). As liver biopsy remains the diagnostic gold standard to reliably assess the degree of severity of NAFLD, histological studies in apparently healthy, prospective living liver donors indicate that the prevalence of NAFLD was 12–18% in Europe (Browning et al., 2004b;
Nadalin et al., 2005) and 27–38% in the USA (Ryan et al., 2002; Browning et al., 2004b; Tran et al., 2006). Estimates increase further when populations with known risk factors are targeted. For instance, NAFLD was found in 91% of obese patients (body mass index (BMI) ≥30 kg/m2), 67% of overweight
4
(>25-<30) and 25% of normal individuals (Bellentani et al., 2004) reported by the European DIONYSOS study. Additionally, the overall prevalence of NAFLD is much greater in patients with T2DM with an incidence of 40-70% (Argo and Caldwell, 2009).
1.3 Diagnosis, stagingand grading of NAFLD
1.3.1 Diagnosis
The most common symptoms reported by NAFLD patients are fatigue,
malaise and an uncomfortable feeling or fullness in the right upper abdomen. Patients should have a history of excess alcohol intake (<20g/day for women; <30g/day for men) excluded together with alternative diagnoses including chronic viral hepatitis (hepatitis B and hepatitis C), autoimmune liver diseases, hereditary hemochromatosis, α1-antitrypsin deficiency, Wilson’s disease and
drug induced liver injury (Anstee et al., 2011a). Obesity and insulin resistance or other features of the metabolic syndrome are the most common
comorbidities found in NAFLD patients. Liver function tests in NAFLD patients are commonly within the normal range or exhibit only moderate elevations of aspartate transaminase (AST) and alanine transaminase (ALT). Generally, the AST/ALT ratio is less than one, but increases in the presence of fibrosis. Although hepatic steatosis can be demonstrated by ultrasound and other non-invasive radiological diagnostic approaches (computerised tomography (CT), proton magnetic resonance spectroscopy (1H-MRS) and magnetic resonance
imaging), a solid histopathological diagnosis of NAFLD (and the presence of NASH) can only be confirmed by the golden diagnostic method - liver biopsy which effectively documents disease stage and grade (Angulo, 2007;
Wieckowska and Feldstein, 2008; Burt et al., 2015).
1.3.1.1 Steatosis
The hallmark and initiation stage of NAFLD is hepatic steatosis, characterised by the accumulation of triglycerides (TG) affecting > 5% hepatocytes.
Steatosis in NAFLD usually is presented as a mixture of macrovesicular (large) and microvesicular (small) droplet vacuoles within hepatocytes; true
5
microvesicular steatosis is rarely detected (Yeh and Brunt, 2014). Although hepatic steatosis is generally considered to be benign or self-limited, it may progress towards NASH in some patients. A widely accepted semiquantitative method for steatosis assessment is based on the percentage of hepatocytes involvement: four different degrees of steatosis are reported, comprising <5% steatosis, 5-33%, 34-66%, and over 66% (Kleiner et al., 2005).
1.3.1.2 NASH
NASH, the more progressive form of NAFLD, is characterised by specific histological features in addition to steatosis. These include hepatocellular injury (hepatocellular ballooning degeneration) and lobular inflammation, with or without fibrosis. These key lesions usually occur in acinar zone 3, however there may be loss of acinar localization in the presence of progressive fibrosis and parenchymal remodelling (Yeh and Brunt, 2014). Hepatocellular
ballooning is characterized by a swollen shape of hepatocytes, usually enlarged and lightly stained cytoplasm, in which Mallory-Denk Bodies are frequently found on routine histology with cellular diameter > 30 µm. The loss of cytoplasmic staining of keratins 8 and 18 by immunohistochemistry has been proposed to be the key feature in identification of ballooned hepatocytes (Guy et al., 2012). Other helpful, but not necessary, morphological features for diagnosis of NASH include micrograulomas and acinar lipograulomas,
megamitochondria, apoptotic bodies, and pericellular and perivenular fibrosis (Neuschwander-Tetri and Caldwell, 2003; Sanyal et al., 2011). Lobular
inflammatory infiltrates are usually composed of lymphocytes (mainly T cells), eosinophils, macrophages, and less frequently neutrophils. Mild, chronic and mixed portal inflammation may also be present at this stage, and is suggested to be correlated with advanced severity of NASH and serological indicator of insulin resistance (IR), homeostatic model assessment (HOMA-IR) in both adult and paediatric cases (Brunt et al., 2009; Harmon et al., 2011; Smith, 2013). Notably, there is a blurred gap between steatosis and NASH
depending on whether NASH is destined to occur after steatosis or both forms are discrete entities (Cohen et al., 2011; Yilmaz, 2012). Around 10-29% of
6
NASH patients could progress to a more advanced stage of cirrhosis in a 10-year period (Argo and Caldwell, 2009).
1.3.1.3 Fibrosis and cirrhosis
Hepatic fibrosis is a result of repeated wound-healing in response to chronic liver injury, occurring in most types of chronic liver diseases (Albanis and Friedman, 2001; Bataller and Brenner, 2005). The predominant concept of liver fibrosis is the imbalance between increased generation and reduced degradation of extracellular matrix (ECM) proteins under a persistent liver injury. The excessive accumulation of ECM proteins results in the
transformation of hepatic architecture by substituting hepatocytes for ECM, including fibrillar collagens. Collagens (I, III and IV), fibronectin, undulin, elastin, laminin, hyaluronan, and proteoglycans were found to increase 6 times more than the normal level in advanced fibrotic-stage (Bataller and Brenner, 2005). Hepatic stellate cells (HSCs) are the major ECM producing source in prolonged liver injury (Gabele et al., 2003). HSCs are located in the space of Disse (between hepatocytes and sinusoidal endothelial cells) and are responsible for vitamin A storage. HSCs are activated by inflammatory insults to the liver, undergoing a phenotype transformation into myofibroblast-like cells which lay down ECM. HSC maintaining methods (activated HSC model on plastic culture dishes) from rodent and human livers were studied and established in the 1980s to provide a useful tool for researchers to investigate the essential role of HSCs in liver fibrosis (Otto and Veech, 1980; Friedman et al., 1992).
Mild fibrosis (either in zone 3 perisinusoidal or portal) can be seen in NASH patients and it can further progress to bridging fibrosis and consequent cirrhosis if inflammatory insults are sustained (Brunt et al., 1999). Patients with progressive fibrosis over a period of 15-20 years could develop cirrhosis (Bataller and Brenner, 2005). Cirrhosis, the key risk factor for development of hepatocellular carcinoma, is encountered when normal hepatic lobules are replaced by fibrotic nodules thus causing disruption of the hepatic architecture and loss of liver function (Bircher, 1999).
7
1.3.1.4 Hepatocellular carcinoma (HCC)
HCC is the fifth most frequently diagnosed cancer worldwide and the third most common cause of cancer mortality (Baffy et al., 2012). The progression to HCC is most frequently associated with cirrhosis secondary to chronic liver infections such as hepatitis B or hepatitis C viruses or by alcoholic injury, while genetically defined diseases such as hemochromatosis are associated with a lesser proportion (Bosch et al., 2005; El-Serag and Rudolph, 2007). The tumour marker blood test alpha-fetoprotein (AFP) is often used to detect liver cancer (60-70% of HCC patients are found AFP positive). However, patients with elevated AFP should be screened by radiological examinations (abdominal ultrasound, X-ray computed tomography (CT), or magnetic resonance imaging (MRI)). If serological AFP together with radiological evidence is highly significant toward to a diagnosis of liver cancer, the liver biopsy is then not warranted. The histopathological hallmark of HCC is the resemblance both in its cytology and plate-like morphology, however, this aspect is beyond the scope of this chapter and has been summarized
elsewhere (Paradis, 2013). HCC has been linked to NAFLD in a large number of epidemiological studies, illustrating several common NAFLD risk factors (overweight, obesity, insulin resistance, and diabetes mellitus) also associated with HCC morbidity (Baffy et al., 2012). Though the accurate prevalence of NAFLD-related HCC is unclear, it is suggested that 4 to 27% of cirrhotic
NAFLD patients could develop HCC (Cohen et al., 2011) while HCC is rarer in non-cirrhotic NAFLD patients (Baffy et al., 2012).
1.3.2 Staging and grading of NAFLD
A semi-quantitative scoring system – the NAFLD Activity Score (NAS) developed by NASH Clinical Research Network (NASH CRN) Pathology Committee, sponsored by National Institute of Diabetes and Digestive and Kidney Diseases, is currently the most widely used approach for grading disease severity of NAFLD and stage of fibrosis in clinical trials (Kleiner et al., 2005). It is a revision of the original NAFLD grading system proposed by Brunt et al., illustrating the NASH grades according to the combinations mixed by steatosis, ballooning and inflammation (Brunt et al., 1999). The NAS is differ
8
from the original one as it is derived from the sum of the discrete scores of steatosis (0-3), hepatocellular ballooning (0-2) and lobular (acinar)
inflammation (0-3), therefore provides a NAS range from 0 to 8. CRN also issued a 5-tier method for staging of fibrosis (0-4) (Table 1.1) (Kleiner et al., 2005).
Although NAS has been well validated in current clinical and medical practice, its sensitivity and specificity for a threshold NAS ≥ 5 as a histological
diagnosis of NASH was only 57% and 95%, respectively (Hjelkrem et al., 2011). A further report on a study performed in a cohort of 976 individuals demonstrated that only 75% of the biopsies with ‘definite NASH’ reached this threshold whilst 28% with borderline NASH, and 7% of them without NASH had NAS ≥ 5 (Brunt et al., 2011). Caution therefore should be taken when applying NAS for diagnostic purposes as the threshold value does not always reflect the actual disease severity. This discrepancy may be best explained by inter-observer-related variation among pathologists and the different
histopathological criteria adopted (Machado et al., 2006; Younossi et al., 2011).
To address this, a simplified steatosis (S), activity (A) and fibrosis (F) (SAF) score has recently been designed by the European Fatty Liver Inhibition of Progression (FLIP) consortium, in an attempt to improve inter-observer variability (Bedossa and Consortium, 2014). The key difference in SAF scoring evaluation from NASH CRN score is that the degree of steatosis is separated from those of inflammation/ballooning to prove three separate measures of NAFLD severity. Basically, the FLIP algorithm encompasses semi-quantitative scoring of the key features: steatosis (0-3), activity (0-4) as the sum for hepatocellular ballooning and lobular inflammation, and fibrosis (0-4). Hence, NAFLD activity can be histologically divided into 2 categories; mild (A <2 and/or F <2) and significant (A >2 and/or F >2). In a study with 679 obese patients, the threshold of A >2 correctly identified all patients with NASH, and none of the patients below this threshold had NASH (Bedossa and Consortium, 2014). Comparison of the SAF Score and the NAFLD Kleiner Score for the histological grading and staging of NAFLD/NASH is shown in Table 1.1.
9
Table 1.1: Comparison of the FLIP SAF Score and the NAFLD CRN Score for the histological grading and staging of NAFLD/NASH.
SAF Score (Bedossa and Consortium, 2014) Kleiner Score (Kleiner et al., 2005)
Histological Feature
Category Definition Histological Feature Category Definition Steatosis 0 1 2 3 <5% 5-33% 34-66% >66% Steatosis 0 1 2 3 <5% 5-33% 34-66% >66%
(S) Steatosis Score 0-3 PLUS
Hepatocyte Ballooning 0 1 2 None
Clusters of hepatocytes with rounded shape and pale cytoplasm
Same as grade 1 with enlarged hepatocytes (>2x normal size)
Hepatocyte Ballooning 0 1 2 None Few Many PLUS PLUS Inflammation 0 1 2 None
< 2 foci per 20x field > 2 foci per 20x field
Inflammation 0 1 2 3
None
1–2 foci per x20 field 2–4 foci per x20 field >4 foci per x20 field
(A) Total = Activity Score 0-4 (NAS) Total = NAFLD Activity Score 0-8 Fibrosis 0 1a 1b 1c 2 3 4 No fibrosis
Zone 3 mild perisinusoidal fibrosis Zone 3 moderate perisinusoidal fibrosis
Periportal/portal fibrosis only Zone 3 plus portal/periportal fibrosis Bridging fibrosis Cirrhosis Fibrosis 0 1a 1b 1c 2 3 4 No fibrosis
Zone 3 mild perisinusoidal fibrosis Zone 3 moderate perisinusoidal fibrosis Periportal/portal fibrosis only Zone 3 plus portal/periportal fibrosis Bridging fibrosis Cirrhosis
(F) Fibrosis Stage 0-4 Fibrosis Stage 0-4
10 1.4 Natural history of NAFLD
A US-based long-term study with 23-year length revealed that patients with NAFLD had higher mortality compared to those in the general population, and the outcome of a lower survival rate was associated with age (hazard ratio per decade 2.2, 95%CI [1.7-2.7], P<0.0001), impaired fasting glucose (hazard ratio 2.6, 95%CI [1.3-5.2],
P=0.005), and cirrhosis diagnosed at baseline (hazard ratio 3.1, 95%CI [1.2-7.8],
P=0.02) (Adams et al., 2005). Other studies on long-term mortality in NAFLD patients during 15 year follow-up showed 26% death rate, and this increased
profoundly to 34-69% compared to the general population sharing the same age and gender (Angulo, 2013). In general, the majority of NAFLD patients exhibit only simple steatosis which is considered to be benign and self-limited, whilst a small fraction of individuals progress to NASH, fibrosis, cirrhosis and HCC. However, recent study using serial biopsy data (a median interval of 6.6 years) has challenged this dogma, showing that 44% of the NAFLD patients with ‘pure fatty liver’ graduated to NASH, and 37% had fibrosis progression (22% of them were at advanced stage)
(McPherson et al., 2015). Another systematic study of follow-up biopsies over a mean of 3.7 years documented that 64% of NAFLD patients progressed to NASH from steatosis, while 24% developed advanced fibrosis (Pais et al., 2013). The summary of disease progression and natural history of NAFLD is displayed in Figure 1.1.
Poor disease prognosis and reduced survival is predicted once patients develop NASH. A Swedish study investigated the survival and cause of death within a cohort of 129 NAFLD patients with a mean follow-up period of 13.7 years; mortality was not increased in patients with steatosis, patients with NASH however exhibited a greater than 10-fold increased risk of liver-induced causes (2.8% versus 0.2%) and twofold higher risk from CVD-related death (15.5% versus 7.5%) compared with a matched reference population (Ekstedt et al., 2006). Estimates of disease progression from patients with NASH to fibrosis vary between 27-53% by several studies using paired serial histological data within 3-6 years (Fassio et al., 2004; Hui et al., 2005; Wong et al., 2010). Correspondingly, a recent meta-analysis pooled 11 studies with a total of 411 histologically confirmed NAFLD patients and with over 2145.5 person-years of follow-up evaluation; this study discovered that the annual fibrosis progression rate in patients with steatosis only at index biopsy was 0.07 stages (95%CI [0.02-0.11
11
stages]) and it was 0.14 stages in those with NASH (95%CI [0.07-0.21 stages]). Namely, patients with steatosis only progressed to fibrosis stage one on average in 14.3 years while the average was 7.1 years for those diagnosed with NASH at baseline (Singh et al., 2015). Another study suggested that an overall annual rate of fibrosis progression from steatosis and NASH patients at baseline were 0.067 and 0.08 stages, respectively (McPherson et al., 2015). Notably, although fibrosis
progression is generally slow, rapid progression from simple steatosis or NASH (both at F0) to F3-4 does occur in a small set of patients over a mean follow-up period of 5.9 years (Singh et al., 2015).
The increased risk of mortality in patients with NASH compared with those with steatosis could be explained by the greater incidence and the higher severity of fibrosis found in NASH patients as the presence of fibrosis is the key histological determinant of long-term prognosis (Younossi et al., 2011; Chan et al., 2014; Singh
et al., 2015). Supporting evidence from a study with 209 NAFLD patients over a median of 12.1 years demonstrated that NASH only correlated with liver-related mortality in the presence of advanced fibrosis; only F3 portal fibrosis was
independently associated with liver mortality (hazard ratio 5.68, 95%CI [1.5-21.5]) when those with histological features of NASH were selected (Younossi et al., 2011). Additional study also supports this assertion; a longitudinal study with a median follow-up period of 12.6 years recruited 619 NAFLD patients at medical centres in USA, Europe and Thailand, investigating the long-term prognostic relevance of histological features and analysing the overall mortality, liver transplantation and liver-related events as outcomes (Angulo et al., 2015). The key finding was that histologic feature of fibrosis, but no other features of steatohepatitis, was
independently associated with death, liver transplantation and liver-induced events included fibrosis stage 1 (hazard ratio 1.88, 95%CI [1.28-2.77]), stage 2 (hazard ratio 2.89, 95%CI [1.93-4.33]), stage 3 (hazard ratio 3.76, 95%CI [2.40-5.89]) and stage 4 (hazard ratio 10.9, 95%CI [6.06-19.62]).
Approximately 10-25% of NASH patients progress to extensive fibrosis and cirrhosis (McCullough, 2004; Onnerhag et al., 2014; Goh and McCullough, 2016). The natural history of cirrhosis is characterised by two phases termed ‘compensated’ and
‘decompensated’ with the status of portal pressure as the watershed. The decompensated phase is subject to a series of liver complications once portal
12
hypertension develops, including varices, portal hypertensive gastrointestinal
bleeding, ascites, jaundice, hepatic encephalopathy, and ultimately to HCC (D'Amico
et al., 2006). Accumulating data has provided some information on the mortality of cirrhosis due to NASH (Hui et al., 2003; Sanyal et al., 2006; Yatsuji et al., 2009; Bhala et al., 2011). An Australian study compared the rates of liver complications and survival between 23 patients with NASH-associated cirrhosis and those with hepatitis C virus (HCV)-related disease over 7 years follow-up; liver failure was the main cause of morbidity and mortality in NASH-related cirrhosis, but with a lower risk of HCC development despite a similar survival was seen in both groups (Hui et al., 2003). Conversely, a separate study over 10-year period (152 NASH-cirrhosis patients vs. 150 HCV-cirrhosis) reached different conclusions; compensated cirrhosis due to NASH had a lower mortality rate and lower incidence for development of ascites, hyperbilirubinemia, and HCC against HCV-cirrhosis. However, patients with NASH-cirrhosis had a higher risk of CVD-related mortality (Sanyal et al., 2006). Nonetheless, one Japanese study with 5-year follow-up using a relatively small cohort of 68 NASH cases demonstrated that similar rates of
complications of cirrhosis (ascites, varices, hepatic encephalopathy and HCC) were found in both cohorts of NASH and HCV related cirrhosis (Yatsuji et al., 2009). The discrepancy between the above studies may be explained by ethnic differences and variation in study design. Further information on the natural history of NAFLD/NASH-associated cirrhosis could be obtained from data on cryptogenic cirrhosis as there is growing recognition that NAFLD/NASH may be responsible for a great proportion of cryptogenic cirrhosis since metabolic syndrome is also the most common feature in those patients (Powell et al., 1990; Bugianesi et al., 2002). Moreover, as a frequent cause of cirrhosis, NASH is projected to be the leading indication for liver
transplantation in the US by 2020 (Ratziu et al., 2010; Sanyal et al., 2011).
As progression to advanced fibrosis and cirrhosis in NASH patients has become a global concern, this also naturally extends to the risk for development of HCC
(Adams et al., 2005; Rafiq et al., 2009; Satapathy and Sanyal, 2015). Available data suggests that the prevalence of HCC in NAFLD and NASH patients is estimated to be 0.5% and 2.8%, respectively (Starley et al., 2010). A recent Surveillance,
Epidemiology, and End Results (SEER) database study in United States
13
with a 9% annual increase over 6-year period (Younossi et al., 2015). These estimates are forecast to be greatly increased in parallel to the NAFLD epidemic (Baffy et al., 2012). In general, HCV and alcohol currently account for the majority of HCC underlying causes. However, a US-based study with 4,406 HCC patients recruited between 2002-2008 challenged this assertion, providing evidence that NAFLD/NASH was the most common aetiological factor among those cases (59%), followed by T2DM (36%) and HCV (22%) (Sanyal et al., 2010). The presence of cirrhosis is the key risk factor for HCC and a surveillance study from Japan indicates that 80% of HCC patients are cirrhotic irrespective of aetiology (Hashimoto et al., 2009). The cumulative incidence of HCC in patients with NASH-related cirrhosis has been suggested in one systemic review to range from 2.4% (over 7 years) to 12.8% (over 3 years) (White et al., 2012), whilst another study reported the annually
cumulative incidence of HCC was 2.6% in NASH-associated cirrhosis compared to 4% for those with HCV-related cirrhosis (Ascha et al., 2010).
Yet, a growing number of case reports suggest that cirrhosis is not a necessary determinant for HCC, especially in NAFLD patients. In a US prospective study, the absence of cirrhosis was found to be 54% in all NAFLD-HCC cases while there was only 22% with absence in the HCV-cirrhosis group (Sanyal et al., 2010). Another German study examined the prevalence of HCC with different aetiologies and revealed that 41.7% of NAFLD/NASH-related HCC patients were non-cirrhotic (Ertle
et al., 2011). In a study involving 1,500 U.S veterans over 6-year period,
non-cirrhotic HCC was mainly due to NAFLD and patients with either NAFLD (unadjusted odds ratio 5.4; 95% CI [3.4-8.5]) or metabolic syndrome (unadjusted odds ratio, 5.0; 95% CI [3.1-7.8]) had a greater than 5-fold risk to present with HCC in the absence of cirrhosis, compared with the cohort of HCV-related HCC (Mittal et al., 2016). This specific characteristic (the absence of cirrhosis in progression of NAFLD-HCC) could be explained by the well-known NAFLD-associated risk factors, obesity and metabolic syndrome (Hardy et al., 2016). A large American prospective study with more than 900,000 adults demonstrated that men with a BMI of 35 kg/m2 or above
had 4.5 times higher risk of dying from liver cancer while the risk was 1.68 higher in women when compared to individuals with normal BMI (Calle et al., 2003). One meta-analysis also concluded that the summary relative risks for HCC were 1.17 for overweight and 1.89 for obese subjects (Larsson and Wolk, 2007). Substantial data
14
suggests that T2DM promotes the development and progression of HCC (El-Serag
et al., 2004; Davila et al., 2005; El-Serag et al., 2006; Welzel et al., 2011).
Supporting evidence from a systematic review of 26 studies published during the last decade, 13 case-control studies and another 13 cohort studies, shows that the
presence of diabetes was associated with a relatively consistent 2.5-fold increase in HCC risk in different populations and geographic areas (El-Serag et al., 2006). Since NAFLD is the major hepatic manifestation of obesity, impaired glucose tolerance and insulin resistance, T2DM and other associated metabolic conditions, this once again supports the notion that NAFLD/NASH would be the leading future cause of HCC and liver transplantation (Marrero et al., 2002; Starley et al., 2010).
15
16 1.5 Risk factors
NAFLD is best considered as a paradigm of complex genetic disease trait, since susceptibility appears to involve a combination of inter-patient genetic variation and environmental factors. With respect to environmental risk factors contributing to NAFLD, high calorific diet and sedentary life-style are well-known risk factors (Day, 2006). Older age has also been linked to NAFLD (Chen et al., 2007a; Frith et al., 2009). One Chinese case-control study investigated 4,226 adults aged above 60 years compared with 3,145 randomly selected younger controls and found that the prevalence of NAFLD was slightly higher in the elderly (26.7%) than in non-elderly (22.8%) (Wang et al., 2013). It is noteworthy that whether age has its true effect on NAFLD/NASH or this is owing to a cumulative end results of other risk components (metabolic syndrome and fibrosis for example) and longer duration of disease progression in these patients (Vacca et al., 2015). Available data investigating gender difference in NAFLD remains conflicting. Women accounted for 60%-83% of NAFLD/NASH diagnosis in several early clinical studies (Ludwig et al., 1980; Powell
et al., 1990; Angulo et al., 1999; Caldwell et al., 1999; Matteoni et al., 1999). In further studies on women, NAFLD has recently been reported to associate with late menopausal transition and postmenopausal stages (Ryu et al., 2015b), miscarriage and induced abortion (Liu et al., 2013), but an inverse association was found
between age at menarche and NAFLD in a Korean study involved 76,415 middle-aged women (Ryu et al., 2015a). Although some of these findings suggest a
particular female predisposition, several other reports suggest a male predominance in NAFLD (Bacon et al., 1994; Sanyal and American Gastroenterological, 2002; Browning et al., 2004b; Williams et al., 2011).
It is globally acknowledged that NAFLD is strongly correlated with the metabolic syndrome, especially obesity and T2DM (Bian and Ma, 2012; Ortiz-Lopez et al., 2012) and this section mainly focuses on this aspect. The metabolic syndrome, also known as the X syndrome, the insulin resistance syndrome, and the deadly quartet, was recognized at least eight decades ago (Cameron et al., 2004; Eckel et al., 2005). Although the definitions of metabolic syndrome slightly differ between the criteria established either by World Health Organization (WHO) (Alberti and Zimmet, 1998), European Group for the Study of Insulin Resistance (Balkau and Charles, 1999), and the National Cholesterol Education Program’s Adult Treatment Panel III
17
(NECP: ATPIII) (Expert Panel on Detection and Treatment of High Blood Cholesterol in, 2001), the agreed essential elements are glucose intolerance, central obesity, dyslipidaemia and hypertension. The criterion of ‘glucose intolerance’ also involves impaired glucose tolerance, impaired fasting glycaemia, IR and T2DM (Eckel et al., 2005). These key components of metabolic syndrome have been proposed as potential risk factors in developing diabetes, CVD, stroke, chronic kidney disease (CKD), and NAFLD (Eckel et al., 2005; Anstee et al., 2013b). A proportion greater than 90% of the NAFLD patients have at least one component of the metabolic syndrome (Marchesini et al., 2003). While environmental factors in NAFLD are well-established, the underlying mechanisms of genetic factors remain unclear. Current understanding on the genetic basis of NAFLD is described in detail in the next section 1.7.
1.5.1 NAFLD and obesity
Obesity is defined by BMI ≥ 30 kg/m2 and BMI ≥ 40 kg/m2 is defined as morbid
obesity (Kubik et al., 2013). NAFLD was first recognized as a clinical entity based on the studies discovering the presence of fatty liver, variable degrees of inflammation and fibrosis in morbidly obese individuals (Payne et al., 1963; Kern et al., 1973; Catlin, 1976). Since then, accumulating data confirmed that obesity is a major risk factor in the development of NAFLD (Nasrallah et al., 1981; Braillon et al., 1985; Angulo et al., 1999; Matteoni et al., 1999). As described in section 1.2, the
prevalence of NAFLD increased greatly in obese patients (Bellentani et al., 2004). One Italian study reported that 75.8% of obese patients had NAFLD compared to only 16% of those with normal BMI and without metabolic syndrome (Bellentani et al., 2000). Overall, the prevalence of NAFLD is estimated at between 74-91% in obese subjects (Angulo, 2002; Abrams et al., 2004; Bellentani et al., 2004) while NASH is thought to be present in 25-30% of an obese population and >35% when coexisting with T2DM (Silverman et al., 1989; Musso et al., 2011; Smith and Adams, 2011). Visceral adiposity (central obesity), not overall obesity, is significantly
associated with NASH (Kral et al., 1993; Omagari et al., 2002; Thomas et al., 2005; Farrell and Larter, 2006), especially for ‘non-obese’ NAFLD (Ha et al., 2015). On the other hand, bariatric surgery does ameliorate disease severity in NAFLD (Angulo, 2006; Mummadi et al., 2008). One meta-analysis pooled 15 studies which
18
investigated the effect of bariatric surgery on NAFLD and revealed that 91.6% of patients had improvement or resolution in steatosis (95%CI [82.4%-97.6%]), 81.3% in NASH (95%CI [61.9%-94.9%]), and 65.5% in fibrosis (95%CI [38.2%-88.1%]); the completely disappearance of NASH was found in 69.5% (95%CI [42.2%-90.8%]) (Mummadi et al., 2008). A recent study with 1-year of follow-up also showed that nearly 85% of patients had reversal of NASH and reduced pathologic features of the disease after bariatric surgery (Lassailly et al., 2015).
1.5.2 NAFLD and type 2 diabetes mellitus
NAFLD is closely associated with IR and T2DM, it however remains unclear whether it is NAFLD that induces T2DM or vice versa. NAFLD patients have an average of 2 fold increased risk of incident T2DM as reported in numerous studies (Fan et al., 2007; Shibata et al., 2007; Fraser et al., 2009; Yamada et al., 2010; Sung et al., 2012). These studies however performed a NAFLD diagnosis by ultrasonography or serum levels of liver enzymes which has limitations due to intraobserver variability and the fact that 80-85% of patients with T2DM and NAFLD are negative for
increased serum levels of liver enzymes (Targher et al., 2007a; Williams et al., 2011; Williamson et al., 2011). Only one available data has so far demonstrated the
association between histologically diagnosed NAFLD and the risk of incident T2DM. In a cohort of 129 histologically-proven NAFLD patients who were followed up for a mean period of 13.7 years, Ekstedt et al. showed that the prevalence of previously known T2DM was 8.5% at baseline, but a striking proportion of 78% of these
individuals developed either T2DM (58%) or impaired glucose tolerance at the end of the study (Ekstedt et al., 2006).
When considering NAFLD in patients with established T2DM, the prevalence of NAFLD is thought to be over 70% (Targher et al., 2007a; Leite et al., 2009). Both a personal and family history of IR and diabetes mellitus (DM) increases predisposition to NASH and fibrosis (Loomba et al., 2012). One study reinforced the notion that NAFLD is an independent risk factor for T2DM after adjustment for other elements of metabolic syndrome (Musso et al., 2011). In addition, patients with both T2DM and NAFLD often have poorer glycaemic control compared to those with T2DM only (Jimba et al., 2005; Williamson et al., 2011). The presence of T2DM itself is a strong
19
risk factor for liver disease as its long-term prognostic significance includes NASH, cirrhosis and HCC (de Marco et al., 1999; Bugianesi et al., 2002; El-Serag et al., 2004; Bugianesi, 2007; Anstee et al., 2013b).
1.5.3 NAFLD, cardiovascular disease and chronic kidney disease
The recognition that NAFLD may stimulate the progression and development of CVD has already been a heated topic as common features of NAFLD (i.e. hypertension, atherogenic dyslipidaemia, dysglycaemia, IR and obesity) are risk factors for CVD (Marchesini et al., 2003). Numerous reports showed that NAFLD has been linked to markers of subclinical atherosclerosis (i.e. impaired flow-mediated vasodilation) that are dependent on endothelium, increased arterial stiffness, and increased carotid artery intima-media thickness (IMT) (Anstee et al., 2013b; Oni et al., 2013). One meta-analysis with seven cross-sectional studies (involving a total of 3,497 subjects) confirmed that NAFLD patients diagnosed with ultrasonography had a significantly increased prevalence of carotid artery IMT and carotid plaques (Sookoian and Pirola, 2011). In a recent prospective study of 465 consecutive patients with ischaemic heart disease diagnosed by coronary angiography, the prevalence of fatty liver was 64.7% and fatty liver was associated with more severe coronary artery disease (Wong et al., 2011). The intimate correlation between CVD and NAFLD could be further demonstrated by several retrospective studies (NAFLD diagnostic approach as imaging or biopsy) examining the natural history of NAFLD patients within a reasonably long duration; CVD is a very common cause of death among these patients (Adams et al., 2005; Ekstedt et al., 2006; Targher et al., 2007b; Rafiq et al., 2009; Soderberg et al., 2010; Treeprasertsuk et al., 2012; Zhou et al., 2012). Two of the studies with biopsy-proven NAFLD also reported that patients with NASH, not those with simple steatosis, possess an increased risk of death from CVD compared with the reference population (Ekstedt et al., 2006; Soderberg et al., 2010).
There is growing awareness regarding the interaction between NAFLD and CKD as it is a microvascular diabetic complication in people with T2DM which is also a common feature in NAFLD (Targher et al., 2011). The presence of CKD is usually defined as estimated glomerular filtration rate of <60 mL/min/1.73 m2 and/or
20
patients, those who coexisted with NAFLD (ultrasonography) had almost 2-fold increased prevalence of CKD (OR 1.87, 95CI% [1.3-4.1]) and proliferative/laser-treated retinopathy (OR 1.75, 95CI% [1.1-3.7]) than in those without NAFLD (after adjustment for age, gender, BMI, waist circumference, blood pressure level,
hypertension, duration of T2DM, haemoglobin A1c (HbA1c), lipids, smoking status and
medications use) (Targher et al., 2008). An increased incidence of CKD in NAFLD patients also has been reported in several other cross-sectional studies (Hwang et al., 2010; Arase et al., 2011; Yasui et al., 2011).
Although there is accumulating data concerning the close correlation between NAFLD and CVD/CKD, study bias should be noted; factors such as ethnicity, population studied (hospital-based or community-based), an adequate adjustment with potential confounders (i.e. IR, obesity, T2DM, hypertension and other traditional and non-traditional risk factors for CVD) and the diagnostic method used is needed. Whether NAFLD is simply a risk marker which coexists in patients of these two disease entities or is an independent risk factors remains to be fully elucidated. However, data to date is sufficient to consider that NAFLD patients are at high-risk for CVD/CKD events. More comprehensive information regarding current knowledge on the relationship between NAFLD and CVD/CKD can be found in two other review articles (Anstee et al., 2013b; Vanni et al., 2015).
1.6 Pathogenesis
The preeminent hypothesis for NAFLD pathogenesis was proposed by Day and James in 1998, suggesting that NAFLD might be driven in a “two-hit” fashion. The initial stage of NAFLD, steatosis, begins with an imbalance between lipid acquisition and removal in the liver, followed by steatohepatitis resulted from a complex system of inflammatory cascade which promotes lipotoxicity, oxidative stress and further induction of subsequent stages of NAFLD (Day and James, 1998). However, accumulating evidence during the past decade suggests that NAFLD may be contributed from “multiple hits”, a combination of several biochemical and
immunological effects, rather than a simple “two-hit” manner. It is generally accepted that initiation of NAFLD is dependent on development of obesity and IR/T2DM, therefore this section mainly focuses on involvement of lipotoxicity, damage caused
21
by overwhelming oxidative stress, impaired metabolic homeostasis, cellular
dysfunction (Hardy et al., 2016) and how these effects are governed by insulin and nutrient-sensing transcription factors.
1.6.1 Lipid metabolism in NAFLD
The liver plays a crucial role in the metabolism of carbohydrate, lipid and protein. Hepatic dysfunction usually is associated with systemic metabolic imbalances, and it is universally agreed that an imbalance in the acquisition, delivery and removal of long chain fatty acids (LCFAs) and triglycerides (TGs) is fundamental to NAFLD.
1.6.1.1 Free fatty acids supply
Free fatty acids (FFAs) are the key elements forming TGs, which can be further stored in adipocytes or be hydrolysed into three FFAs when the body requires higher energy demand. Liver FFAs are sourced from dietary TGs intake, enhanced de novo
lipogenesis (DNL), and excess fatty acids influx via adipose tissue lipolysis (Vacca et al., 2015). In NAFLD cases, it has been reported that 59% of TG in the liver is
derived from circulating FFAs, also known as nonesterifed fatty acids (NEFAs), 26% from DNL, and the remaining 15% from the diet (Donnelly et al., 2005).
Acetyl-coenzyme A carboxylase (ACC) and fatty acid synthase (FAS) are the predominant enzymes that catalyse FFA synthesis in the liver, while acetyl-coenzyme A (acetyl-CoA) and malonyl-coenzyme A (malonyl-(acetyl-CoA) are the essential metabolic
intermediates in DNL (Mendez-Sanchez et al., 2007) since increased DNL is found in NAFLD patients (Adams et al., 2005). DNL is strongly regulated by nutritional level of insulin and glucose, via two transcription factors - carbohydrate response element-binding protein (ChREBP) and sterol regulatory element-element-binding protein-1c (SREBP-1c), respectively. SREBP-1c, a membrane bound transcription factor to the
endoplasmic reticulum (ER) (Horton et al., 2002), is regulated by insulin, saturated fatty acids (SFAs) and a nuclear receptor, liver X receptor (LXR), to promote fatty acid synthesis under hyperglycaemia. Conversely, glucagon, polyunsaturated fatty acids (PUFAs) inhibit its expression (Vacca et al., 2015). Mice with a SREBP-1c deletion showed remarkable reduction of insulin-mediated lipogenic gene expression (Shimano et al., 1999). Similar results were reported in LXRα-null mice with
22
decreased SREBP-1c and reduced lipogenesis (Repa et al., 2000). In
hyperglycaemia, excess carbohydrates are converted to FFAs/TGs in the liver via glycolytic enzymes such as glucokinase, liver-type pyruvate kinase (L-PK), and the previously mentioned enzymes of DNL - ACC and FAS (Towle et al., 1997).
ChREBP is expressed abundantly in lipogenic organs: liver, brown and white
adipose tissue, small intestine, kidney, and muscle (Yamashita et al., 2001). Genes that are regulated by ChREBP are involved in glycolysis (L-PK), the NADPH supply system (e.g. glucose-6-phosphate dehydrogenase, transketolase, and malic
enzyme), gluconeogenesis, and lipogenesis (ACC, FAS) (Iizuka et al., 2004; Ma et al., 2006). Inhibition of ChREBP in vivo resulted in suppression of lipogenic
genes/enzymes expression in the liver, and amelioration of hepatic steatosis, insulin signalling and glucose intolerance (Iizuka et al., 2004; Dentin et al., 2006). Taken together, SREBP-1c and ChREBP are activated by insulin and glucose during hyperglycaemia, inducing glycolysis (to release more acetyl-Co A as substrate for FFA synthesis) and lipogenesis, thus further worsening steatosis.
1.6.1.2 Free fatty acids removal
Clearance of hepatic TG is accomplished by the only disposal pathway – through the formation of very low-density lipoproteins (VLDLs) which can be further secreted from the liver. Apolipoprotein B-100 (apoB-100) is required for VLDL assembly, and microsomal triglyceride transfer protein (MTTP) is required for incorporating TG. In general, TG, cholesterol ester (CE) and phospholipid are first transferred to rough ER to be incorporated with newly formed apo B, known as the formation of the primordial particle. Further in the lumen of the rough ER, TG-enriched globules produced by the smooth ER are incorporated into the primordial particle to form the mature VLDL. Once VLDL is assembled, it is then transported to the Golgi and released from the cell as secretory vesicles. This secretory pathway is entirely assisted by apo B-100 (Mason, 1998). The secretion of VLDL is inhibited by SREBP-1c through decreasing expression of MTTP (Sato et al., 1999).
23
1.6.1.3 Free fatty acids oxidation
FFAs can be utilised for energy production, the most efficient mechanism during energy deficiency. FFAs oxidation may be performed in three unique locations: 1) β-oxidation in the mitochondria, 2) in the peroxisomes, and 3) ω-β-oxidation in the ER of hepatocytes (Koek et al., 2011). Under normal physiological conditions, β-oxidation
of FFA in the mitochondria is the main source of short, medium, and long chain fatty acids (LCFAs) (Anstee and Goldin, 2006). Oxidation of FFA yields acetyl-CoA which is an important substrate for entering the citric acid cycle to generate electrons. These electrons further pass to oxygen via mitochondrial ‘respiratory chain’ (electron transport chain, ETC) and providing the energy for adenosine triphosphate (ATP) synthesis by oxidative phosphorylation (OXPHOS) (Lehninger et al., 2000). Short- and medium-chain FFAs (below 12 carbons length) can simply diffuse across the mitochondrial membrane for β-oxidation. However, LCFAs (chain length with 14 or more carbons) are activated by acyl-CoA-synthetase in the cytosol as acyl-CoA, which then be catalyzed and be transported into the mitochondrial matrix in 3 steps (Serviddio et al., 2011):
1. Acyl-CoA is catalyzed by carnitine palmitoyl transferase I (CPT-I) as fatty acyl-carnitine at the outer mitochondrial membrane, then passing through the intermembrane space.
2. The inner membrane delivery is accomplished by acyl-carnitine translocase. 3. At the inner face of the inner mitochondrial membrane, the reconversion of
acyl-CoA is catalyzed and released by carnitine palmitoyl transferase II (CPT-II) into the matrix along with free carnitine.
Notably, CPT-I can be inhibited by malonyl-CoA, the key intermediate of DNL, and insulin. In general, hepatic lipogenesis is activated with carbohydrate feeding, resulting in elevated levels of insulin and malonyl-CoA; the expression of CPT-I is therefore suppressed and LCFAs are not oxidised but instead esterified, principally into TG (McGarry and Brown, 1997).
1.6.2 Oxidative stress
Oxidative stress, the essential underlying mechanisms of NAFLD, occurs when reactive oxygen species (ROS) exceed the production of protective antioxidants. Oxidation of FFAs is the primary source of ROS. ROS are constituted by