University of Nebraska - Lincoln
DigitalCommons@University of Nebraska - Lincoln
Library Philosophy and Practice (e-journal) Libraries at University of Nebraska-Lincoln
Spring 3-28-2017
A Scientometric analysis of the ‘Journal of King
Saud University-Computer and Information
Sciences’
Akhtar Hussain [email protected]
Follow this and additional works at:http://digitalcommons.unl.edu/libphilprac Part of theLibrary and Information Science Commons
Hussain, Akhtar, "A Scientometric analysis of the ‘Journal of King Saud University-Computer and Information Sciences’" (2017). Library Philosophy and Practice (e-journal). 1528.
Scholarly Research in ‘Journal of King Saud University-Computer and
Information Sciences’ (2004-2014): a Scientometric assessment
Abstract
Scientometric is branch of Science. Scientometric explain about input and output resources in term of organisational structure. Scientometric is the Science of measuring and analyzing Science. Modern Scientometric is mostly based on the work of Derek J.de Solla Price and Eugene Garfield. A scientometric assessment of the Journal of King Saud University-Computer and Information Sciences (JKSU-CIS) 2004-2014 has been conducted. The study explains on the various aspects of the Journal, such as its distribution of article by year, authorship patterns, authors’ degree of collaboration, authorship productivity pattern, distribution of citations by bibliographical forms, subject distributions, citation patterns, rank of cited authors, and geographical distributions of authors. This paper also highlighted institution by distributions and application of Bradford’s law of scattering. The results of this study provide a better understanding of patterns, trends and other important factors as a basis for directing research activities, sharing knowledge and collaborating in the area of computers science research.
KEYWORDS: JKSU-CIS, King Saud University, Computer and Information Sciences, Scientrometric,Bibliometrics,Scientific productivity, Content Analysis,
1. Introduction
Scientometrics is the study of measuring and analysing science, technology and innovation. Major research issues include the measurement of impact, reference sets of articles to investigate the impact of journals and institutes, understanding of scientific citations, mapping scientific fields and the production of indicators for use in policy and management contexts (Leydesdorff, and Milojevic, 2013). Scientometric analysis is employed by many researchers to study the literature in a given field. Such a study is often carried out by counting the references cited by a large number of researchers in their papers.
Moreover, assumed the expressively increasing number of publications, it becomes more and more important to investigate the current state and evolution of computer science research. Quantitative studies measuring and analyzing science
activities form a type of research commonly known as scientometrics (Lewis, et al., 2007). By providing a view on a research field from a meta-perspective (van Raan, 1996) scientometric studies facilitate the development and improvement of an academic discipline serving as a vital basis for defining and debating future research agendas (Serenko and Bontis, 2004). Supposing that scientific activities are reflected through scientific publications, scientometric studies apply empirical measures to analyze scientific consequence of a specific field in order to better understand the dynamics and structure of its development. Thereby, it is possible to explore the body of publications extensively, for instant, to analysis citation patterns, number and types of citations, number and structure of authors and so on. Further, a scientometric study gives some indication of research activities in general, such as with respect to knowledge sharing, research quality, socio-organizational structures, influential countries/affiliations/authors, development of key topics, structural change, and economic impact of research. Likewise, scientometrics, as an evaluation tool of science, increasingly impacts the resource distribution of research institutions (Vob and Zhao, 2005).
2. The Journal of King Saud University-Computer and Information Sciences
The Journal of King Saud University-Computer and Information Sciences is Production and Hosting by Elsevier B.V. on behalf of King Saud University peer review under the responsibility of King Saud University at Riyadh in Kingdom of Saudi Arabia. It is refereed, international journal that covers all aspects of both foundations of computer and its practical applications. The journal publishes original papers in the areas of, but not limited to, computer networks, security, database, software systems and developments, rapid prototyping, software reuse, computer graphics, artificial intelligence, pattern recognition, signal processing, robotics, distributed systems and the Internet and web technologies. Special emphasis is given to recent trends related to the cutting-edge research within the domain. The journal publishes also special issues within its scope resulting from specific and dedicated editorial efforts or covering a particular theme. All articles are subjected to extensive review by international reviewers. It also reports any major development of the Journal of King Saud University Computer and Information Sciences around all over the world. (www.journals.elsevier.com/journal-of-king-saud-university-computer-and-information-sciences)
3. Related literature
A whole lot of studies had already been done worldwide during last few years on bibliometrics and citation analysis. The authors reviewed some important studies during the last five years in this section.
Al-Khalifa (2014) study found that the number of papers produced in computer science field has only increased after year 2007; this is because Saudi universities have applied a catch-up strategy to increase its research output. Also, our study reveals that the
publication performance of Saudi scientists in computer science was domestic and suffers from low international visibility. Only two universities took the lead in the production of computer science research. Moreover, computer science research trends in Saudi Arabia focused on engineering, followed by mathematics and telecommunications.
Citation analysis of the project reports of social science bachelor degree graduates between 2009 and 2013 submitted to the covenant university library was executed (Iroaganachi et al., 2014). It was revealed that the authors cited more from textbooks than journal and internet/electronic resources. Citation from books was 69.4% followed by journals 16% and Internet/ E-Resources 8% among others. The average of 39 citations per report generally was discovered. 34.6% of the total citations were very recent, 21% citations were recent, while 13.4% citations were not very recent and 31% of the total citations were not recent. The researcher’s author preference is foreign authors as against African authors.
Hosein Mardani and Abdiazar (2014) made an assessment of the global status of research in nuclear science and technology (NST) publications. This bibliometric study is based on bibliographic data that were retrieved from the web of science during 2001-2010. In all, 85,198 records published by the 35 journals under the category of NST in the database of journal citation reports were assessed in terms of many aspects. Unlike research-prolific countries, the annual growth rates of publications for most developing countries have experienced an evident leap. The highest scientific impact and productivity among the publications belonged to the International Journal of Radiation Biology (10.46%). Japanese authors had the most contributions. The USA is in the center of the international collaborative network illustration and is also the main partner of most of the research-prolific countries. Nuclear physics has the greatest field normalised measured impact ratios (CPP/FCSm = 4.2) among the publications, which signifies its inherent impact on NST research. The internationally collaborative publications are more frequently cited and therefore have a higher scientific impact.
Young (2014) focused on the citation analysis of all research articles from one issue of 16 engineering journals from different engineering disciplines and captured data on the formats cited and the age (median and mean) of those citations. The author reviewed 6,229 references from 199 articles. Journal articles were the most often cited format, accounting for 63% of all citations- around 19% greater than the comparison study. Journal use from 1996 to 2012 increased by roughly 19% (10 percentage points). Heavy use of journal articles is not necessarily widespread across all engineering fields. Journals accounted for less than half of all citations in four fields: architectural engineering (50%), electrical engineering (43%), nuclear engineering (35%), and petroleum engineering (28%). Across the disciplines, conference paper use ranged from 2% to 53% and monograph use ranged from 4% to 24%. Monographs have the longest citation age (half-life) and conference papers have the shortest.. Additionally, the average citation is 13 years old, slightly outside the 8-12 year range found in local citation
studies. Bala and Singh (2014) analyzed 316 scholarly communications published in the Indian Journal of Biochemistry & Bio-Physics, a peer reviewed, open access bio-monthly Journal published by NISCAIR. Study revealed that single author contributed 18 (5.7%) while the rest of 162 (51.3%) articles were contributed by Multi authors.
Bibliometric analysis of Journal of Documentation was carried out by Roy and Basak (2013). The study found that majority of papers was multi- authored. The degree of collaboration was found to be 0.51. The geographical distribution revealed that the contribution by United Kingdom was the highest. The average citations per paper were 43. Ardanuy (2013) provided an overview of studies that have used citation analysis in the field of humanities in the period 1951 to 2010. The work is based on an exhaustive search in databases particularly those in library and information science and on citation chaining from papers on citation analysis. The results confirm that use of this technique in the humanities is limited, and although there was some growth in the 1970s and 1980s, it has stagnated in the past 2 decades. Most of the work has been done by research staff, but almost one third involves library staff, and 15% has been done by students. The study also showed that less than one fourth of the works used a citation database such as the Arts & Humanities Citation Index and that 21% of the works were in publications other than library and information science journals. The United States has the greatest output, and English is by far the most frequently used language, and 13.9% of the studies are in other languages.
Citation analysis of PhD theses submitted in the discipline of sociology of the University of Delhi during 1995-2010 was conducted by Singh and Babi (2013). The study is based on the 5766 citations taken out from 25 PhD theses of sociology. The study found that highest number of citations was single authored (83.94 %), and 67.23 % citations were from books and only 22.20 % citations were from journals. The country-wise scattering of citations reveals that 2536 (45.52 %) citations were from India and it was followed by USA and UK.
Bakri and Willett (2011) in their study found that both publication and citation rates are low, although this is at least in part due to some Malaysian universities having only a teaching function. More of the departments’ publications were identified in Scopus than in Web of Science, but both databases were needed for comprehensive coverage. In this study statistically significant relationships were observed between the departments’ publication and citation counts and the rankings of the departments’ parent universities in two evaluations of the research performance of Malaysian universities.
The scholarly communications in Library Review (LR) from 2007 to 2011 and its publication trends have been examined by Swain et al. (2013). Five volumes of LR from the year 2007 to 2011 were analyzed. Pattern of research output in 275 publications are analyzed. Study revealed that single authored articles occupy the prominent position indicating the supremacy of solo research in LR. The degree of collaboration in the publications of this journal is found to be 0.36. It is evident that LR has accommodated
over 22 citations per article during the publication phase from 2007 to 2011. In regard to country productivity, the UK leads the table, followed by the USA and Nigeria. However, Poland occupies the bottom position in the ranking. Hence, it is evident that the major chunks of contributions reflected in the publications of LR during the stated period are emanated from the UK and the USA.
Maharana et al. (2011) determined India's position in publishing top research papers in chemistry as reflected in Science Direct. Citation analysis methods were applied to study citations of 450 research papers in chemistry taken from the listing of top 25 papers in Science Direct database. The citations covered 18 issues of the Science Direct generated alert service for the period 2004‐2008. The studies revealed that, out of 450 research papers, 36 (8 per cent) were contributed by Indian researchers. In the ranking of contributing countries, India reserves third position after the USA and China. More than 86 per cent of Indian chemistry research papers were cited by others. As regards to number of citations, 25 per cent of Indian papers are cited between 10 and 25 times each. The journal Tetrahedron was found as the highest publishing journal with 71 (16 per cent) publications.
Husain and Swain (2011) evaluated the top papers of Computer Science as reflected in Science Direct. The citations data have been collected from the quarterly list of hottest 25 research articles in the subject field of Computer Science from Science Direct database. In the present study, 20 issues of the alert service beginning from January/March 2005 to October/December 2010 containing a total number of 495 articles in Computer Science have been taken up for analysis. The study revealed that out of 495 top papers; three-authored articles are little ahead than two authored articles followed by four-authored articles and the country productivity of USA is at the top followed by UK, Taiwan, Chaina, and Canada. Moreover, it finds that European Journal of Operational Research occupies the top position followed by Computers in Human Behavior, and Pattern Recognition.
Publications on Nigeria indexed in Arts and Humanities Citation Index (AHCI) and Social Science Citation Index (SSCI) of Thomson Scientific databases respectively to understand the international perspective of aspects of research publication dynamics in both fields was interpreted by Nwagwu and Egbon (2011). Data covering the period 2002‐2007 were collected from the SSCI and AHCI of the Web of Science, an online service of Thomson Scientific in June 2008. SSCI and AHCI indexed a total of 716 publications on Nigeria, 634 and 82 respectively. Paper production in each of these fields rose during 2002 to 2004 and 2005 respectively, and then started dropping. The publications received a total of 1,371 citations; the 82 AHCI documents received only six citations, while the 634 SSCI publications received 1,366 citations, equivalent to means of 0.06 and 2.15 citations per AHCI and SSCI document respectively. Only 6.1 per cent of the AHCI documents were cited compared with 46.7 per cent of SSCI publications; but citations of social science papers was consistently on the increase, while citation of
arts and humanities publications, flattened in 200 humanities, was consistently on the increase. In both fields, article type of papers written in English dominated.
Tsay (2011) explored the bibliometric characteristics of the Journal of Information Science (JIS) and the subject relationship with other disciplines by citation analysis. The citation data were drawn from references of each article of JIS during 1998 and 2008. The results of this study revealed that journal articles are the most cited document, followed by books and book chapters, electronic resources, and conference proceedings, respectively. The three main classes of cited journals in JIS papers are “library science,” “social sciences” and “science.”
4. Objectives and methodology
The main objectives of the study are:
• To study the year wise distribution of articles and citations;
• To find out the authorship pattern, degree of authors' collaboration and Authorship productivity pattern;
• To determine the institution-wise, subject wise distribution of contributions, average length of articles and average number of citations per article in the journal;
• To identify the authors' most preferred bibliographical forms of citations; • To study the geographical distribution of contributors;
• To identify the most prolific contributors in leading journals of computer science by their rank of citations;
• To determine author affiliation from universities/institutions and ranked list of cited journals, and;
• To evaluate the citation trend of journals implemented Bradford’s Law of Scattering.
The methodology applicable in the current study is bibliometric scrutiny, which is used to analyses in detail the bibliographic attributes of the articles published in the Journal of King Saud University-Computer and Information Sciences from 2004-2014. 11 volumes (Vol. 16 to 26) containing four regular issues (2014) and one supplementary issue of the journal have been taken up for the study. The authors have extracted the information from the Elsevier database published by King Saud University and then used MS-Excel to organize, tabulate and analyze the data for the study.
5. Data analysis and interpretation
The Journal of King Saud University-Computer and Information Sciences have extracted all the details such as author(s), title, year of publication, institutional affiliation, etc. of all articles published from 2004 to 2014 were recorded for the following analysis.
5.1. Year-wise distribution of articles
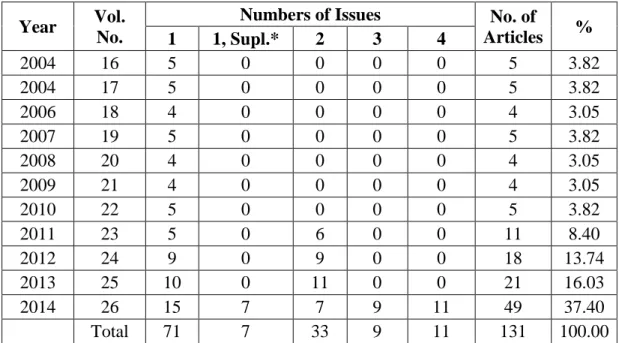
During the period 2004-2014, 131 articles were published. Table 1 show that the numbers differs from year to year and there is also steady increase in the number of articles from the year 2004 to 2014. Out of total 131 articles, the maximum numbers of articles are in the year 2014 contributing 49 articles, which are 37.40% to the total publications. The minimum numbers of articles are in the year 2006, 2008 and 2009 with 4 articles each published, which are 3.05% to the total publications.
Table 1: Year-wise Distribution of Articles Year Vol.
No.
Numbers of Issues No. of
Articles % 1 1, Supl.* 2 3 4 2004 16 5 0 0 0 0 5 3.82 2004 17 5 0 0 0 0 5 3.82 2006 18 4 0 0 0 0 4 3.05 2007 19 5 0 0 0 0 5 3.82 2008 20 4 0 0 0 0 4 3.05 2009 21 4 0 0 0 0 4 3.05 2010 22 5 0 0 0 0 5 3.82 2011 23 5 0 6 0 0 11 8.40 2012 24 9 0 9 0 0 18 13.74 2013 25 10 0 11 0 0 21 16.03 2014 26 15 7 7 9 11 49 37.40 Total 71 7 33 9 11 131 100.00 *Supl.= Supplementary 5.2. Authorship Pattern
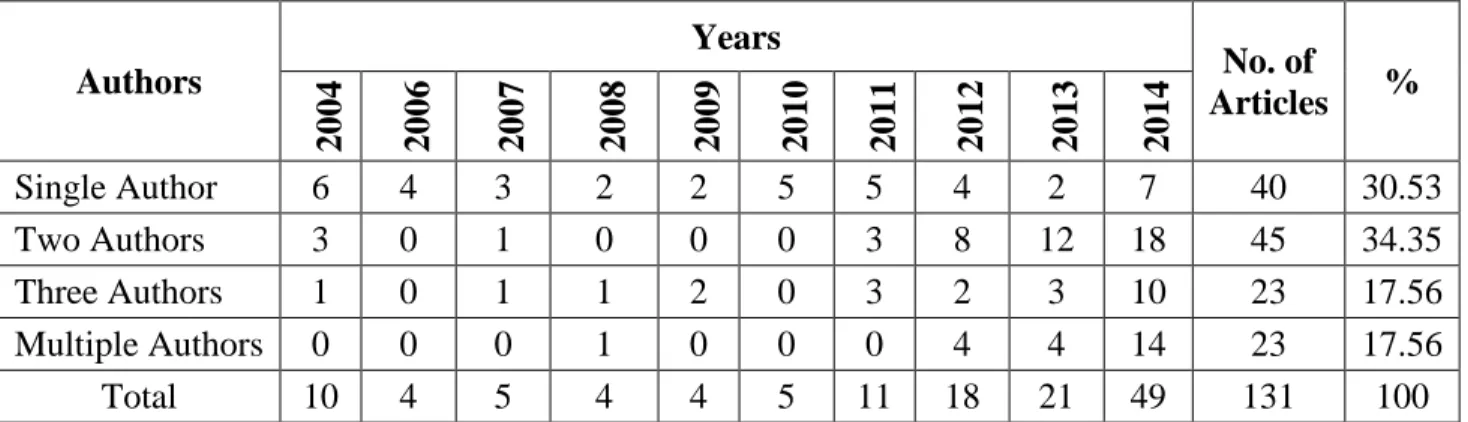
Table 2 reflects the authorship contribution pattern of Journal of King Saud University-Computer and Information Sciences (JKSU-CIS) and it is found that the highest i.e., 45 numbers of articles (34.35%) are found to be two authored contributions followed by 40 articles with single-author i.e., 30.53 % and three and more than three-authored and articles are 23 i.e., 17.56%. Therefore, it is deduced that the publication output of JKSU-CIS is dominated by two authors throughout the publication phase of 2004 to 2014. Year wise breakup of the authorship pattern is depicted in Table 2 for a view.
Table 2: Authorship Pattern Authors Years No. of Articles % 2004 2006 2007 2008 2009 2010 2011 2012 2013 2014 Single Author 6 4 3 2 2 5 5 4 2 7 40 30.53 Two Authors 3 0 1 0 0 0 3 8 12 18 45 34.35 Three Authors 1 0 1 1 2 0 3 2 3 10 23 17.56 Multiple Authors 0 0 0 1 0 0 0 4 4 14 23 17.56 Total 10 4 5 4 4 5 11 18 21 49 131 100
5.3. Degree of authors' collaboration
The extent of collaboration in research can apparently be measured with the help of multi authorship of papers. K. S. Subramanyam (1983) has given a formula for determining the degree of collaboration in a discipline.
The formula is NS NM NM C
NM= number of multi-authored papers NS = number of single- authored papers
Where, C= Degree of collaboration in a discipline. In the present study, the value of C is
40 91 91 C C 0.695
As a result, the degree of collaboration in the Journal of King Saud University of Computer Sciences is 0.695 from 2004 to 2014, which clearly indicates the dominance of multi authorship over single authorship in its contributions (Table 3).
Table 3: Degree of authors’ collaboration Years Single Authors Multi Authors C 2004 6 4 0.4 2006 4 0 0 2007 3 2 0.4 2008 2 2 0.5 2009 2 2 0.5 2010 5 0 0 2011 5 6 0.545 2012 4 14 0.778 2013 2 19 0.905 2014 7 42 0.857 Total 40 91 0.695
Fig.1: Degree of authors’ collaboration
5.4. Authorship Productivity Pattern
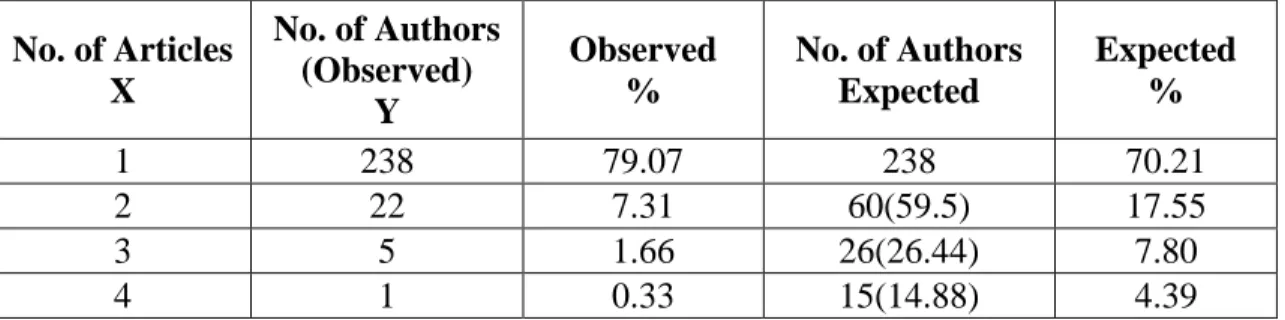
The table 4 shows that a total of 304 authors contributed 131 articles published in JKSU-CIS during 2004 to 2014. The article productivity of authors is analyzed, which indicates that 238(79.07%) authors contributed one article, while 22(7.31%) authors contributed two articles. Only 5(1.66%) authors are produced three articles and only one author produced four articles between 2004 and 2014. To what extent author productivity confirms Lotka's Law (cited in Rolands, 2005 Singh et al., 2006; Zainab et al, 200915) is being tested in this study. Lotka's Law describes the frequency of publication by authors in a given field by using the formula yx=c/xn, where y is the number of authors credited with x (1, 2, 3…) papers, c is the number of authors contributing one paper, and n is a rate (usually n = 2). Application of Lotka's Law has yielded the following result depicted in Table 5.
It is marked from Table 4 that the observed one article percentage is higher, and with two or three articles are lower than the expected percentages which indicates that one author contributed just three articles.
The results suggested that in this case the Lotka's Law is not applicable. It was observed that the number of expected authors is more than observed authors. The difference between observed and expected authors is very wide.
0 20 40 60 80 100 120 140 2004 2006 2007 2008 2009 2010 2011 2012 2013 2014 Total
Single Authors Multi Authors C
Table 4: Authorship productivity pattern No. of Articles X No. of Authors (Observed) Y Observed % No. of Authors Expected Expected % 1 238 79.07 238 70.21 2 22 7.31 60(59.5) 17.55 3 5 1.66 26(26.44) 7.80 4 1 0.33 15(14.88) 4.39
5.5. Institution-wise distribution of contributions
Table 5 examined the Institution-wise distribution of contributions. A majority of the articles 220 (73.33%) were contributed by faculty members. This is followed by academic and research institutes with 56 (18.67%), research scholars 15 (5%) and information/documentation centers 6(2%) articles. Only a small percentage of authors i.e. 3(1%) Government Department was contributed.
Table 5:Institution-wise distribution of contributions
Contributed by Years No. of Articles % 2004 2006 2007 2008 2009 2010 2011 2012 2013 2014 Academic/Research Institutes 6 0 0 1 1 2 4 8 9 25 56 18.67 Faculty Members 9 3 8 10 7 3 16 29 39 96 220 73.33 Research Scholars 0 1 0 0 0 0 0 4 3 7 15 5.00 Government Departments 0 0 0 0 0 0 0 1 0 2 3 1.00 Information/Documentations Centers 0 0 0 0 0 0 0 0 2 4 6 2.00 Total 15 4 8 11 8 5 20 42 53 134 300 100.00
5.6. Subject wise distribution of cited journals
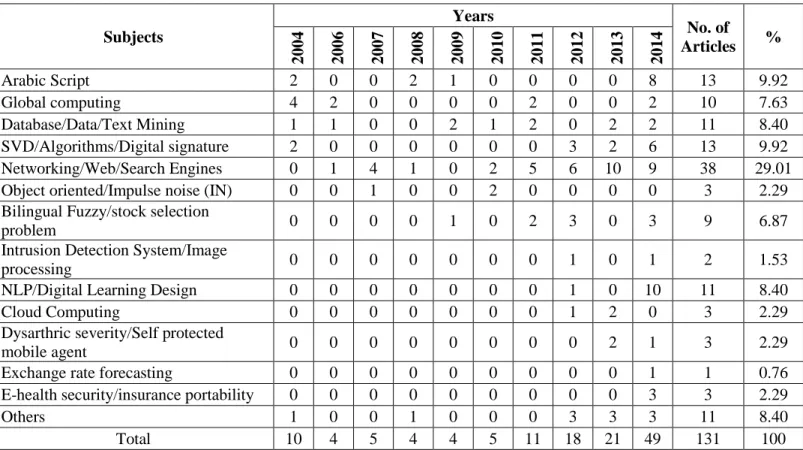
The particulars of subject-wise analysis of articles are shown in the Table 6. This table shows that a majority of a contributions appeared under Networking/ Web/Search Engines 38 (29.01%). The next position is taken by Arabic Script as well as Singular Value Decomposition Algorithms(SVD)/Algorithms/Digital signature 13(9.92%). This is followed by Database/Data/Text Mining, Natural Language Processing(NLP)/Digital Learning Design and others subjects, that is, VBR video traffic, Artificial immune system, digital rights management, e-business, Transliteration normalization for
Information etc. i.e.11(8.40%).Furthermore followed by Global computing 10(7.63%) and Bilingual Fuzzy/stock selection problem 9(6.87%).There are small numbers of contributions shows in the subject like Object oriented/Impulse noise (IN),Cloud Computing, Dysarthria severity/Self protected mobile agent, E-health security/insurance portability, Intrusion Detection System/Image processing, and Exchange rate forecasting.
Table 6: Subject-wise distribution
Subjects Years No. of Articles % 2004 2006 2007 2008 2009 2010 2011 2012 2013 2014 Arabic Script 2 0 0 2 1 0 0 0 0 8 13 9.92 Global computing 4 2 0 0 0 0 2 0 0 2 10 7.63 Database/Data/Text Mining 1 1 0 0 2 1 2 0 2 2 11 8.40 SVD/Algorithms/Digital signature 2 0 0 0 0 0 0 3 2 6 13 9.92 Networking/Web/Search Engines 0 1 4 1 0 2 5 6 10 9 38 29.01 Object oriented/Impulse noise (IN) 0 0 1 0 0 2 0 0 0 0 3 2.29 Bilingual Fuzzy/stock selection
problem 0 0 0 0 1 0 2 3 0 3 9 6.87
Intrusion Detection System/Image
processing 0 0 0 0 0 0 0 1 0 1 2 1.53
NLP/Digital Learning Design 0 0 0 0 0 0 0 1 0 10 11 8.40
Cloud Computing 0 0 0 0 0 0 0 1 2 0 3 2.29
Dysarthric severity/Self protected
mobile agent 0 0 0 0 0 0 0 0 2 1 3 2.29
Exchange rate forecasting 0 0 0 0 0 0 0 0 0 1 1 0.76
E-health security/insurance portability 0 0 0 0 0 0 0 0 0 3 3 2.29
Others 1 0 0 1 0 0 0 3 3 3 11 8.40
Total 10 4 5 4 4 5 11 18 21 49 131 100
SVD=Singular Value Decomposition Algorithms
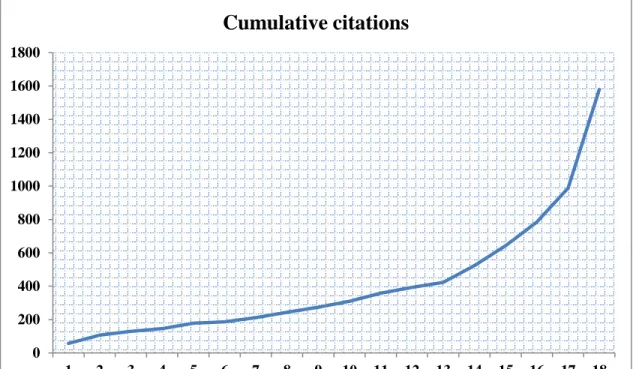
5.7. Application of Bradford’s Law of Scattering
The extend of articles in journals cited in Journal of King Saud University-Computer and Information Sciences followed the pattern predicted by Bradford's Law of Scattering indicating three productive zones (Bradford,1985) where the number of journals published increased from one zone to the next according to the expression 1: n: n2: n3…'
Taking the law into the context of the present study, the total 1579 journal citations were divided into three zones produces approximately one-third of the total relevance papers. It is understood from the citation trend of journals that the first zone contained 55 journals which is the nuclear zone and journals falling in this zone are called core journals. The second quantum of 465 citations forming the second zone are contained in approximately in next 179 journals, which is the first peripheral zone around
the nucleus and journals falling in this zone are known as allied journals. The third or last quantum of 591 citations forming the third zone are contained in next 591 journals, which is second peripheral zone around the first peripheral zone and journals falling in this zone are known as alien journals(Table 7).
The ratio of number of journals in these three zones is 55: 179: 591. This distribution moderately confirms to Bradford's Law. Bradford distribution of journals is depicted in Fig-1.The summaries of division of zones are as:
❖ Zone 1: Top 55 journals that produced 523 (3.48 %) citations ❖ Zone 2: Next 179 journals that produced 465 (11.34%) citations ❖ Zone 3: Next 591 journals that produced 591 (37.43%) citations
Table 7: Citation trend of journals Ranks No. of citations No. of Journals Cumulative Journals Cumulative Journals % Total no of citation of equal rank Cumulative citations Cumulative citations % 1 57 1 1 0.12 57 57 3.61 2 50 1 2 0.24 50 107 6.78 3 22 1 3 0.36 22 129 8.17 4 17 1 4 0.48 17 146 9.25 5 28 2 6 0.73 28 178 11.27 6 13 1 7 0.85 13 187 11.84 7 24 2 9 1.09 24 211 13.36 8 33 3 12 1.45 33 244 15.45 9 30 3 15 1.82 30 274 17.35 10 36 4 19 2.30 36 310 19.63 11 48 6 25 3.03 48 358 22.67 12 35 5 30 3.64 35 393 24.89 13 30 5 35 4.24 30 423 26.79 14 100 20 55 6.67 100 523 33.12 15 120 30 85 10.30 120 643 40.72 16 141 47 132 16.00 141 784 49.65 17 204 102 234 28.36 204 988 62.57 18 591 591 825 100.00 591 1579 100.00
Fig.1:Bradford distribution of Journals
5.8. Length of articles
The table 8 depicts that the detail about page length of articles. The majority of contributions have pages length of articles of 10-14 pages for example 51(38.93%), whereas 46(35.11%) contribution have pages length of 5-9 pages. There were 17(12.987%) contribution have length of article of 15-19 followed by 8(6.11%) have length of 20-24 pages. There was only one contribution that has page length between 25-29, 1-4, and > 25-29, i.e., 4(3.05%), 3(2.29%), and 2 (1.53%).
Table 8: Length of articles No of pages Years No. of Articles % 2004 2006 2007 2008 2009 2010 2011 2012 2013 2014 01--04 0 0 0 0 0 0 0 0 1 2 3 2.29 05--09 0 1 5 0 0 2 6 10 6 16 46 35.11 10--14 0 0 0 2 3 1 5 8 10 22 51 38.93 15--19 2 0 0 1 1 2 0 0 4 7 17 12.98 20--24 4 2 0 1 0 0 0 0 0 1 8 6.11 25--29 3 0 0 0 0 0 0 0 0 1 4 3.05 > 29 1 1 0 0 0 0 0 0 0 0 2 1.53 Total 10 4 5 4 4 5 11 18 21 49 131 100 0 200 400 600 800 1000 1200 1400 1600 1800 1 2 3 4 5 6 7 8 9 10 11 12 13 14 15 16 17 18
Cumulative citations
5.9. Study of citations
Table 9 indicates that the detail of number of citations appearing at the end of contribution in the year 2004 to 2014.Out of 131 articles published, 2 articles have no citations. The highest number of articles with citation between 20-29 is 46(35.11%), whereas 29(22.14%) articles have citation between 10-19.Further followed by 19(14.50%) article have citation between 30-39 while 17(12.98%) article citation have between 40-49.The lowest number of contributions with citation between 50-59,1-9,60-79 and more than > 50-59,1-9,60-79.
Table 9: Study of citations No. of Citations Years No. of Articles % 2004 2006 2007 2008 2009 2010 2011 2012 2013 2014 01--09 0 1 0 0 0 1 1 2 1 1 7 5.34 10--19 4 0 2 1 2 2 4 7 6 1 29 22.14 20--29 5 1 3 0 0 1 4 7 7 18 46 35.11 30--39 1 1 0 1 1 0 0 2 2 11 19 14.50 40--49 0 0 0 1 1 1 2 0 4 8 17 12.98 50--59 0 1 0 1 0 0 0 0 1 5 8 6.11 60--69 0 0 0 0 0 0 0 0 0 1 1 0.76 70--79 0 0 0 0 0 0 0 0 0 1 1 0.76 ˃79 0 0 0 0 0 0 0 0 0 1 1 0.76 NIL 0 0 0 0 0 0 0 0 0 2 2 1.53 Total 10 4 5 4 4 5 11 18 21 49 131 100 5.10. Distribution of citations
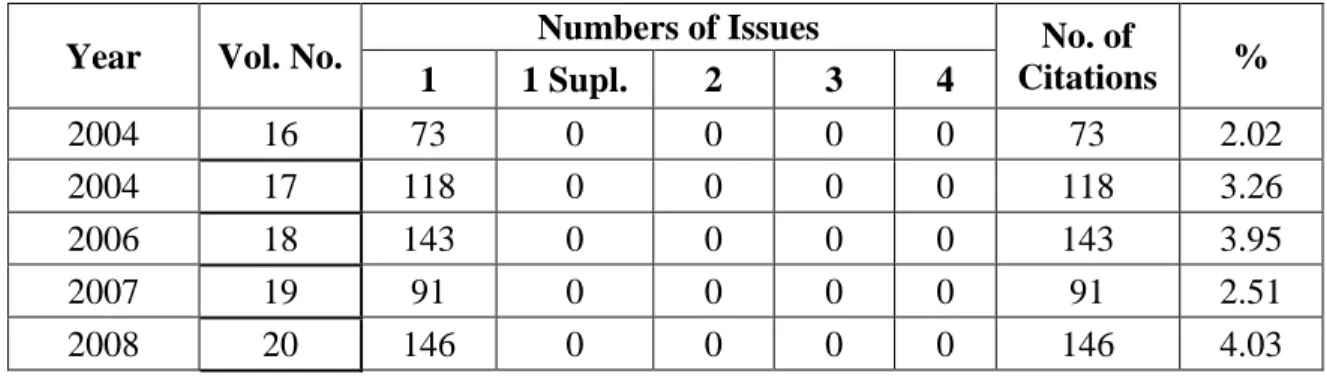
The table 10 reveals that the 11 volumes have 3620 citations add to the 131 articles. Out of 3620 citations, vol.26 has the highest number of citations, that is, 1721(47.54%) while volumes 25 have 517(14.54%) citations. There are small numbers of citation have, i.e. vol.24, vol.23, vol.20, vol.18 and vol.17, that is, 366(10.11%), 235(6.49%), 146(4.03%), 143(3.95%) and 118(3.26%). The lowest number of citation is 110, 100, 91 and 73 distributions of citations.
Table 10: Distribution of citations
Year Vol. No. Numbers of Issues No. of
Citations % 1 1 Supl. 2 3 4 2004 16 73 0 0 0 0 73 2.02 2004 17 118 0 0 0 0 118 3.26 2006 18 143 0 0 0 0 143 3.95 2007 19 91 0 0 0 0 91 2.51 2008 20 146 0 0 0 0 146 4.03
2009 21 110 0 0 0 0 110 3.04 2010 22 100 0 0 0 0 100 2.76 2011 23 113 0 122 0 0 235 6.49 2012 24 180 0 186 0 0 366 10.11 2013 25 227 0 290 0 0 517 14.28 2014 26 490 207 215 424 385 1721 47.54 10 years 11 Vol. 1791 207 813 424 385 3620 100 5.11. Types of publication
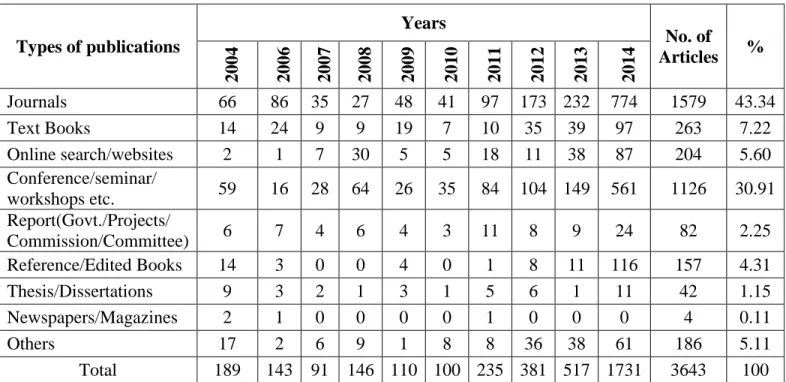
The Journal of King Saud University-Computer and Information Sciences authors were found to use varied resources for their research (Table 11). Indicates that the majority of the contributors preferred journals as the source of information which occupied the top position with the highest number of citations 1579(43.79%) of the total 3643 citations. The second highest position is occupied by Conference/seminar/workshops etc. with 1126(30.91%) citations. It is followed by books with 263(7.225%).
Table 11: Types of publication
Types of publications Years No. of Articles % 2004 2006 2007 2008 2009 2010 2011 2012 2013 2014 Journals 66 86 35 27 48 41 97 173 232 774 1579 43.34 Text Books 14 24 9 9 19 7 10 35 39 97 263 7.22 Online search/websites 2 1 7 30 5 5 18 11 38 87 204 5.60 Conference/seminar/ workshops etc. 59 16 28 64 26 35 84 104 149 561 1126 30.91 Report(Govt./Projects/ Commission/Committee) 6 7 4 6 4 3 11 8 9 24 82 2.25 Reference/Edited Books 14 3 0 0 4 0 1 8 11 116 157 4.31 Thesis/Dissertations 9 3 2 1 3 1 5 6 1 11 42 1.15 Newspapers/Magazines 2 1 0 0 0 0 1 0 0 0 4 0.11 Others 17 2 6 9 1 8 8 36 38 61 186 5.11 Total 189 143 91 146 110 100 235 381 517 1731 3643 100
5.12. Geographical distribution of contributions
Bibliometrically the value of place of publication point to the nationality of a document. Place of publication is the best guide available to nationality of a document. Table 12 shows the contributions in volume nos. 16-26 of the journal by country. The
study indicates that while the Saudi Arabia takes top position with its contribution 90(68.70%), India 81(61.83%), Malaysia 20(15.27%), Tunisia 12 (9.16%), and UK 11(8.40%). Authors from Algeria and Egypt 10 (7.63), Iran and USA 8(6.11%) and Jordan and Pakistan have contributed 7(5.34%) separately. Lowest number, that is, Canada, Spain, Taiwan, China, Germany, Greece, UAE, France, Mexico, Yemen, Morocco, Czech Republic, Iraq, and Oman have contributed.
Table 12: Geographical distribution of contributions
Ranks Name of Country No. of Contributions (n=304) % 1 Saudi Arabia 90 68.70 2 India 81 61.83 3 Malaysia 20 15.27 4 Tunisia 12 9.16 5 UK 11 8.40 6 Algeria 10 7.63 7 Egypt 10 7.63 8 Iran 8 6.11 9 USA 8 6.11 10 Jordon 7 5.34 11 Pakistan 7 5.34 12 Canada 6 4.58 13 Spain 5 3.82 14 Taiwan 5 3.82 15 China 4 3.05 16 Germany 4 3.05 17 Greece 3 2.29 18 UAE 3 2.29 19 France 2 1.53 20 Mexico 2 1.53 21 Yemen 2 1.53 22 Morocco 1 0.76 23 Czech Republic 1 0.76 24 Iraq 1 0.76 25 Oman 1 0.76 (n=131)
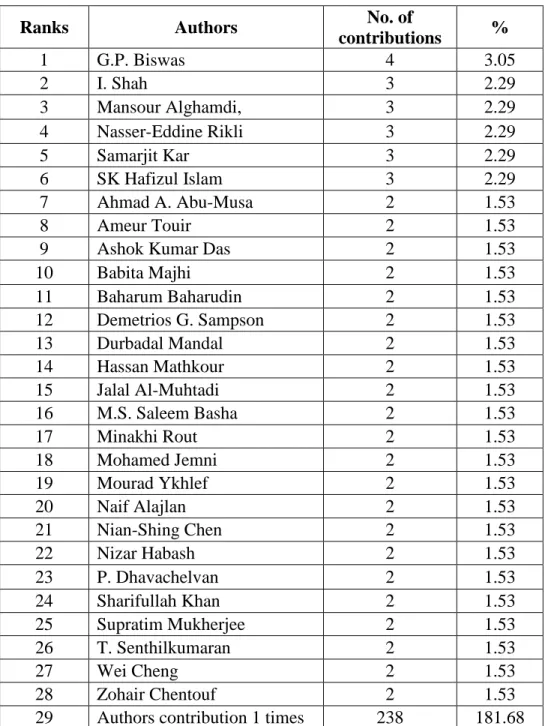
5.13. Ranking of contributors
There are a total of 301 authors who contributed articles to JKSU-CIS during 2004 to 2014. Table 13 reveals that G.P. Biswas of India is the most leading contributor (4(3.05%) articles), followed by I. Shah, Mansour Alghamdi, and Nasser-Eddine Rikli from Saudi Arabia, Samarjit Kar and SK Hafizul Islam from India (3(2.29%) articles each). There are 22 authors contributing 2 each articles while 77 authors contributing 1 each article simultaneously.
Table 13: The most prolific contributors in 2004 to 2014
Ranks Authors No. of
contributions % 1 G.P. Biswas 4 3.05 2 I. Shah 3 2.29 3 Mansour Alghamdi, 3 2.29 4 Nasser-Eddine Rikli 3 2.29 5 Samarjit Kar 3 2.29 6 SK Hafizul Islam 3 2.29 7 Ahmad A. Abu-Musa 2 1.53 8 Ameur Touir 2 1.53
9 Ashok Kumar Das 2 1.53
10 Babita Majhi 2 1.53 11 Baharum Baharudin 2 1.53 12 Demetrios G. Sampson 2 1.53 13 Durbadal Mandal 2 1.53 14 Hassan Mathkour 2 1.53 15 Jalal Al-Muhtadi 2 1.53 16 M.S. Saleem Basha 2 1.53 17 Minakhi Rout 2 1.53 18 Mohamed Jemni 2 1.53 19 Mourad Ykhlef 2 1.53 20 Naif Alajlan 2 1.53 21 Nian-Shing Chen 2 1.53 22 Nizar Habash 2 1.53 23 P. Dhavachelvan 2 1.53 24 Sharifullah Khan 2 1.53 25 Supratim Mukherjee 2 1.53 26 T. Senthilkumaran 2 1.53 27 Wei Cheng 2 1.53 28 Zohair Chentouf 2 1.53
29 Authors contribution 1 times 238 181.68 (n=131)
5.14. Author affiliation from universities/institutions
Table 14 provides an author affiliation from universities/institutions. It is found that majority of author from Saudi Arabia at King Saud University are contributed article for JKSU-CIS, that is,58(44.27%) while authors from India at National Institute of Technology Durgapur, West Bengal contributed articles, that is, 11(8.40%). Further followed by King Abdul Aziz City for Sciences and Technology, Riyadh and Pondicherry Engineering College, Puducherry have contributed 10(7.63%) articles each simultaneously. There are 77(58.78) Authors Affiliation from Different Universities/inst. contributed 1 times.
Table 14: Author affiliation from universities/institutions Ranks Name of Universities/institutions Country No. of
contributions %
1 King Saud University Saudi Arabia 58 44.27
2 National Institute of Technology Durgapur,
West Bengal India 11 8.40
3 King Abdul Aziz City for Sciences and
Technology, Riyadh Saudi Arabia 10 7.63
3 Pondicherry Engineering College,
Puducherry India 10 7.63
4 Indian Institute of Information Technology,
Allahabad India 8 6.11
4 Indian School of Mines, Dhanbad India 8 6.11
5 Universiti Teknologi PETRONAS, Malaysia 7 5.34
6 University of Tunis Tunitia 6 4.58
7 King Fahd University of Petroleum and
Minerals Saudi Arabia 5 3.82
7 National Sun Yat-sen University, Taiwan 5 3.82
7 Salman bin Abdulaziz University, Saudi Arabia 5 3.82
8 Cardiff University UK 4 3.05
9 Beijing Normal University, Beijing, China 3 2.29
9 Central Scientific Instruments Organisation
(CSIO), CSIR, Chandigarh India 3 2.29
9 International Institute of Information
Technology, Hyderabad India 3 2.29
9 Islamic Azad University, Shiraz, Iran 3 2.29
9 Jordan University of Science and
Technology Jordan 3 2.29
9 King Abdulaziz University, Jeddah, Saudi Arabia 3 2.29
9 National University of Malaysia Malaysia 3 2.29
9 National University of Sciences and
Technology (NUST), Pakistan 3 2.29
9 Universiti Sains Malaysia, Malaysia 3 2.29
9 University of Birmingham, UK 3 2.29
9 University of Sfax, Tunisia Tunisia 3 2.29
9 Zagazig University, Zagazig, Asharkia, Egypt 3 2.29
10 B.B.A. University, Lucknow India 2 1.53
10 Cairo University, Cairo, Egypt 2 1.53
10 Electronics, Communications and Computer
Department, Faculty of Eng., Cairo, Egypt 2 1.53
10 ISG, Tunis, Tunisia 2 1.53
10 MCKV Institute of Engineering, India 2 1.53
10 Microsoft, Bellevue, USA 2 1.53
10 Minia University, Egypt 2 1.53
10 National Institute of Technology, Gujarat, India 2 1.53
10 Netprowise Consulting, Chennai India 2 1.53
10 New York University Abu Dhabi, UAE 2 1.53
10 Research & Development, Griantek,
Bengaluru India 2 1.53
10 Shahid Beheshti University, G.C., Tehran, Iran 2 1.53
10 Siksha ’O’ Anusandhan Deemed to be
University, Bhubaneswar, India 2 1.53
10 Technische Universitaet Dresden, Germany 2 1.53
10 Tecnolo´gico de Monterrey, Quere´taro,
Mexico Mexico 2 1.53
10 Universitat de Girona, Girona, Spain 2 1.53
10 Universite´ de Moncton, Campus de
Shippaga Canada 2 1.53
10 Universiti Tenaga Nasional (UNITEN) Malaysia 2 1.53
10 University of Djelfa, Algeria 2 1.53
10 University of Essex UK 2 1.53
10 University of Piraeus and CERTH, Greece 2 1.53
10 University of Science & Technology Bannu, Pakistan 2 1.53
10 University of Tabuk, Tabuk Saudi Arabia 2 1.53
10 Yarmouk University, Irbed, Jordan 2 1.53
11 77 Author s Affiliation from Different
Universities/inst. contributed 1 time
Different
countries 77 58.78
(n=131)
5.15. Ranked list of cited journals
Table 15 shows the frequency of journals cited in issue nos. 16-26 of the JKSU-CIC. Journal of King Saud University-Computer and Information Sciences have ranks first with 57 citations (43.51%). Experts System with Applications rank second with 50 citations (38.17%). The third most often cited journals are pattern recognition letters, with 22 citations (16.79%).
Table 15: Ranked list of cited journals
Ranks Name of Journals No. of Citations %
1 Journal of King Saud University-Computer and
Information Sciences 57 43.51
2 Experts System with Applications 50 38.17
3 Patter Recognition Letters 22 16.79
4 Communication of the ACM 17 12.98
5 IEEE/ACM Trans. on Networking 14 10.69
5 Multimedia Systems 14 10.69
6 IEEE Communications Magazine 13 9.92
7 European Journal of Operational Research 12 9.16
7 Information Sciences 12 9.16
8 IEEE Journal on Selected Areas in Communication 11 8.40
8 Information Sciences 11 8.40
8 Neurocomputing 11 8.40
9 ACM SIGCOMM 10 7.63
9 Educational Technology Society 10 7.63
9 Computer Communications 10 7.63
10 IEEE Transactions on Information Theory 9 6.87
10 Computational Linguistics 9 6.87
10 Computers & Education 9 6.87
10 Decision Support Systems 9 6.87
11 Fuzzy Sets and Systems 8 6.11
11 Information Management & Computer Security 8 6.11
11 Journal of the American Society for Information Science
and Technology 8 6.11
11 Lecture Notes in Computer Science 8 6.11
11 Literary & Linguistic Computing 8 6.11
11 Remote Sensing of Environment 8 6.11
12 Artificial Intelligence 7 5.34
12 Computer Network 7 5.34
12 IEEE Transactions Acoustics, Speech, and Signal
Processing 7 5.34
12 Journal of Food Engineering 7 5.34
12 Signal Processing Journal 7 5.34
13 ACM Computing Surveys 6 4.58
13 ACM SIGMOD 6 4.58
13 IEEE Transactions on Information Theory 6 4.58
13 IEEE Transactions on Parallel and Distributed Systems 6 4.58
13 Journal of Medical Systems 6 4.58
14 ACM Transactions on Information and System Security 5 3.82
14 Computers & Security 5 3.82
14 Designs, Codes and Cryptography 5 3.82
14 IEEE Network 5 3.82
14 IEEE Transactions on Circuits and Systems 5 3.82
14 IEEE Transactions on Communications 5 3.82
14 IEEE Transaction on Computer-Aided Design of
Integrated Circuits and System 5 3.82
14 IEEE Transactions on Computers 5 3.82
14 IEEE Transactions on Computers 5 3.82
14 IEEE Transactions on Energy Conversion 5 3.82
14 IEEE Transactions on Information Technology in
Biomedicine 5 3.82
14 IEEE Transactions on Pattern Analysis and Machine
Applications 5 3.82
14 Industrial Management & Data Systems 5 3.82
14 International Journal of Forecasting 5 3.82
14 International Journal of Remote Sensing 5 3.82
14 Journal of Information Systems 5 3.82
14 Journal of Network and Computer Application 5 3.82
14 Speech Communication 5 3.82
14 Wireless network 5 3.82
15 36 Titles with 4 citation 144 91.60
16 67 Titles with 3 citation 201 107.63
17 154 Titles with 2 citation 308 155.73
18 863 Titles with 1 citation 863 451.15
(n=131)
6. Findings of the Study
The findings of this study can be summarized as follows:
• The study shows that the publication of articles in Journal of King Saud University-Computer and Information Sciences (JKSU-CIS) has witnessed an escalating trend from 2004 to 2014.
• The highest numbers of articles are found to be two authored contributions, followed by single-author and more than three-authored contributions. However, three authored and multiple authored contributions are found quite less.
• As a result, the degree of collaboration in the Journal of King Saud University of Computer Sciences is 0.695 from 2004 to 2014, which clearly indicates the dominance of multi authorship over single authorship in its contributions.
• Author productivity pattern of JKSU-CIS observed that the number of expected authors is more than observed authors. The difference between observed and expected authors is very wide.
• Journal articles were found to be the most frequently cited materials followed by Conference/seminar/workshops etc., and books.
• The analysis shows that the highest numbers of contributors belong to Saudi Arabia, followed by India, Malaysia, Tunisia UK, Algeria, Egypt, USA, Iran, Jordon etc. during 2004 to 2014.
• It is found that G.P. Biswas of India is the most leading contributor, followed by I. Shah, Mansour Alghamdi, and Nasser-Eddine Rikli from Saudi Arabia.
• It is found that majority of author from Saudi Arabia at King Saud University are contributed article for JKSU-CIS, after that authors from India at National Institute of Technology Durgapur, West Bengal contributed articles, that is, 11(8.40%).
• In this study reveals that majority of a contributions appeared under networking/ web/search engines. The next position is taken by Arabic Script as well as Singular Value Decomposition Algorithms (SVD)/Algorithms/Digital signature. • The distribution of journal citations moderately confirms to Bradford's Law. • It is found that JKSU-CIS have ranks first with 57 citations. Experts System with
Applications rank second with 50 citations .The third most often cited journals are pattern recognition letters with 22 citations.
7. Conclusion
A citation is the location in the text where a reference is cited which typically contains the reference number in superscript or brackets. The citation text is the text surrounding the citation. Moreover, a reference may be cited multiple times within the same article, and the citation text for each citation would consist of the text surrounding each citation. The publishing trend totally depends on the output of contributors, patterns of contributions and the quality of research. The year 2011-2014 shows the maximum number of contributions to the JKSU-CIS. The majority of the articles were contributed by two authors.
Author productivity pattern of JKSU-CIS was observed that the number of expected authors is more than observed authors. The difference between observed and expected authors is very wide. So in this case the Lotka's Law is not applicable. According to Bradford law the ratio between three zones should be in the ratio 1: n: n2: n3…’ while the ratio 55: 179: 591. It can be inferred that the distribution nearly follow the Bradford’s law. It is registered that G.P. Biswas of India is the most leading contributor (4(3.05%) articles); followed by I. Shah, Mansour Alghamdi, and Nasser-Eddine Rikli from Saudi Arabia. The Journal of King Saud University-Computer and Information Sciences is notably a scholarly journal that stipulates or induces fruitful research for the computer science profession.
References
Al-Khalifa, H .S. 2014. Scientometric assessment of Saudi publication productivity in computer science in the period of 1978-2012. International Journal of Web Information Systems 10(2), 194-208.
Ardanuy, J.2013. Sixty years of citation analysis studies in the humanities (1951–2010). Journal of the American Society for Information Science and Technology 64(8), 1751–1755.
Bakri, A. Willett, P. 2011. Computer science research in Malaysia: a bibliometric analysis. Aslib Proceedings 63(2/3), 321-335.
Bala, M., Singh, M.P. 2014. A Scientometric Study of Journal of Chemistry and Bio-Physics (IJBB). Library Philosophy and Practice (e-journal). Available at: http://digitalcommons.unl.edu/cgi/viewcontent.cgi?article=3030
Bala, Madhu and Singh, Mahender Pratap 2014. "A scientometric study of journal of bio-chemistry and biophysics (ijbb)" Library Philosophy and Practice (e-journal). At: http://digitalcommons.unl.edu/libphilprac/1168
Bradford, S.C.1985. Sources of information on specific subjects. Journal of information Science 10,176-180.
Garfield, E.1985. In tribute to Derek John de Solla Price: a citation analysis of little science, big sicence. Scientometrics 7(3-6), 487-503.
Hosein Mardani,A.,Abdiazar, S.2014.Global research status in leading nuclear science and technology journals during 2001-2010: A bibliometric analysis based on ISI Web of Science. Library Review 63(4/5), 324-339.
Hussain, A., Swain, D.K.2011.A citation analysis of top research papers of computer science. International Research: Journal of Library and Information Science 1(2).
Iroaganachi, Mercy A., Itsekor, Victoria, and Osinulu, Ifeakachuku 2014. Citation analysis of social science research: a case study of bachelor degree research project reports of a Nigerian University 2009-2013. Library Philosophy and Practice.at:
http://digitalcommons.unl.edu/cgi/viewcontent.cgi?article=2807&context=libphil prac
Journal of King Saud University Computer and Information Sciences. 2015. Available at:
www.journals.elsevier.com/journal-of-king-saud-university-computer-and-information-sciences
Lewis, B.R., Templeton, G.F., Luo, X.2007. A scientometric investigation into the validity of IS journal quality measures. Journal of the Association for Information Systems 8(12), 619–633.
Leydesdorff, L., Milojevic, S.,2013. Scientometrics arXiv: 1208.4566, forthcoming in: Lynch, M. (editor), International Encyclopedia of Social and Behavioral Sciences subsection 85030.
Maharana, B., Majhi, S., Bihari Sethi, B.2011. Citation analysis of top research papers in chemistry with specific reference to India. Library Review 60(6), 501-512.
Nwagwu, W., Egbon, O.2011.Bibliometric analysis of Nigeria's social science and arts and humanities publications in Thomson Scientific databases. The Electronic Library 29(4), 438-456.
Rowlands, I. 2005. Emerald authorship data, Lotka's Law and research productivity. Aslib Proceedings 57(1), 5-10.
Roy, Sanku Bilas, Basak, Moutusi. 2013. Journal of Documentation: a Bibliometric Study. Library Philosophy and Practice (e-journal) available at: http://digitalcommons.unl.edu/libphilprac/945
Serenko, A., Bontis, N.2004. Meta-review of knowledge management and intellectual capital literature: Citation impact and research productivity rankings. Knowl. Process Manage. 11(3), 185–198.
Singh, G; Mittal, R and Ahmad, M.2007. A bibliometric study of literature on digital libraries. The Electronic Library 25(3), 342-348.
Singh, K.P.,Bebi, M.2013.Citation Analysis of PhD Theses in Sociology Submitted to University of Delhi during 1995-2010. DESIDOC Journal of Library & Information Technology 33(6), 489-493.
Subramanian, K. 1983. Bibliometric studies of research collaboration: A review. Journal of Information Science 6(1), 33-38.
Swain, C., K. Swain, D., Rautaray, B.2013.Bibliometric analysis of Library Review from 2007 to 2011. Library Review 62(8/9), 602-618.
Tsay, Ming-Yueh .2011. A Bibliometric Analysis on the Journal of Information Science. Journal of Library and Information Science Research 5(2), 1-28.
van Raan, A. 1996. Scientometrics: State-of-the-art. Scientometrics 38(1), 208–218.
Vob, S., Zhao, X. 2005. Some steps towards a scientometric analysis of publications in machine translation. Proc. IASTED Int. Conf. Artif. Intell. Appl., 651–655.
Young, B.2014. What Do Engineering Researchers Cite? A Citation Analysis Study of Sixteen Engineering Journals. Issues in Science and Technology Librarianship. Available at http://www.istl.org/14-winter/refereed4.html
Zainab, A. N; Ani, K.W.U and Anur, N. B. 2009. A single journal study: Malaysian Journal of Computer Science. Malaysian Journal of Computer Science 22(1), 1-18.