The Effect of Total Quality Management (TQM), Organizational
Excellence (OE) and Human Resource Management (HRM) on
Organizational Performance
Abdullah Ibrahim Al-Darmaki1* Hassan Saleh Al-Dhaafri2 1.Management and Science University (MSU), Malaysia
2.Skyline University, Sharjah, United Arab Emirates
Abstract
Purpose: This study aims to examine the effect of TQM, HRM and OE on organizational performance.
Design/Method/Approach: This study employed the survey questionnaire to gather data from the respondents in Al-Ain Municipality, and from 200 questionnaires, 135 were deemed were returned and deemed usable. For data analysis, Partial Least Square Equation Modeling was used.
Findings: The findings from the statistical analysis showed a positive and significant effect of TQM and organizational excellence on organizational performance but the relationship between HRM and organizational performance was unconfirmed.
Practical Implications: The study findings practical implications include the findings assisting managers and decision makers to reach a plausible decision concerning the TQM system implementation in the hopes of maximizing the overall organizational performance and excellence.
Originality/Value: The present study is a pioneering study that investigates the collective effect of TQM, HRM and organizational excellence on the organizational performance.
Keywords: Total quality management (TQM), human resource management (HRM), organizational excellence
(OE), organizational performance (OP), Al-Ain Municipality,
1. Introduction
In the present global dynamic business environment, organizational on a global scale have a tendency towards improving and increasing their performance through the implementation and carrying out of initiatives of innovative strategies for business sustainability and achievement of goals. Businesses attempt at enhancing their development by adopting various philosophies and approaches such as Total Quality Management (TQM) and business excellence (Oakland, 1999). Generally speaking, TQM and Human Resource Management are deemed to be the top strategies employed to improve performance of organizations.
This study’s main objective is to investigate the overall effect of TQM, HRM and OE on organizational performance. Owing to the prior findings reported mixed findings in literature regarding the relationship between TQM, HRM and OE and their effect on organizational performance, the present study examines the overall effect of the former three variables on the latter in the context of Al-Ain Municipality.
2. Related Literature and Research Hypotheses
The review of literature is discussed in three categories based on the understanding of relationships; first, the relationship between TQM and organizational performance is discussed. This is followed by the relationships between HRM and organizational performance, and lastly, the relationship between organizational excellence and organizational performance. Based on the discussion of literature comprising of prior studies dedicated to the topic, several hypotheses are forwarded concerning the relationship among the variables.
2.1 TQM and Organizational Performance
Literature provides extensive studies dedicated to examining the relationship between TQM and organizational performance with the majority of them evidencing a positive and significant effect of TQM on organizational benefits like customer satisfaction and employee satisfaction (Lawler, Ledford, Mohman & Tenkasi, 1995) as well as financial performance (Cummings & Worley, 1997). In a similar line of study, Sila (2007) stated that TQM variables should be examined for their effects like leadership, process management, HRM, financial and market outcomes, information and analysis, customer focus, organizational effectiveness and supplier management. Majority of prior studies of this caliber are categorized as empirical/conceptual but of low quality level and hence, more studies are called for to focus on TQM strategy.
More specifically, Baker (2003) conducted a research in the period from 1987 to 2002 while using meta-analysis. He empirically supported the relationship between organizational performance and TQM practices while other studies like Brah and Lim (2005) revealed that TQM fell short of sustaining organizational performance.
100
leads to this study urging more research in the area that would include other variables that assist in increasing the positive and significant effect. This study proposes the following hypothesis to be tested;
H1: There is a positive significant effect of TQM practices on organizational performance. 2.2 Organizational Excellence and Organizational Performance
The term excellence shows the top evaluation ranking – this should be emphasized as according to Dahlgaard-Park (2009), it is challenging to determine when excellence can be achieved if the term is not defined. Excellence is a term that is often related with businesses and organizations although organizational excellence is more attributed to the public sector firms while business excellence is attributed to those in the private sector (McAdam, 2000).
Both organizational excellence and organizational performance are top indicators for organizational competitiveness, goal achievement, success, development as well as advancement. Organizations have been reported to achieve excellence in their short, medium and long-term objectives and the organizational excellence-organizational performance relationship is such that one of the concepts leads to the other – in other words, organizational excellence leads to organizational performance (Al-Dhaafri, Yusoff & Al-Swidi, 2013). Excellent organizations are those that perform at 60% level or above as emphasized by the EFQM and extant excellence models deem excellence as a level of performance that is outstanding (Antony & Bhattacharyya, 2010). The excellence models impact on organizational performance was investigated by Kiitam and Tammaru (2012) where they reported a positive effect of the former on the latter with correct implementation. In this paper, the following hypothesis is proposed;
H2: There is a positive and significant effect of organizational excellence on organizational performance. 2.3 Human Resource Management and Organizational Performance
According to Noe, Hollenbeck, Gerhart and Wright (2010), human resource management (HRM) refers to the policies, principles, practices that affect the staff attitude and performance. HRM involves the primary activities of recruitment, planning, training, compensation, and enhancement of performance management and the staff relationship welfare (Tabiu, 2013).
Moreover, performance management is one of the top mechanisms to improve and enhance human resource and its performance (Khoury & Analoui, 2004). Added to this, the performance system assessment is comprised of well-designed work responsibilities/practices that work towards enhancing the effectiveness of work (Cabrera & Cabrera, 2005). Professional improvement of staff align HRM quality with business needs and this in turn, leads to enhanced staff efficiency, competence, capability and knowledge sharing (Cabrera & Cabrera, 2005).
Although Human Resource Management (HRM) practices and activities undoubtedly lead towards the achievement of job performance and organizational performance, organizational members often disregard the effectiveness of HRM practices use and its effect on organizational performance, particularly in developing nations like Nigeria (Tabiu, 2013).
Furthermore, HRM practices can lead to enhanced organizational performance via their contribution towards employee and customer satisfaction, innovation, productivity and development of reputation among competitive firms (Delaney & Huselid, 1996; Noe et al., 2010).
Prior theoretical studies have called for academics to examine the effects of HRM practices on organizational performance in varying contexts and firms in order to minimize the gap in literature. In this study, the following hypothesis is proposed to be tested;
H3: There is a positive and significant effect of HRM on organizational performance. 3. Methodology
This study aims to examine the overall effect of various dependent variables (TQM, HRM, and organizational excellence) on organizational performance, and to do so, the researcher employed a quantitative method in the form of a questionnaire survey- such method is among the major tools used to gather primary data from respondents (Kerlinger & Lee, 2000). Data was gathered with the help of a cross-sectional design that is appropriate for data collection at one point in time. More specifically, the questionnaires were distributed in March 2015 and retrieved at the end of May 2015 in the form of hard copies and emails from the respondents in Al-Ain Municipality.
Owing to the nature of the present study’s variables, various Al-Ain Municipality departments were chosen to complete the questionnaires through their heads. Head of departments refer to the line managers that are deemed to be the liaison between high level managers and employees and they are the most knowledgeable of the practices and strategies and their implementation. Consequently, two hundred and fifty questionnaires were distributed, of which one hundred and thirty five were retrieved.
instance, TQM and HRM measurements were adopted from the studies of Brah, Wong and Rao (2000), Anderson and Sohal (1999), Terziovski and Samson (1999), and Rao (2000), while EO dimensions were adopted from Covin and Slevin (1989). Added to these measurements are the measurements of organizational excellence that were adopted from the studies of Pinar and Girard (2000) and those of organizational performance were adopted from Kaplan and Norton (1992, 2000). The method used for the analysis of data and the hypotheses testing is the Structural Equation Modeling (SEM), Smart-PLS statistical software.
4. Statistical Analysis and Results
The outer model was confirmed in light of its reliability and validity through Partial Least Squares (PLS). Many of the researchers are of the consensus that reliability and validity are tests that should be carried out prior to testing the hypotheses. The study model comprises of the variables of TQM, HRM, organizational excellence and organizational performance. The relationships among these variables were examined through Chin’s (1998) two-step approach.
Studies of structural equation modeling (SEM) dictates that construct validity and reliability of the model should be confirmed prior to testing the proposed relationships.
4.1 Measurement of Outer Model
The next sub-sections contain a discussion of the validity and reliability of the constructs and the establishment of the goodness of the measurement model. This was carried out through the confirmation of content validity, discriminant validity and convergent validity.
4.1.1 The Content Validity
In the literature dedicated to multivariate analysis, the construct’s content validity is confirmed by comparing it with other constructs in the model. More specifically, Chin (1998) and Hair et al. (2010) recommended the factor loading to be examined for content validity. During this test, items are dropped if their loadings are higher in other constructs compared to their own respective constructs. The entire constructs are presented in Table 1 and it is evident that they all significantly loaded in their respective constructs and thus confirming the content validity of the study’s measurement model.
TABLE 1
4.1.2 The Convergent Validity
The convergent validity refers to the level that a group of items converges in order to measure a certain variable (Hair et al., 2010). Studies concerning SEM confirm convergent validity by testing the composite reliability, the loadings and the average variance extracted (AVE). High loading and statistic significance of items is represented by a factor loading of at least 0.7, AVE of at least 0.5 and composite reliability of at least 0.7. These conditions were satisfied and confirmed as presented in Table 2. Hence, the outer model (measurement model) was confirmed to have suitable convergent validity (Bagozzi & Yi, 1988).
102 Table 2: The Convergent Validity Analysis
Construct Items Loadings Cronbach's
Alpha CR a AVEb Benchmarking B1 0.879 0.868 0.919 0.791 B2 0.891 B3 0.898 Continuous Improvement CI1 0.910 0.866 0.918 0.789 CI2 0.850 CI3 0.902 Customer Focus EXC1 0.902 0.861 0.916 0.784 EXC2 0.930 EXC3 0.822 Innovation EXI1 0.923 0.925 0.953 0.870 EXI2 0.926 EXI3 0.949 Personnel Commitment EXP1 0.899 0.914 0.940 0.796 EXP2 0.917 EXP3 0.874 EXP4 0.878 Empowerment HRE1 0.932 0.923 0.951 0.867 HRE2 0.919 HRE3 0.942 Involvment HRI1 0.877 0.859 0.914 0.780 HRI2 0.870 HRI3 0.902 Training HRT1 0.922 0.919 0.949 0.861 HRT2 0.928 HRT3 0.934
Information and Analysis
IA1 0.903 0.895 0.934 0.826 IA2 0.920 IA3 0.903 Leadership ML1 0.925 0.932 0.952 0.831 ML2 0.931 ML3 0.895 ML4 0.894 Organizational Performance OP1 0.849 0.869 0.910 0.718 OP2 0.860 OP3 0.841 OP4 0.838 Service Design SD1 0.910 0.799 0.909 0.833 SD2 0.915 Strategic Planning SP2 0.895 0.915 0.940 0.797 SP3 0.910 SP4 0.891
4.1.3 The Discriminant Validity
Discriminant validity was referred to by SEM studies as the level that the items distinguish a construct from the other constructs of the outer model. The items of each construct should have variance among them more than with other constructs in the model. The diagonal line of values presented in Table 2, reveals the square root of AVE, and below such values are the constructs correlations. Discriminant validity is confirmed by comparing the values of the diagonal line with others in off diagonal lines. The table shows that the values within the diagonal lines are greater compared to those in their respective columns and rows, confirming the model’s discriminant validity on the basis of the conditions established by Fornell and Larcker (1981).
4.2 Measurement of the Inner Model (Structural Model) and Hypotheses Testing 4.2.1 Testing the Direct Hypotheses
Following the confirmation of the validity and reliability of constructs, the next phase involves the examination of the inner model via testing the hypothesis through the methods of Algorithm and Bootstrapping in PLS. The results of these tests are presented in Figure 2 and Table 5.
Table 4: The Results of the Inner Structural Model
Hypothesis Hypothesis Path Coefficient Standard Error T Value P-Value Decision
H1 TQM -> OP 0.193 0.134 1.430 0.076 Supported
H2 OE -> OP 0.517 0.108 4.785 0.000 Supported
H3 HRM -> OP 0.038 0.113 0.336 0.368 Not-supported
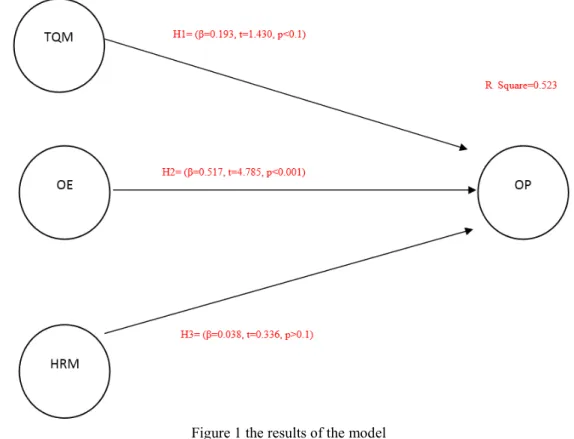
From the results in Figure 1 and Table 4, it is evident that TQM was found to have a positive and significant effect on organizational performance at the significance level of 0.1 (β=0.193, t=1.430, p<0.1), indicating support for H1. The results also revealed a positive and significant effect or organizational excellence on organizational performance (β=0.517, t=4.785, p<0.001), indicating support for H2. On the contrary, while the effect of HRM on organizational performance was positive, it was not significant (β=0.038, t=0.336, p>0.1), indicating that H3 is rejected.
Figure 1 the results of the model
4.3 Predictive Relevance of the Model
The model’s predictive power was tested through R-square, cross-validated redundancy and cross-validated communality. With regards to the R-square values, the indication in terms of values is as follows; 0.26 is considered substantial, 0.13 is considered moderate while 0.02 is considered as weak (Cohen, 1988), in which case, based on the results, the values of R-square are all substantial. Moving on to the cross-validated redundancy and cross-validated communality, they were all found to have medium strength. Their extraction was conducted through the blindfolding procedure of PLS. Values of over zero show the predictive quality of the model (Fornell & Cha, 1994). The values in this case are all higher than zero, indicating that the model has predictive quality.
104 Table 5: Predictive Quality Indicators of the Model
Variable Variable Type R square Cross-Validated Communality Cross-Validated Redundancy
Organizational Performance (OP) Endogenous 0.523 0.718 0.372
4.4 Goodness of Fit (GoF) of the Model
The model’s goodness of fit can be tested through the following conditions; 0.1 is considered small, 0.25 is considered medium and 0.36 is considered large (Wetzels et al., 2009). The GoF value was found to be 0.523, which is deemed to be large according to the above criteria.
Table 6: Goodness of Fit results
Construct R Square Average Variance Extracted Goodness of Fit
Organizational Performance 0.523 0.723 0.651
5. Discussion and Conclusion
This study’s major objective is to explore the effect of TQM, HRM and organizational excellence on organizational performance. Because of the mixed results reported in literature concerning the effect of TQM, HRM, and organizational excellence on organizational performance, different hypotheses were developed and proposed for testing through the use of statistical data analysis.
To recapitulate the results, the hypothesis that proposed a significant effect of TQM on organizational performance was supported at (β=0.193, t=1.430, p<0.1) – such a result is aligned with the results reported by prior studies that confirmed a positive result between the two variables (e.g., Anderson et al., 1994; Arumugam, Ooi & Fong, 2008; Douglas & Judge, 2001; Irefin, Abdul-Azeez & Hammed, 2011; Powell, 1995; Talib et al., 2013). The results also showed a positive and significant relationship between organizational excellence and organizational performance at (β=0.517, t=4.785, p<0.001) – another result that is aligned with those of prior studies in literature (e.g., Lee, 2002; Sharma & Kodali, 2008). However, the effect of HRM is insignificant at (β=0.038, t=0.336, p>0.1) – this may be attributed to the different reasons including low employees’ empowerment, lack of training, and low encouraged that is linked to the bureaucratic regime in the public sector as stated by Arawati (2005) and Talib et al. (2013).
The present study has several theoretical contributions as it attempts to fill the gap in literature by investigating the overall effect of TQM, HRM and organizational excellence on organizational performance. The study results works towards encouraging other researchers to examine other factors that may have a key role in the relationships. Added to this, the study framework is a distinct one that proposed testing relationships for the first time. Practically, this study may be used by managers and decision makers to integrate TQM and organizational excellence in their organizations.
With regards to the limitations, data was collected through self-reported design – a design that is riddled with common method bias (Thornton, 2006) and thus, future studies should use a mixed method design. Moreover, the research design is cross-sectional and as such, a longitudinal design of study should be employed by future studies to examine the overall effects of TQM, HRM, and organizational excellence on organizational performance at various periods in time.