IS PENSION INEQUALITY GROWING
?
* Nadia Karamcheva and Geoffrey Sanzenbacher are both graduate students in economics at Boston College and graduate research assistants at the Center for Retirement Research at Boston College.
Introduction
Employer-sponsored pensions are an important source of retirement income and often make the dif-ference between having a comfortable retirement and just scraping by. Over the past two decades, pension sponsorship and participation have remained rela-tively constant.1 At any given point in time, roughly half of private sector workers age 25-64 are covered by pension plans. This constancy, however, masks a growing inequality in pension participation by income that has become more pronounced with the shift from traditional defined benefit plans to defined contribution plans.
This brief documents and explores trends in pension participation by income. The first section discusses the relative importance of private pensions as a source of retirement income. The second section examines trends in pension sponsorship and partici-pation rates. The third section explores why some in-dividuals choose not to participate. The final section concludes that the shift to defined contribution plans has been a significant factor in the drop in coverage for low earners.
How Important Are Private
Pensions?
Pensions are an important source of retirement in-come for those with higher inin-comes but are negligible for those with lower incomes. Households age 65 and over in the top third of the income distribution receive 31 percent of their non-earned income from pensions, compared with 19 percent for the middle third and just 3 percent for the bottom third.2 The
reason is that low-income individuals have both lower pension coverage rates and lower account balances.
With minimal savings on their own, low-income retirees are almost entirely dependent on Social Security, which generally does not provide enough income for them to maintain their standard of living in retirement. According to the National Retirement Risk Index (NRRI), 60 percent of households in the bottom third are ‘at risk’ of falling short in retirement. This figure is expected to rise in the future, as Social Security is scheduled to replace less income.3
Partici-pation in an employer-sponsored pension plan could help these most vulnerable individuals achieve an adequate retirement.
Trends in Pension Access and
Participation
Pension participation is the result of two events: 1) ac-cess to a retirement plan, and 2) enrollment in a plan. The percent of workers whose employers provide a plan together with the percent who enroll in that plan determines the pension participation rate of the overall population.
Figure 1 shows, over the past three decades, the share of individuals working for an employer that sponsors a plan. Plan sponsorship clearly differs by earnings group. Only about one-third of individuals in the bottom third work for an employer that spon-sors a plan, compared with over 70 percent for the highest earnings group.4 Overall, pension
sponsor-ship has remained relatively stable.
Figure 1. Pension Sponsorship, All Private Sector Male Workers Age 25-64, by Earnings Tercile, 1979-2008
Source: Authors’ calculations from U.S. Bureau of Labor Statistics, Current Population Survey (CPS), 1980-2008.
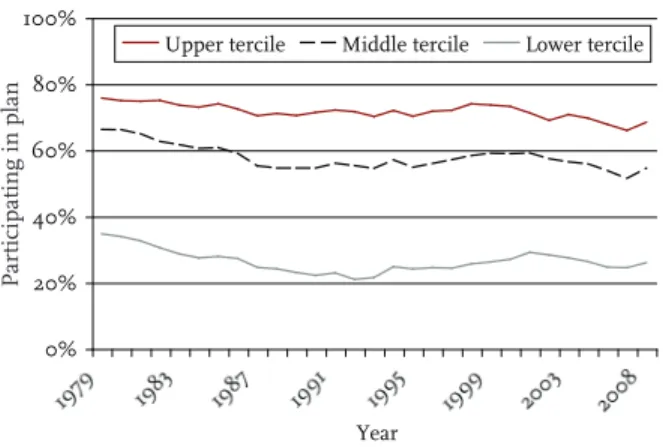
In contrast, the participation rates for workers whose employers provide a plan have shown consid-erable divergence among earnings groups over time (see Figure 2). While workers in the top third have had a nearly constant participation rate over the past 25 years, the rate for the middle third declined con-siderably – from 94 to 86 percent – and for the lowest third fell sharply – from 85 to 69 percent. These drops could be the result of a number of factors, ranging from ineligibility to misinformation about the plans to an inability to contribute due to budget constraints.
Figure 2. Pension Participation Rate for Private Sector Male Workers Age 25-64 at Employers with Pensions, by Earnings Tercile, 1979-2008
Source: Authors’ calculations from 1980-2008 CPS. The data on pension access and participation together determine the overall participation rate, as shown in Figure 3. The biggest drops in overall par-ticipation occurred among middle and low earners, where the rate fell by 22 and 29 percent, respectively. The observed decline for the low-earnings group does not translate to large declines in the overall partici-pation rate and often remains hidden because this group comprised only a relatively small number of the total pension participants in 1979 as it still does today. Yet, breaking down the participation number into sponsorship rates and participation rates by
earn-Figure 3. Pension Participation Rate for Private Sector Male Workers Age 25-64, by Earnings Tercile, 1979-2008
Source: Authors’ calculations from 1980-2008 CPS.
0% 20% 40% 60% 80% 100% 1979 1983 1987 1991 1995 1999 2003 2008 Year
Upper Tercile Middle Tercile Lower Tercile
0% 20% 40% 60% 80% 100% 1979 1983 1987 1991 1995 1999 2003 2008 Year Upper tercile Middle tercile Lower tercile 0% 20% 40% 60% 80% 100% 1979 1983 1987 1991 1995 1999 2003 2008 Year
Upper tercile Middle tercile Lower tercile
Of
fered pension
Take-up rate
P
ings group (as shown in Figures 1 and 2) makes this decline visible. In addition, decreasing participation rates among low earners at sponsoring employers is the main driver of the group’s overall decline in participation rather than any dramatic change in its access to pensions.
Why Are Fewer Middle and
Low Earners Participating?
To better understand the declining pension participa-tion rates among middle and especially low earn-ers, one has to consider the major shift in the type of plans that has occurred since 1979. Traditional defined benefit plans in the private sector have largely been eclipsed by defined contribution plans, predomi-nantly 401(k)s. This shift has particular importance for participation among lower earners, because of the different characteristics of the two plans. In defined benefit plans, enrollment is mandatory – once the worker becomes eligible – and only the employer makes contributions. In contrast, enrollment in defined contribution plans is voluntary and workers, as well as employers, generally contribute. These differences lead to lower participation in defined contribution plans. For example, in 2007, 91 percent of individuals whose employer sponsored a defined benefit plan participated compared with only 67 per-cent of workers whose employer sponsored a defined contribution plan.5
To examine this finding further, we compared participation rates for low, middle and high earners by type of plan. As Figure 4 illustrates, low earners are much less likely to participate in a defined contribu-tion plan than high earners. Condicontribu-tional on working for an employer sponsoring a plan, low earners’ par-ticipation rates are nearly 20 percentage points lower than high earners if the plan is defined benefit and over 40 percentage points lower if the plan is defined contribution.6
An individual might not participate in a sponsored defined contribution plan because he 1) is not eligible, 2) cannot afford to contribute, or 3) chooses not to participate for other reasons. Of these, ineligibility is also a cause of non-participation in defined benefit plans. However, because defined benefit plans have automatic enrollment and do not require worker con-tributions, the other two reasons for non-participation do not apply.
If inability to contribute or failure to take steps to enroll are more prevalent among low and middle earners, in the midst of the pension type shift, one
would expect to see participation rates dropping more among these earners. As discussed above, this pat-tern is indeed what we found.
To explore why some individuals do not participate in a defined contribution plan, we use data from the Retirement Expectations and Pension Plan Coverage topical module of the Survey of Income and Program Participation. These data contain detailed informa-tion on the type of pension plan offered, whether the individual participated and, if the individual did not participate, why not. These reasons include those re-lated to eligibility, such as not enough time on the job or too young to participate; those related to financial constraints, such as cannot afford to contribute and do not want to tie up money; and reasons unrelated to monetary constraints, such as having a spouse with a plan or simply not thinking about it. For low earn-ers, money is the biggest reason (see Figure 5 on the next page). For middle earners, money and “other reasons” both play an important role, with money slightly more prevalent. Compared with high earn-ers, low earners are over three times as likely to claim money was an issue in the decision to not participate and are also more likely to decline to participate for other reasons. Similar, less pronounced patterns hold for middle earners. In addition to more frequently opting not to participate, lower earners are less likely to be eligible for a defined contribution plan because of their age, job type, or job tenure; however, this pat-tern is also true for defined benefit plans.7
Recent efforts to encourage participation in defined contribution plans could potentially shrink the gap between low and high earners. The major
Figure 4. Participation Rate for Private Sector Male Workers Age 25-64 at Employers with Pensions, by Earnings Tercile and Plan Type, 2007
Source: Authors’ calculations from U.S. Census Bureau,
Survey of Income and Program Participation (SIPP), 2007.
78% 41% 91% 64% 96% 83% 0% 20% 40% 60% 80% 100%
Defined Benefit Defined Contribution Plan type Lower tercile Middle tercile Upper tercile P articipating
Source: Authors’ calculations from 2007 SIPP.
innovation has been automatic enrollment, which allows firms to require workers to “opt out” of a plan, instead of the traditional requirement to “opt in.” Studies have shown that this simple change in the default increases participation by as much as 35 percentage points.9 Although automatic enrollment
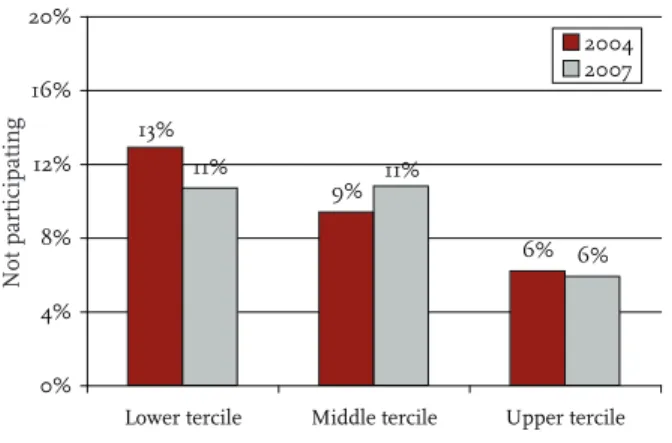
is less likely to boost participation among individu-als who cite money as the major factor for declining to participate, it could potentially increase participa-tion among those citing other reasons. However, for both low and middle earners, no real improvement is evident yet in the SIPP data between the 2003 and 2007 waves (see Figure 6). Non-participation among the lowest third dropped a bit, but it increased among the middle third.10
Conclusion
Private pensions have an important role in provid-ing income security durprovid-ing retirement, particularly given the financial strain on Social Security. Yet, for individuals in the lowest third of the earnings distri-bution, pension participation has declined significant-ly. This trend often remains hidden when looking at overall participation rates because of the small number of pension participants among lower earners. One reason for this decline is the shift in the type of pension plans sponsored and the resulting increase in voluntary non-participation. More workers in the bottom third choose not to participate, citing money as the number one reason. For those who cite non-monetary reasons, one potential solution for improv-ing participation is automatic enrollment. However, for both the bottom and middle thirds, as of 2007, automatic enrollment appears to have not yet had a significant impact.
Figure 5. Percent of Private Sector Male Workers Age 25-64 Declining Defined
Contribution (DC) Plans, 20078
Source: Authors’ calculations from 2007 SIPP.
16% 5% 6% 13% 11% 11% 0% 4% 8% 12% 16% 20%
Lower tercile Middle tercile Upper tercile Money as reason Non-monetary reasons
V
oluntarily not participating
11% 6% 13% 9% 6% 11% 0% 4% 8% 12% 16% 20%
Lower tercile Middle tercile Upper tercile 2004 2007
Figure 6. Percent of Private Sector Male Workers Age 25-64 Declining DC Plans for Non-Monetary Reasons, 2004 and 2007
Endnotes
1 Munnell and Quinby (2009) and Sanzenbacher (2006) illustrate this point with several data sets. 2 Authors’ calculations based on U.S. Bureau of Labor Statistics, Current Population Survey, 2008. 3 Munnell, Golub-Sass, and Webb (2009). 4 Earnings were defined as the reported monthly earnings on the first listed job.
5 Authors’ calculation from the 7th wave of the 2004 Panel of the U.S. Census Bureau’s Survey of Income and Program Participation, 2007. The data reflect the year 2007. The sample was 25- to 65-year-old private sector male workers.
6 Munnell, Golub-Sass, and Muldoon (2009); Huberman, Iyengar, and Jiang (2007); and Basset, Fleming, and Rodrigues (1998) also find a positive relationship between pension participation in defined contribution plans and income or earnings.
7 35.5 percent of lower-tercile workers reported being ineligible to participate in their employer’s defined contribution plan, compared with 7.5 percent of those in the upper tercile. In comparison, 15 percent of lower-tercile workers claimed they were ineligible for their employer’s defined benefit plan compared with only 2 percent of upper-tercile workers.
8 The reasons offered for voluntary non-participation added to the percent who participated would exactly sum to one if people gave only one reason for non-participation. Since some people give more than one reason, it sums to slightly over 1. It should be noted that the CPS and SIPP yield slightly different estimates of the percent of workers who participate in sponsored plans, likely due to differences in question-ing. See Sanzenbacher (2006) for a discussion. 9 Madrian and Shea (2001).
10 Between 2003 and 2007, the number of individu-als declining participation due to financial constraints rose for both the lowest third and middle third of earners.
References
Bassett, William F., Michael J. Fleming, and An-thony P. Rodrigues. 1998. “How Workers Use 401(k) Plans: The Participation, Contribution, and Withdrawal Decisions.” National Tax Journal 51(2): 263-89.
Huberman, G., Sheena S. Iyengar, and Wei Jiang. 2007. “Defined Contribution Pension Plans: Determinants of Participation and Contributions Rates.” Journal of Financial Services Research, 31(1):1–32.
Madrian, Brigitte and Dennis Shea. 2001. “The Power of Suggestion: Inertia in 401(k) Participation and Savings Behavior.” The Quarterly Journal of Eco-nomics 116(4): 1149-1187.
Munnell, Alicia H., Francesca Golub-Sass, and Anthony Webb. 2009. “The National Retirement Risk Index: After the Crash.” Issue in Brief 9-22. Chestnut Hill, MA: Center for Retirement Re-search at Boston College.
Munnell, Alicia H., Francesca Golub-Sass, and Dan Muldoon. 2009. “An Update on 401(k) Plans: Insights from the 2007 SCF.” Issue in Brief 9-5. Chestnut Hill, MA: Center for Retirement Re-search at Boston College.
Munnell, Alicia H. and Laura Quinby. 2009. “Pen-sion Coverage and Retirement Security.” Issue in Brief 9-26. Chestnut Hill, MA: Center for Retire-ment Research at Boston College.
Sanzenbacher, Geoffrey. 2006. “Estimating Pension Coverage Using Different Data Sets.” Issue in Brief 51. Chestnut Hill, MA: Center for Retirement Research at Boston College.
U.S. Bureau of Labor Statistics. Current Population Survey, 1980-2008. Washington, DC.
U.S. Census Bureau. Survey of Income and Program Participation, 2004 and 2007. Washington, DC.
The Center for Retirement Research at Boston Col-lege was established in 1998 through a grant from the Social Security Administration. The Center’s mission is to produce fi rst-class research and forge a strong link between the academic community and decision makers in the public and private sectors around an issue of critical importance to the nation’s future. To achieve this mission, the Center sponsors a wide variety of research projects, transmits new fi ndings to a broad audience, trains new scholars, and broadens access to valuable data sources. Since its inception, the Center has established a reputation as an authori-tative source of information on all major aspects of the retirement income debate.
The Brookings Institution
Massachusetts Institute of Technology Syracuse University
Urban Institute
Contact Information
Center for Retirement Research Boston College Hovey House 140 Commonwealth Avenue Chestnut Hill, MA 02467-3808 Phone: (617) 552-1762 Fax: (617) 552-0191 E-mail: [email protected] Website: http://www.bc.edu/crr© 2010, by Trustees of Boston College, Center for Retire-ment Research. All rights reserved. Short sections of text, not to exceed two paragraphs, may be quoted without ex-plicit permission provided that the authors are identifi ed and full credit, including copyright notice, is given to Trustees of Boston College, Center for Retirement Research.
The research reported herein was supported by the Center’s Partnership Program. The fi ndings and conclusions ex-pressed are solely those of the authors and do not represent the views or policy of the partners or the Center for Retire-ment Research at Boston College.
The Center for Retirement Research thanks AARP, Invesco AIM, Bank of America, ING, MetLife, Nationwide Mutual Insurance Company, Prudential Financial, State Street, TIAA-CREF Institute, and T. Rowe Price for support of this project.