Agricultural Expenditure and Poverty Alleviation in Nigeria
Lawrence Udofia* Nsikak EssangUniversity of Uyo, Uyo, Akwa Ibom State, Nigeria Abstract
Poverty in Nigeria is recognized as mostly rural phenomenon and agriculture has been highlighted as the sector that could best touch the poor as it is at the heart of the livelihoods of the rural people. Nigeria, popularly known as the giant of Africa and rich in numerous human and material resources, is seen to have greater part of its population living in abject poverty and this condition remains unacceptable at all levels. The main objective of this paper was to investigate the relationship between expenditure on agriculture and poverty alleviation in Nigeria. Time series data were used for the study from 1980 – 2012 sourced majorly from Central Bank publications and World Development Indicators. Findings show a clear but insignificant response of poverty reduction to agricultural growth. It was also found that the dismal performance of the sector is largely responsible for its insignificant positive impact on poverty. Policy recommendations include increase in government budgetary allocation to the sector as well as proper monitoring and constant review of policies/programmes in the agricultural sector of the economy.
Keywords: Poverty, Poverty Reduction, Poverty Alleviation, Agricultural Expenditure, Agricultural Growth 1. Introduction
The problem of poverty is as old as time in the development of human history and has grown in magnitude, transcending different continents of the world. In Nigeria and perhaps other under-developed countries, its growth in magnitude and latitude has attracted the attention of several international organizations, governmental and non-governmental agencies and scholars. Poverty and poverty alleviation have been the focus of numerous researches, discussions, debates and implementation programmes for over a decade now.
International agencies like World Bank, United Nations Development Programme (UNDP) have been focusing on poverty, its repercussion and remedies in underdeveloped nations. In 1989, the World Bank issued a report on the crisis of poverty in Africa in which it highlighted the gravity of the economic situation on the continent and specifically put forward diverse economic strategies to halt upward trend in poverty across Africa and bring about improvement in the economic conditions of the people in the sub- Saharan region of the world. Also, there was the declaration in 1996 by the United Nations as the international year for the eradication of poverty. Subsequently, there was the proclamation of the first United Nations Decade for the eradication of poverty, which was adopted by the United Nations General Assembly in its fifty-first session in the autumn of the year, 1996. The theme for the decade was that eradicating poverty is ethical, social, political and economic imperative to human kind. The inspiration for the proclamation of the decade has come from the World Summit on Social Development held in Copenhagen, Denmark, in 1995, in which countries indicated commitment to the global goal of poverty alleviation. Since then, several studies have ensued on the economic plight of Africa, including a call on African Governments to introduce major economic reforms in their countries to alleviate poverty (Aluko, 2003). Besides, poverty alleviation is one of the eight points of millennium development goals (MDGs) which were: eradication of extreme poverty and hunger; achievement of universal primary education (for combating illiteracy); promotion of gender equality and empowerment of women; reduction in child mortality; improvement in maternal health; combating HIV/AIDs, malaria and other diseases; ensuring environmental sustainability; developing a global partnership for development. However, each of the MDGs element resonates appropriately with the state of being poor (Umo, 2012).
In Nigeria, as a response to the above, several regimes (at local, state and federal levels) have committed itself to formulating and implementing extensive economic reform programmes. Some of these programmes have over time attracted international interest in terms of sponsorship, technical support as well as monitoring. This goes to show that government in Nigeria is deeply concerned about poverty level in the country.
Under the military regimes, some programmes were introduced viz, Better Life for Rural Women was a programme established in 1988 by the then First Lady, Hajia Mariam Babangida, as her pet project in the military regime of Gen. Babangida. It focused on rural women in rural areas. It aimed at boosting the economic activities of women in the rural areas through agricultural extension services, education and vocational training, cottage industries and food processing, primary health care delivery and enlightenment. Family Support Programme was initiated by another First Lady, Mrs. Mariam Abacha, in 1998 to replace the Better Life Programme of Mariam Babangida. It aimed at improving and sustaining family cohesion through the promotion of social and economic well-being of the Nigerian families. Furthermore, Directorate of Food, Roads and Rural Infrastructure (DFRRI)was established in 1986 under the regime of Gen Babangida to alleviate poverty through
the development of rural infrastructures. It was expected to provide basic amenities like access roads, rural electrification and potable water to ease the living conditions of the rural people (Lewu, 2011). Also, National Directorate of Employment (NDE) was launched in 1987 for the purpose of creating employment opportunities in form of self-employment and self-reliance aimed at poverty reduction among unemployed youths in rural and urban areas. Enterprise and Agriculture was introduced under the regime of Gen Babangida in 1989 for the employment of 62,000 graduates and non-graduates nation-wide as part of 166 extra-budgetary relief package by the federal government (ibid). Mass Mobilisation for Social Justice and Economic Reconstruction (MAMSER) was introduced in 1986 to mobilize and encourage the participation of grassroot people in development. Community Action Programme for Poverty Alleviation (CAPPA) was yet another Federal Government programme aimed at alleviating poverty. It was established in 1997 under the Military regime of Gen Abacha. Its objectives were to improve the living conditions of the poor through a targeted, cost-effective, demand-driven and promptly delivered programme. Family Economic Advancement Programme (FEAP) was introduced in 1993 as an investment promotion and poverty alleviation programme by the Federal Government. Aimed at stimulating appropriate economic activities nation-wide, it focused on the provision of loans to promote entrepreneurship and business opportunities
In 2001, National Poverty Eradication Programme (NAPEP) was introduced after examining the report of a committee set up to study the achievements of previous poverty alleviation programmes. NAPEP was introduced and situated in the office of the President. Subsequently, several schemes followed to make NAPEP realistic. These schemes are the Youth Empowerment Schemes (YES), Rural Infrastructures Development Scheme (RIDS), Social Welfare Services Schemes (SOWESS), and National Resources Development and Conservation Scheme (NRDCS). Furthermore, New Agricultural Policy Thrust (NAP) was adopted in 2001 and modified two years later. It articulates a vision of how agriculture can become an engine of growth and poverty reduction, identifies binding constraints to the realization of that vision, and proposes policies to overcome those constraints (FMARD, 2010). National Economic Empowerment and Development Strategy (NEEDS) was implemented in 2004 as Nigeria’s home grown poverty reduction strategy, emphasizing the importance of increasing agricultural production (Mogues and Morris, 2008). The results have been heterogeneous. In some cases, a modest growth has been achieved through the transition from a centrally-planned economic system to a market-based strategy. But in virtually all cases, the modest growth achieved has not translated into any significant improvement in poverty or better living standards both for the urban and rural dwellers.
Poverty, because of its multidimensional nature, does not lend itself to easy definition. In defining poverty, however, Robertson (1980) and Giddens (1996) argued that a distinction should be made between subsistence or absolute poverty and relative poverty. Robertson (1980) defined absolute poverty as lack of basic requirements to sustain a physically healthy existence, that is, sufficient food and shelter to make possible the physically efficient functioning of the body. According to Nobbs (1984), relative poverty is the relative deprivation which people suffer from when or because they are unable to enjoy things, which the majority of the people in that particular society enjoy. Again, Chamber (1995) defines poverty as the lack of physical necessities, assets and income. Comprehensively, according to World Bank (2010), poverty is pronounced deprivation in well-being, and comprises many dimensions. It includes low incomes and the inability to acquire the basic goods and services necessary for survival with dignity. Poverty also encompasses low levels of health and education, poor access to clean water and sanitation, inadequate physical and security, lack of voice and insufficient capacity and opportunity to better one’s life. Invariably, poverty has both income and non-income dimensions.
According to World Bank (1990), the poor are those living below 1.25 dollars per day, taking into consideration the Purchasing Power Parity (PPP). To Obadan (1997), the poor are those who are unable to obtain an adequate income, find a stable job, own property or described the poor as those who have no access to the basic necessities of life such as food, clothing and shelter, are unable to meet social, economic and political obligations.
According to Umo (2012), 35 African countries were classified as Less Income Countries (LICs) by the World Bank; while 12 were classified as Middle Income Countries (MIDs); and only 7 were classified as Upper income Countries (UICs). Thus, about 47 African countries or 89% of the continent belong in the LIC/MIC group, and hence can be considered poor. None could come under the Higher Income Countries (HICs) group. The approximation is that about 90% of Africa is poor in per capita terms with Nigeria inclusive.
When we consider the figures for income distribution, it shows that there is far greater income inequality in Nigeria. In Nigeria, the highest 10 percent earn more than 40 percent of the gross income with a balance of 60 percent going to 90 percent of the population. In fact, the lowest 10 percent earn about 1 percent of the total income (Aluko, 2003).
Poverty has a range of sociological implication both for the individual and the society at large. Poverty is anti-development. Poverty is man’s most powerful and massive affliction. It is the progenitor of much pain ranging from ignorance, hunger, disease to society and civil conflict. It is divisive and is one of the sources of
political instability and social disorder. Conflicts erupt when people have no jobs, food and shelter. Sometimes such conflict occurs because of fear of unemployment or perceived social injustice and deprivation (Nick, 1998; Aluko, 1999; NHDR, 1996, 1998). To Quinney (1980), crime is a direct product of poverty. According to Environmental Rights Action (ERA) findings in 1998, poverty also leads to social and environmental degradation. Poor people can hardly be expected to care about their environment as they are persistently faced with the constant battle for survival. Hence the filth which persists in Nigerian towns and cities despite the monthly environmental exercise in some states is simply ignored by the vast majority of the poor. Furthermore, poverty has also been known to force women into situations in which they are vulnerable to various forms of exploitation such as early marriage, teenage pregnancy and health complications.
With the fact that the nation’s population is growing, poverty in Nigeria remains significant despite the fact that the Nigerian economy is growing. According to UNICEF (2014), one in every five Africans is a Nigerian, and 70.8% of Nigeria population is living on less than one dollar a day. While economic growth is necessary for the country’s development, it does not automatically impact poverty alleviation because of this issue of population. The increasing rate of poverty in Nigeria points to an urgent need for strategies that better target the areas where the poor people live and the activities on which their lives depend.
According to Anyanwu (1997), agriculture employs more than 80 percent of labour force in rural population and 57 percent of total labour force in Nigeria as at 1992. With this, a successful strategy for poverty alleviation must begin by recognizing the fact that poverty is mostly a rural phenomenon and that agriculture is at the heart of the livelihood of rural people. According to World Bank Report as cited in Umo (2012), agriculture is a strong option for spurring growth, overcoming poverty and enhancing food security in Sub Saharan Africa. At present, agriculture is the fastest growing sub-sector in the overall non-oil sector contributing 4.5% of non-oil sector’s growth in 2001 and 6.8% in 2005 (Umo, 2012). Agriculture contributed about 42% of the GDP in 2007 (NBS, 2010). The importance of agriculture in reducing poverty in Nigeria comes from these facts as articulated in Grewal and Ahmed (2011):
i) The incidence of poverty is inappropriately high in the country which still relies heavily on agriculture for employment and income generation.
ii) The poorest households typically rely more on agriculture for farming and employment.
iii) Because the poor have few assets and skills other than manual labour to sell, they generally face many obstacles in connecting with non-agricultural economy for jobs, agricultural growth can provide them jobs where they live.
Further relationship between agriculture and poverty alleviation as articulated by Department for International Development (DFID) (2004) is that different rates of poverty reduction over the past 40 years have been closely related to differences in agricultural performance and commitment to agriculture.
The impact of agriculture in alleviating poverty depends on the interaction of several effects which goes far beyond its direct impact on farmer’s incomes. There are the indirect contributions that agricultural sector makes to the growth of the rest of the economy which are based on the demand for its products in the market which comprises non-agricultural sector.
THE PROBLEM
Sub-Saharan Africa has been noted for the prevalence of poverty for more than a decade now despite the abundance of both human and material resources in this region. Poverty in countries of this region is massive, pervasive and chronic, engulfing a large proportion of the society. The concern about poverty in most of these countries, including Nigeria, has been very tremendous. Resulting from large-scale poverty, human conditions in Nigeria have greatly deteriorated. Real disposable incomes have dwindled while malnutrition rates are on the increase (Aluko, 2003).
For most Nigerians, poverty is endemic, real and devastating to the extent that it has become a walking being in urban and rural streets of the country. For a large percentage of the population, there is no food, housing, health, and security. Life in Nigeria involves a daily struggle against inhumanity by man, hunger and inadequate housing and health facilities. By 1998, estimates of the Nigerian Human Development Report (NHDR) put the number of Nigerians living in poverty at 48.5%. Between 1980 and the 1990, Nigerian experience worsened as the incidence of poverty rose from 46.3% of the population in 1985 to 65.6% in 1996. The vast majority of the people have little or no access to the social amenities. In Nigeria, there is no social welfare network to ameliorate the condition of the poor. The poor depend largely and mostly on relations and friends for a bit of sustenance.
Poverty in Nigeria is a major macroeconomic problem which has assumed an endemic height. Programmes to eradicate poverty include and are not limited to deliberate industrialization, agricultural investment and intensification by government and the private sector, small scale industries, development and investment in education.
subsisting. Some of the factors responsible for this lie in the nature of the socio-political and economic structures, which alienate and exclude the poor from decisions making/implementation affecting their welfare. Programmes are imposed from the top, with huge overheads, which favour contractors, consultants and the cronies of those in power. The politicization of policies aimed at poverty reduction and the interplay of corrupt practices have often led to the displacement of goals and the objectives of programmes designed to reduce the incidence of poverty. Coupled with this is the problem of political instability, the rapid turnover of programmes of action and office holders, leading to the truncation of programmes and unnecessary duplication and waste (Aluko, 2003).
Agriculture, as the mainstay of the Nigerian economy, employs approximately two-third of the country’s total labour force and provides a livelihood for about 90% of the rural population (IFAD, 2010). This is why it has been highlighted as the sector that could best touch the poor as the sector is in the rural population of the country- the poverty base. Yet various agricultural programmes implemented have not yielded the desired result of generating and creating the platform for poverty reduction.
2.0 REVIEW OF RELATED LITERATURE
The role of agriculture in poverty alleviation has attracted the attention of economists, generating an enormous literature of both theoretical and empirical literature. Nevertheless, this work will offer a survey of relevant literature, including theory and empirical studies as well as review of federal government agricultural expenditure and agricultural output and other issues bordering on the subject matter.
2.1 THEORETICAL ISSUES ON POVERTY 2.1.1 The Measurement of Poverty
A poverty measure is an index that shows the magnitude of poverty in a society. The ability to distinguish between the poor and the non-poor requires an objective measurement of poverty. In quantifying poverty, the practice is to first of all specify some measure of the standard of living (both the direct consumption aspects and the basic needs/non-consumption aspect) in order to distinguish different individuals, households and countries from each other, and secondly, to establish or choose a ‘cut off’ (that is the poverty line), which separates those identified as poor from the non-poor (Ekpo and Uwatt, 2005).
Initial attempts at measuring poverty were by both Rowntree and Naoroji as noted by Ogwumike(2001). These initial attempts were attempted to identify the poverty lines, hence poverty profile and indicators were introduced at a later period. Apparently, no single indicator can measure adequately all diversions of the hardship people face in poverty (ibid).
The World Bank (1993) highlighted three key issues to be considered in poverty measurement. First, is the yardstick to be used in determining living standard and assessing who is poor and who is not? Second, drawing the poverty line, that is the cut-off living standard level below which a person is classified as poor and counting the people whose income is below the line. The third deals with the measurement of the depth and severity of poverty. Once the poverty line is established, several indices are used to measure the incidence, depth and severity of poverty. For example, the head count index, which is defined as the proportion of the population whose measured standard of living (consumption) is less than the poverty line. It captures the incidence of poverty as it is insensitive to difference between individuals. The poverty gap index also captures the degree of income shortfall below the poverty line while indicating poverty depth. Physical quality of life index measure uses qualitative measures of social well-being rather than income per-capita to determine the quality of life. This is defined as the average of relative indices of infant mortality, life expectancy and literacy but not income disparity. The human development index measures the relative extent of deprivation in a country compared to the global standard, incorporating both income and non-income factors (UNDP, 1990). Generally, the human development index is a simple average of three relative deprivation indices, viz, longevity represented by life expectancy; knowledge, a weighted average of literacy rate and mean years of schooling index, and income, computed using per capita income data. Engel’s law of poverty as reported by Ruggles (1990) states that any household that spends more than the specified maximum share of their income on basic needs such as food, housing, healthcare, education, clothing etc is considered poor. Specifically, the law states that if food share of any household income rises beyond 20%, then the household has become poorer and hence the living condition has worsened. This measure is absolutely smaller than the World Bank whose measure assumes that any household that spends two-third (i.e.66%) of her income on basic necessities is poor.
2.2 POVERTY PROFILE IN NIGERIA Table 2.1 Poverty Headcount from 1980-2012
Year Poverty Level Estimated Population (Million) Population in Poverty (Million)
1980 27.23 65 17.1 1985 46.3 75 34.7 1992 42.7 91.5 39.2 1996 65.6 102.3 67.1 2004 54.4 126.3 68.7 2010 69.0 163 112.47 2011 71.5 168 124.1 2012 72 168 128.3 Source: NBS, 2012
According to Obadan (1997), more than one billion people in the developing world continue to live in absolute poverty. The World Development Report 1990 estimates that this is the number of people who are struggling to survive on less than US$370 a year or a dollar a day. Poverty is highly visible in most African countries. Overcrowded settlements in major urban areas without basic social services and remote and isolated rural areas are major concentrations of the poor.
Considering the case of Nigeria, it has been observed that there was a decline in the incidence of poverty from 46.3% in 1985 to 42.7% in 1992. This was largely attributed to the significant recovery of the economy which led to higher incomes, higher households’ expenditure and real gains to a large part of the population (World Bank, 1996). The decline notwithstanding, the incidence of poverty is still on the increase as depicted in the graphs below. Adawo (2011), has it that from 1993 to 2002 the figures have been increasing and reached all-time high in 2002 with 70%. It was noted that when these percentages are translated into figures, the number of poor in Nigeria is frightening.
FIGURE 2.1 POVERTY INCIDENCE IN NIGERIA
0 10 20 30 40 50 60 70 80 1 9 8 0 1 9 8 2 1 9 8 4 1 9 8 6 1 9 8 8 1 9 9 0 1 9 9 2 1 9 9 4 1 9 9 6 1 9 9 8 2 0 0 0 2 0 0 2 2 0 0 4 2 0 0 6 2 0 0 8 2 0 1 0 2 0 1 2
POVLEV
POVLEV POVLEV=Poverty Level SOURCE: RESEARCHERS, FROM THE DATA USED FOR THIS WORKFIGURE 2.2 ESTIMATED POPULATION AND POVERTY INCIDENCE
POP 0 50 100 150 200 1 3 5 7 9 11 13 1517 19 21 23 25 27 29 31 33 POP POVLEV POP=Population SOURCE: RESEARCHER, FROM THE DATA USED FOR THIS WORK
According to Ekong and Onye (2014), in 2013, the Department for International Development (DFID) report posits that “Nigeria is well-developed country, and with plenty of natural resources such as oil. However, it retains a high level of poverty, with 63% living below $1 daily”. This has manifested in a situation where the share of the national income held by the richest 10% at 41% of national income is more 10 times the share of the national income held by the poorest 20% at only a merely 4.4% of the national income. It is little wonder that a country with more than 112 million people living in poverty boasts 8 of Africa’s 15 richest billionaires. Table 2.2 further shows the poverty profile in the country.
Table 2.2 Percentage of Population below Poverty Line
S/N Year Value (%) 1 1992 34.1 2 2000 60 3 2004 70 4 2011 71 5 2012 76.4
Source: Ekong and Onye, 2014; Researchers’ computation
The profile of poverty kept rising since the implementation of SAP in Nigeria. Table 2.2 shows that from 34.1% of the total population of Nigeria living in poverty in 1992, it leapt to 60% in 2000. The population below poverty line further increased to 70% in 2004; 71% in 2011 and 76.4% in 2012.
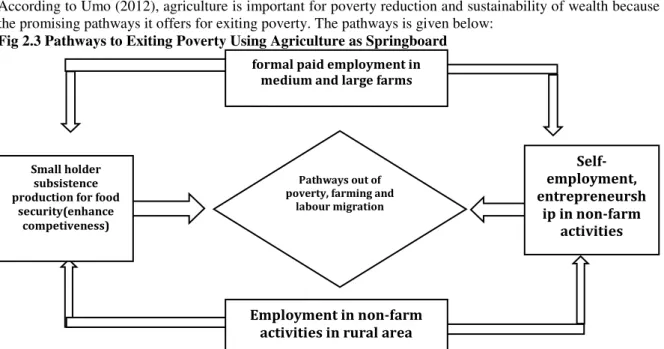
2.3 ROUTES TO POVERTY ESCAPE USING AGRICULTURE AS A SPRINGBOARD
According to Umo (2012), agriculture is important for poverty reduction and sustainability of wealth because of the promising pathways it offers for exiting poverty. The pathways is given below:
Fig 2.3 Pathways to Exiting Poverty Using Agriculture as Springboard
Source: Umo, 2012
A focus on these can be summarized in what has been described as “Policy Diamond” by the World Bank (2014). As the figure depicts, there are four feasible pathways for fighting poverty using agriculture as platform. The diamond at the center guarantees labour mobility and migration resulting in:
(a) Self-employment and entrepreneurship in agricultural pursuits: (b) Small holder subsistence farming for food security;
(c) Offer of formal/paid employment in medium to large farm enterprises; and (d) Engagement in non-farm activities within the rural area.
2.4 EMPIRICAL REVIEW OF THE RELATIONSHIP BETWEEN AGRICULTURAL GROWTH AND POVERTY
Cervantes-Godoy and Dewbre (2010) undertook detailed examination of the importance of agricultural growth in poverty reduction in a sample of 25 countries that are selected on the basis of three criteria; (a) high initial rate of more than 10% poverty at USD 2 per day; (b) reductions in poverty rate in every year within 1980-2005 range; and (c) availability of at least two years of survey data for calculating trends. As a result of these criteria, India and South Africa were excluded from the study, while China, Indonesia and Vietnam were included. The authors found that in comparison with the rest of the economy, agriculture appears especially powerful in lifting the
Pathways out of poverty, farming and
labour migration
Employment in non-farm activities in rural area formal paid employment in
medium and large farms
Self-employment, entrepreneursh ip in non-farm activities Small holder subsistence production for food
security(enhance competiveness)
poorer groups out of poverty, though its comparative edge declines substantially when it comes to those close to the $2 per day poverty line. The key finding of their paper is that growth in agriculture plays the leading role in reduction of extreme poverty, but non-agricultural growth is more powerful in reducing poverty among the well-off poor (i.e. in reducing the $2 per day poverty headcount). The dominance of agriculture in reducing extreme poverty declines, however, as countries become richer and as incomes inequality decreases. Non-agricultural growth originating in the extraction industry has lesser effect on poverty reduction with the result that agriculture is usually more powerful in reducing poverty, especially extreme poverty in resource rich countries. Even in resource poor countries (where the extraction industry makes up less than 10% of GDP), non-agricultural growth is found to be more powerful in reducing poverty among the better-off poor.
Of particular interest to this study is the finding that during 1980-2005, non agricultural growth made the largest contribution to poverty reduction in China and Vietnam, where as agricultural growth made the largest contribution in Indonesia. The finding by Cervantes-Godoy and Dewbre (2010) about China is in contrast to the results obtained by Ravallion and Chen (2007), who had found that over the period 1980-2001, the impact of the primary sector on headcount poverty reduction was 3.5 times higher than the impact of either the secondary sector or the tertiary sector. They estimated poverty elasticity of growth in China at 7.85 for agriculture and -2.25 for non-agricultural economy. Similarly, their findings also contradict the findings by Suryahadi, etal (2009) that urban services were the most important factor in poverty reduction in Indonesia.
Cervantes-Godoy and Dewbre (2010) disaggregated the overall income sources into agricultural GDP per worker, non-agricultural GDP per worker and remittances per capita, and calculated how much of the predicted change in poverty could be attributed to changes in each of the above sources. The paper found that more than 52% of the average poverty reduction in 12 of the 25 countries studies was due to agricultural growth, while remittances contributed to 35% of the reduction and the rest was due to non-agricultural growth.
A number of other recent studies also support the above findings. For example, using the provincial panel data analysis of China, Motalvo and Ravallion (2010) observed that productivity and growth in agriculture improves social welfare and is vital to poverty reduction. They concluded that growth in primary sector and not necessarily growth in the secondary or tertiary sectors, has contributed to a greater part in China’s success against absolute poverty. Bresciani and Valdes (2007) also noted that agricultural sector growth has a higher multiplier effect due to its multi-functional nature and has been important strategy for countries that have rapid success in poverty reduction so far.
Motalvo and Ravallion (2010) argued that ‘far larger reductions in poverty could have been possible if the same growth rate was more even across sectors and areas’. Thus, it is noted that China was able to put more priority on agriculture and rural development which were seen as essential in lifting masses out of poverty.
To shed light on the determinants of poverty dynamics in China using sub-national data for the period 1983-2001, Motalvo and Ravallion (2010) found that an increase in GDP in the primary sector has significant poverty reducing effects (with elasticity of around -2.23), re-affirming the argument that growth in the agricultural sector is the key to fighting poverty. In a similar study but in the context of India, Ravallion and Datt (2002) had shown that marked growth in the primary sector (agriculture) was, on average, more poverty reducing compared to secondary (manufacturing) and tertiary (services) sectors.
In a cross country regression analysis involving many poorer developing countries, Irz et al (2001) revealed that, on average, every 1% increase in agricultural productivity reduces percentage of people living on less than a dollar a day by between 0.6 and 1.3%. This research notes that while agricultural growth stimulates the creation of non-farm rural and urban employment, no other sector had such a stronger impact on poverty reduction, benefiting the poor.
In a study of the relationship between output growth and poverty in more than 50 countries, Loayza and Raddatz (2010) found that the composition of growth in terms of intensive use of unskilled labour, the kind of input that the poor can offer to the production process, matters significantly for poverty reduction. Sectors that are more labour intensive (in relation to their size) tend to have stronger effects on poverty alleviation. They found that agriculture is the most poverty reducing sector, followed by construction and manufacturing, while mining, utilities and services by themselves do not seem to help poverty reduction.
Ravallion and Datt (1996) also found that growth in agriculture and rural economy had been highly beneficial to reducing poverty in India. In a subsequent study, Ravalliona and Datt (2002) found that higher farm yields, higher state development spending, higher non-farm output and lower inflation were all poverty reducing in India. Differences in the rates of farm output growth mattered most for the poor and sectoral composition of growth was more important for poverty reduction in those states that had poor initial conditions. Non-farm growth was less effective in reducing poverty in these states.
Suryahadi et el (2009) found that in Indonesia, growth in agriculture has been an important factor in reducing rural poverty in Indonesia, although growth in urban services has played a more significant role. They explained that urban services have benefited the rural poor, because these services are highly labour intensive and require low skills and low initial capital investment.
De Janvry and Sadoulet (2010) found that labour productivity gains in agriculture (measured by the value added per worker) were large in East Asia during 1993 to 2002 when rural poverty rates also fell sharply. They found that agriculture productivity has much larger positive effect than other sectors on poverty reduction in developing countries of sub-Saharan Africa and South Asia, but not so in Latin America and the Caribbean. For example, elasticity of poverty reduction of agriculture is reported to be -1.2 in China and India, but only -0.3 in Brazil. In Latin America and the Caribbean, agricultural productivity gains were driven by capital and thereby created fewer employment opportunities. De Janvry and Sadoulet (2010) estimated that when both direct and indirect effects of agriculture and non-agricultural sectors are considered, 1% growth in agriculture induces a 2.24% reduction in poverty. In comparison, 1% growth in all non-agricultural sectors taken together produces an overall poverty reduction of 2.85%.
Despite these major roles agriculture plays, Hasan and Quibria (2004) cautioned against what they call the misplaced ‘agricultural fundamentalism’, or the argument that agricultural growth always lead to more rapid poverty reduction, because they also found that while agriculture was the most effective in poverty reduction in South Asia and sub-Saharan Africa, poverty reduction in East Asia resulted more from the industrial sector and in Latin America from the services sector. In the study of 15 Asian countries by Habito (2009), Habito analyzed sectoral contribution to poverty in two stages, first by using pair-wise correlations and then by using multiple regression equation. The pair-wise correlations revealed only weak evidence of any systematic relationship between sectoral growth and poverty reduction, especially for agriculture and services. However, when using multiple regression equations, Habito (2009) found that:
‘…the joint effect of agriculture-driven growth, good governance, and social expenditures by the government appear to well explain the variation in poverty elasticity of growth across Asian countries. Contrary to the puzzling results obtained under pair-wise correlation analysis, agriculture’s role this time emerges as a significant determinant of the poverty elasticity of growth, in the expected direction.
Similarly, when South-East Asian countries were examined by Habito individually, manufacturing sector was found to have played a more important role as a driver of employment and poverty reduction, especially in recent years. This contradicts the findings of Hasan and Quibria (2004) noted above, suggesting that possibly the aggregation of large number of disparate countries into a single group may provide misleading information about the key drivers of poverty reduction. It is also possible that because Habito’s study covers the more recent period of 2000-2006 that was not covered by Hassan et al, Habito may have found a shift favouring the role of manufacturing in the South-East Asian countries.
These contrasting observations underscore the fact that results of empirical studies can vary between countries and regions and depend crucially on the methodologies used.
2.5 REVIEW OF FEDERAL GOVERNMENT AGRICULTURAL EXPENDITURE AND AGRICULTURAL OUTPUT IN NIGERIA.
The saying that ‘agriculture is the mainstay of the Nigerian economy’ may have become a cliché. It nevertheless underscores the emphasis placed on agriculture as the engine of growth in the Nigerian economy. Abayomi (1997) noted that stagnation in agriculture is the principal explanation for poor economic performance, while rising agricultural productivity has been the most important concomitant of successful industrialization.
Conceptually, agriculture is the production of food, feed, fiber and other foods by the systematic growing and harvesting of plants and animals. It is the science of making use of the land to raise plants and animals. It is the simplification of nature’s food web and the rechanneling of energy for human, planting and animal consumption (Akinboyo, 2008).
Budgetary allocations play an important role in development process of any country. Budgetary allocations to public sector are usually recorded as capital expenditure and recurrent expenditure. The Central Bank of Nigeria (CBN) (2003) defined expenditure as an outflow of resources from government to other sectors of the economy whether requited or unrequited. Capital expenditures are payments for non-financial assets used in production process for more than one year while recurrent expenditure are payments for non-repayable transactions within one year.
There have been many studies of the relationship between government expenditure and economic growth. Some of these have looked specifically at the link between government spending and agricultural growth and poverty reduction (Fan et al., 2000a, b). These studies show positive growth and poverty reduction effects from public spending in agriculture. Yet, in the majority of developing countries aid and public expenditure to agriculture is stagnant or declining. This is especially true of Nigeria.
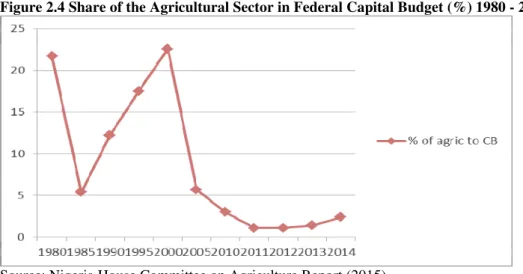
Oluwa and Oluwa (2013) have it that between 1985-2005, the highest percentage allocation of 3.40% was in 1999 while the least of 0.5% was in 1985 and 2003. On the overall, the years 1999 and above had higher percentages of budgetary allocation to agriculture than the years before. This implies that Nigeria did not meet the FAO and AU recommendation of 25 and 10% respectively. Perhaps this is partly responsible for the low
performance of agriculture and high poverty level in the rural areas since the country’s agriculture is rural based. Percentage budget allocation to agriculture in 1985, 1992, 1996 and 2004 was 0.5, 0.5, 0.9 and 3.0 respectively. This is in contrast to the Maputo Declaration (2003) where the Heads of States of the Assembly of the African Union committed (2003) their support to the Comprehensive Africa Agriculture Development Programme (CAADP) and pledged to raise spending on agriculture to 10% of the budget within the next five years, by 2008. Also, at the second ordinary assembly of the African Union in Maputo in July 2003, African Heads of States and Governments endorsed the ‘Maputo Declaration on Agriculture and Food Security in Africa’.
This declaration came upon the recognition of the pivotal role of agriculture in the quest for good life and wealth creation, as one good way of addressing poverty and its attendant consequences is through agriculture (FMARD, 2010). The declaration contained several important decisions regarding agriculture, which included the commitment to the allocation of at least 10% of national budgetary resources to agriculture and rural development policy implementation within five years. Though this fell short of the 25% recommendation of Food and Agricultural Organisation (FMARD, 2010). The result of the unstable expenditure on the agricultural sector by the government of Nigeria over the years is a dismal performance of the sector. This is reflected in the figure below;
Figure 2.4 Share of the Agricultural Sector in Federal Capital Budget (%) 1980 - 2014
Source: Nigeria House Committee on Agriculture Report (2015)
3.0 MODEL SPECIFICATION AND THEORETICAL JUSTIFICATION OF THE MODEL
The model adopted in this study is based on the Keynesian macro economic framework which assumes that any increase in government expenditure has positive and significant impact on economic growth and by implication on the level of poverty. Based on this, the work adopts Sunkanmi and Abayomi (2014) public expenditure – poverty conceptual framework that assumes that public expenditure has impacts on poverty level. Moreover, according to Fan etal, (2002), public expenditure on education and agricultural sector has significant impact on poverty reduction, hence;
POV = f(GEE) ……….(1) Where: POV represents poverty level; and
GEE represents government expenditure on education.
As noted by Umo (2012), education would confer on the poor, the ability to know and master the environment within which he/she lives, and it will equip him/her with the skills to find livelihood, as such, live above poverty line. Finding livelihood can be referred to finding sustainable employment. Because of a direct inverse relationship between employment and unemployment, the relationship between employment and poverty can also be inversely stated as the relationship between poverty and unemployment. Hence;
POV = f(UNEM) ………..(2) Where: UNEM represents the level of unemployment.
According to Umo (2012), agriculture is a strong option for spurring growth, overcoming poverty and enhancing food security. Expenditure on agriculture would not simply reduce poverty unless agricultural output is increased. Hence;
AGOUT = f(GEA)………..(3) POV = f(AGOUT)………..(4) Where: AGOUT represents agricultural output; and
GEA represents government expenditure on agriculture.
As noted by Todaro and Smith (2009), because the growth in food supplies could not keep pace with the burgeoning population, per capita income would have a tendency to fall, as a consequence, the tendency of poverty level to increase. Hence;
POV =f(POP) ………(5) Where: POP represents population
Furthermore, according to Chambers (1995), poverty exists when there is lack of basic necessities, assets and income. Basic necessity is a generic term used to represent clothing, shelter, infrastructure, etc. According to Umo (2012), an existence or the provision of efficient infrastructure promotes economic growth, and growth in turn helps in reducing poverty. An example of infrastructure is electricity. Using electricity consumption per capita (consumption of electricity per head by the populace) as a proxy of access to infrastructure, we can state the relationship as thus;
POV = f(ELCON) ………(6)
Where: ELCON represents electricity consumption per capita
However, it is pertinent to elaborate more on what can stimulate agriculture so as to effect the relationship we have in equation (4). According to Abedullah etal (2009), easy and cheap credit is the quickest way for boosting agricultural production. Siddiqi and Kishwar (2004) reported that flow of credit to farmers had increased demand for inputs to increase crop production. Hence, we can specify the relationship between agricultural output (AGOUT) and credit to agriculture (AGCR) as;
AGOUT = f(AGCR) ………(7) Bringing in other variables into equation (7), we have; AGOUT = f(AGCR, AIV, AEV) ………(8) Where: AIV represents agricultural imports value; and
AEV represents agricultural exports value
Agricultural export and import values are introduced in the model based on the observations of Nwibo (2012) that an increase in importation of agricultural products discourage domestic production, while increase in exportations is achieved by increasing agricultural output. Thus, from equations (3), (7) and (8) we can present model I. Also, from equations (1), (2), (4), (5) and (6) we can present model II.
The functional form of the models is written as; MODEL I:
AGOUT = F(GEA, AIV, AEV, AGCR) MODEL II:
POV = F(POP, UNEM, GEE, AGOUT, ELCON) The nomenclature in the model is as follows:
POV = Poverty Incidence in Nigeria (interpolated from existing figures) POP = Population
UNEM = Reduction in unemployment (labour force minus percentage change in labour force) GEE = Government Expenditure on Education
AGOUT = Agricultural output proxied by agricultural contribution to GDP at current basic prices ELCON = Electricity consumption per capita
GEA = Government Agricultural Expenditure proxied by budgetary allocation to agriculture AIV = Agricultural Import Value
AEV = Agricultural Export Value AGCR = Agricultural Credit Facilities
The mathematical form of the models is specified as follows; MODEL I:
AGOUT = Bo + B1 GEA + B2 AIV + B3 AEV +B4AGCR MODEL II:
POV = Ao + A1 POP + A2 UNEM + A3 GEE + A4 AGOUT + A5 ELCON
The econometric form of the model is given as; MODEL I:
AGOUT = Bo + B1 InGEA + B2 InAIV + B3 InAEV +B4 InAGCR + Ut. MODEL II:
POV = Ao + A1 In POP + A2 InUNEM + A3 InGEE + A4 InAGOUT + A5 InELCON + Ut.
4.0 MODEL DIAGNOSTIC RESULTS
The results from the test of the time series properties of the data (unit root test), the test of cointegration properties of the model, the multicollinearity test, autocorrelation test, normality test and heteroscedasticity test are presented in this section.
4.1 RESULT OF TIME SERIES PROPERTIES OF THE DATA
Since standard inference procedure does not apply to regression that contains non-stationary time series. Therefore, it is crucial to get the prerequisite stage of unit-root testing right. Hence, we carried out a battery of unit root tests in order to arrive at firm conclusions concerning the integration properties of the time series used in the model.
We applied the Augmented Dickey Fuller (ADF) test for unit root on all the data series, adopting the 5% significance level for the ADF critical tau value to test the hypothesis of unit root. We present the summary of the stationarity test in table 4.1 below:
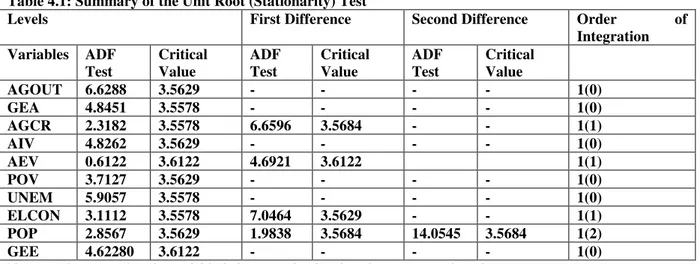
Table 4.1: Summary of the Unit Root (Stationarity) Test
Levels First Difference Second Difference Order of
Integration Variables ADF Test Critical Value ADF Test Critical Value ADF Test Critical Value AGOUT 6.6288 3.5629 - - - - 1(0) GEA 4.8451 3.5578 - - - - 1(0) AGCR 2.3182 3.5578 6.6596 3.5684 - - 1(1) AIV 4.8262 3.5629 - - - - 1(0) AEV 0.6122 3.6122 4.6921 3.6122 1(1) POV 3.7127 3.5629 - - - - 1(0) UNEM 5.9057 3.5578 - - - - 1(0) ELCON 3.1112 3.5578 7.0464 3.5629 - - 1(1) POP 2.8567 3.5629 1.9838 3.5684 14.0545 3.5684 1(2) GEE 4.62280 3.6122 - - - - 1(0)
Note: 1(0) means that the variable is integrated at level or does not contain unit root. 1(1) means the variable is integrated at first differencing.
1(2) means the variable is integrated at second differencing.
From the result of our test, we can observe that Agricultural Output (AGOUT), Poverty Incidence (POV), Agricultural Import Value (AIV), Reduction in Unemployment (UNEM), Government Expenditure on Education (GEE) and Government Expenditure on Agriculture (GEA) are stationary at level. This means that it has mean and variance that is constant over time (Gujarati 2006: 797). The remaining variables – Electricity Consumption per capita (ELCON), Agricultural Export Value (AEV), Agricultural Credit Facility (AGCR) and Population (POP) were found to exhibit random walk (non-stationary) at levels. This implies that at level, the ADF test returned results that led to the acceptance of the hypothesis of unit root (Ho: ϴ = 0) at the 5 % level of significance except for AGOUT, POV, GEE, UNEM, GEA and AIV. When the series were differenced, the ADF test was unable to accept the hypothesis (Ho: ϴ = 0) of unit root for POP, ELCON, AEV and AGCR, implying that these variable became stationary after differencing.
It can be observed that the equations did not satisfy the time series assumption of regression analysis (that is, not all variables are stationary). We, therefore, went further to test whether the variables are cointegrated.
Table 4.2: Summary of the Cointegration Test
Variables ADF Statistic 5% Critical Level Order of Integration Conclusion
Residual I 6.319594 3.603202 1(0) Stationary
Residual II 3.760811 3.58063 1(0) Stationary
Note: Residual I is for equation I and Residual II for equation II
3.760811 respectively while the Mckinnon critical values are 3.603202 and 3.58063 respectively. Since the test statistic 6.319594 > 3.603202 and 3.760811 > 3.58063, we conclude that the residuals for the regression of equations (I) and (2) have no unit root. It is stationary at level (Gujarati 2006: 823). Although some of the variables in equations (1) and (2) exhibit random walk, their linear combinations are stationary, thus, consistent with the notion of the existence of a long run equilibrium relationship between the variables.
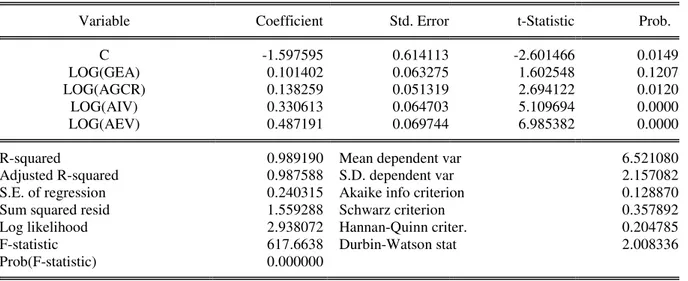
Table 4.3 Regression result for equation I Dependent Variable: LOG(AGOUT)
Variable Coefficient Std. Error t-Statistic Prob.
C -1.597595 0.614113 -2.601466 0.0149
LOG(GEA) 0.101402 0.063275 1.602548 0.1207
LOG(AGCR) 0.138259 0.051319 2.694122 0.0120
LOG(AIV) 0.330613 0.064703 5.109694 0.0000
LOG(AEV) 0.487191 0.069744 6.985382 0.0000
R-squared 0.989190 Mean dependent var 6.521080
Adjusted R-squared 0.987588 S.D. dependent var 2.157082 S.E. of regression 0.240315 Akaike info criterion 0.128870
Sum squared resid 1.559288 Schwarz criterion 0.357892
Log likelihood 2.938072 Hannan-Quinn criter. 0.204785
F-statistic 617.6638 Durbin-Watson stat 2.008336
Prob(F-statistic) 0.000000
Table 4.4 Regression result for equation II Dependent Variable: POV
Variable Coefficient Std. Error t-Statistic Prob.
C 17.29069 10.54905 1.639075 0.1137 AGOUT(-1) -0.001620 0.001932 -0.838333 0.4098 UNEM -0.674310 1.067803 -0.631492 0.5335 ELCON -0.180698 0.064684 -2.793535 0.0099 POP 0.815250 0.455743 1.788839 0.0858 LOG(GEE(-1)) -0.249875 1.992325 -0.125419 0.9012
R-squared 0.831658 Mean dependent var 54.74161
Adjusted R-squared 0.797990 S.D. dependent var 10.26049 S.E. of regression 4.611634 Akaike info criterion 6.067027
Sum squared resid 531.6793 Schwarz criterion 6.344573
Log likelihood -88.03892 Hannan-Quinn criter. 6.157500
F-statistic 24.70144 Durbin-Watson stat 0.611329
Prob(F-statistic) 0.000000
Variables are significant at 5%
4.2 DISCUSSION OF RESULTS, POLICY IMPLICATIONS AND RECOMMENDATIONS
From table 4.3, we can observe that government agricultural expenditure (GEA), agricultural credit facility (AGCR) and agricultural export (AEV) are positively related to agricultural output. This means that increase in these variables will lead to increase in agricultural output. Agricultural import (AIV) is positively signed. The result connotes that 100% increase in agricultural import (AIV) will increase agricultural output by 33.0613%. This is not surprising as Nigeria importation of agricultural products are increasing despite various efforts targeted at increase in agricultural output.
Statistically, all the variables are significant at the 5% significance level except for government agricultural expenditure (GEA). Our t-table value is 2.042 and our t statistics for agricultural credit facility (AGCR), agricultural import (AIV), and agricultural export (AEV) are 2.694, 5.1097 and 6.985 respectively.
Since tcal > ttab, we conclude that the coefficients of the variables are statistically significant. From the value of the R2, it can be seen that the variables GEA, AGCR, AIV and AEV explain over 90% of the systematic variations in agricultural output during the period 1980-2012. Hence, a close examination of the estimated equation confirms that the value of R2 which stood at 99% shows that only an infinitesimal variation of 1% is left unexplained, hence captured by the error term. The F statistic which is test of the existence of a significant relationship between the explanatory variables taken together and the dependent variable, shows that the whole regression equation is statistically significant. The F value of 617.6638 is highly significant, easily passing the significance test at the 5% level, being that our table value is 2.49. The cointegration results in table 4.2 above provide evidence for the existence of long run relationship among the variables in equation I. The error of prediction is minimized at the ratio of the standard error of regression to the mean of the dependent variable which indicates a good predictive ability and this further shed light on the goodness of fit of the estimated equation. The Durbin Watson Statistic of 2.01 indicates the absence of serial correlation in the model, hence the result is not spurious.
The regression result for equation II (table 4.4) indicates a negative relationship between poverty level and AGOUT, UNEM, ELCON and GEE and a positive relationship between poverty level and population. The result connotes that increase in AGOUT, UNEM, ELCON and GEE will reduce poverty level while growth in population will aggravate poverty level.
Statistically, only ELCON is significant. The R2 of 0.83 indicates that about 83% of variations in poverty level in equation II can be explained by variations in AGOUT, UNEM, ELCON, POP and GEE. The remaining 17% variations are accounted for by other factors affecting poverty level which is captured by the error term. Overall, equation II is robust as indicated by the F-statistic of 24.7 which is an indication of statistical significance of the entire parameter estimate.
Our findings clearly indicate a negative relationship between poverty level and agricultural output, as such an important determinant of poverty level. This shows that the theoretical expectation is upheld in the Nigeria’s context. Increase in agricultural output will bring about reduction in the level of poverty. However, it is observed that agricultural output is weak in explaining the changes in poverty level and statistically insignificant. A possible explanation is that the relative magnitude of agricultural output has not been in adequate quantum to have any noticeable impact on poverty level. The dismal performance of the sector is not inconsistence with the fact since the emergence of oil as an important commodity; the agricultural sector has not been given prior attention. Also as stressed by Anyanwu and Oaikhenan (1997), that the structure of agriculture makes it laborious, tedious and poorly remunerative. Government expenditure on education was found to be insignificant. This may have resulted from misappropriation of fund meant for the educational sector as well as poor funding of education sector in Nigeria.
Government agricultural expenditure has proven to have a positive impact on agricultural output. This findings of positive effect of investment on agriculture and agricultural output supports findings from previous studies like Iganiga and Unemhilin (2011). However, it can also be observed that the variable is not statistically significant. This is largely due to the neglect of the sector because of the increased importance and dominance of crude oil in the country’s economy. Also as stressed by Akpokodijie and Nwosu (1993) that the poor performance of the sector is associated with the relatively low government allocation to agriculture. Therefore, meeting the theoretical expectation indicates that expenditure in agriculture will bring about increase in agricultural output, which will in turn reduce the level of poverty in Nigeria (as proven in the relationship between agricultural output and poverty level). This goes in line with the objective of this work. However, the statistical insignificance of the variable (agricultural expenditure) shows low effort of the government in investing in the sector. The significant and positive relationship that exists between agricultural credit facility and agricultural output implies that agricultural credit is a catalyst to agricultural growth. To achieve increased agricultural output, there should be increase in the availability of credit to the sector. On the external front, food import value is expected to reduce agricultural output. The unexpected positive relationship is not surprising as food importation dominates the country. Also, increase in food export will increase agricultural output. The statistical significance of the variable (AEV) strongly supports this.
Our results and analysis above suggest that policy interventions are necessary to reduce poverty in Nigeria. As stressed early, a successful strategy for poverty reduction must begin by recognizing that they are mainly rural phenomena and that agriculture is at the heart of the livelihoods of rural people. As such there is need to increase agricultural expenditure and this should be complemented with monitored credit facilities so as to boost agricultural output which will in turn reduce poverty incidence in Nigeria. It does not suffice for government to increase the funding of the agricultural sector and education or other basic infrastructures. The implementation must be objective and conscientious. The leaders and people must be committed. One of the key issues that must be addressed here is the high level of fiscal irresponsibility in the country. There is also need for policy makers to introduce stringent measures to control the influx of foreign food. The significant and positive impact of agricultural export on agricultural output points to the need to encourage exports. Trade policies
should be formulated and signed if they are to encourage export of agricultural products.
The positive relationship between poverty and population growth points to the need to control the population growth rate in Nigeria to avoid Malthus’ prediction of hunger and strife due to over bloated population. The significant impact of electricity consumption points to the great potential of electricity supply in addressing the ravaging prevalence of poverty in Nigeria. As such electricity supply should be given attention in other words, there should be adequate access to infrastructure. The insignificant impact and negative relationship that exist between reduction in unemployment and poverty level calls for need to diversify the economy in order to create more job opportunities as this has potential in reducing poverty level. The insignificant impact of government educational expenditure on poverty level points to the misappropriation of funds and poor funding of projects in the educational sector in Nigeria. Therefore, the implementation of projects in the sector should be re-appraised to address the issues that threatened its effectiveness.
5.0 CONCLUSION
The relationship between agriculture and poverty reduction has continued to generate series of debate among scholars, which was reviewed in the study. Our test and estimation results showed the existence of long-run equilibrium relationship and a strong link between agriculture and poverty. This is a pointer to the fact that agriculture has the potential of reducing poverty since it is the principal driving force of the rural economy. Furthermore, the findings of work imply that continuous neglect of the contribution of agriculture to sustain economic growth of Nigeria could further increase the total number of people living in poverty. Deliberate, conscious and targeted efforts should be made toward agricultural growth by spending more on agricultural sector. This should be complemented with well monitored credit facilities.
REFERENCES
Abayomi, O. (1997). The Agricultural Sector in Nigeria: The Way Forward. CBN Bullion, 21:14-25.
Abedullah, N., Khalid, M. and Kouser, S. (2009). The Role of Agricultural Credit in the Growth of Livestock: A Case Study of Faissalabad Pakintan. Vet Journal, 29(2): 81-84.
Adawo M. A. (2011). Poverty Reduction in Nigeria: A Necessary Agenda. Current Research Journal of Economic Theory, 3(1): 14-19.
Akinboyo, O. (2008). Five Decades of Agricultural Policies: What Role Has Statistics Played? CBN Bullion, 32: 134-165.
Akpokodjie, G. and Nwosu, A. C. (1993). Planning for the Rural Poor: Trends and Options in the Development Plans of Nigeria. Review of Government and Society, 2(1): 51-70.
Aluko, M. O. (1999). The Institutionalisation of Corruption and its Impact on Political Culture and Behaviour in Nigeria. Journal of Behavioural Research, 1:73-83.
Aluko, M. O. (2003). Strategies for Poverty Reduction in Nigeria. Obafemi Awolowo University, Ile-Ife, Nigeria.
Anyanwu J. and Oyefusi A. (1997). The Structure of the Nigerian Economy (1960-1997). Joanee Publishers Ltd. Onitsha.
Bresciani, F. and Valdes, A. (2007). Beyond Food Production: The Role of Agriculture in Poverty Reduction. Food and Agriculture Organization (FAO), Rome.
Cervantes-Godoy, D. and Dewbre, J. (2010). Economic Importance of Agriculture for Poverty Reduction. Organization for Economic Co-operation and Development (OECD) Food, Agriculture and Fisheries Working Papers, No. 23, OECD.
Chamber, R. (1995). Poverty and Livelihoods: Whose Reality Counts? A Policy Commissioned by United Nations Development Programme (UNDP) for the World Summit for Social Development.
De Janvry, A. and Sadoulet, E. (2010). Agricultural Growth and Poverty Reduction: Additional Evidence. World Bank Research Observer. 25(1): 1-20.
Department for International Development (DFID) (2004). Agriculture, Growth and Poverty Reduction. Retrieved from http://www.dfid.gov.uk/documents/publications/agric-poverty-reduction.pdf.
Ekong C. N. and Onye K. (2014): Crowding Out Women: The Effect of Poverty on Men in Nigeria – A paper presented at the Department of Economics, University of Uyo, Uyo (Seminar Series).
Ekpo, A. H. and Uwatt U. B. (2005). Akwa Ibom State of Nigeria: Poverty Profile and Economic Transformation. Akwa Ibom: Foundation for Economic Research and Trainning.
Fan, S., Hazell, P. and Thorats, S. (2002). Linkages between Government Spending, Growth and Poverty in Rural China. Research Report 125. Washington.
Federal Ministry of Agriculture and Rural Development (FMARD) Report (2010). Retrieved from http://www.fmard.gov.ng/reports.
Giddens, A. (1996). Sociology, Second Edition. Oxford: Blackwell Publishers Ltd.
Issues. International Workshop on the Role of Agriculture in Poverty Reduction, Centre for Strategic Economic Studies, Victoria University, Melbourne, 6 May 2011.
Gujarati, D. N. (2004). Basic Econometrics. New Delhi: McGraw-Hill Companies Inc.
Habito, C. (2009). Patterns of Inclusive Growth in Developing Asia. Insights from an Empirical Growth-Poverty Elasticity Analysis. Asian Development Bank Institute (ADBI) Working Paper No. 145.
Hasan, R. and Quibria, M. G. (2004). Industry Matters for Poverty: A Critique of Agricultural Fundamentalism Journal, 57(2): 253-264.
Iganiga, B. O. and Unemhilin, D. O. (2011). Impact of Federal Government Agricultural Expenditure on Agricultural Output in Nigeria. Journal of Economic, 2(2): 81-88.
International Fund for Agricultural Development (IFAD) (2010). Rural Poverty in Nigeria. Rural Poverty Portal. Retrieved from http://www.rural poverty portal.org/country/home/tags/Nigeria/pdf.
Irx, X., Lin, L., Thirtle, C. and Wiggins, S. (2001). Agricultural Productivity Growth and Poverty Alleviation. Development Policy Review, 19(4): 449-466.
Koutsoyiannis, A. (1977). Theories of Econometrics. London: Macmillan Press
Lewu, M. A. (2011). A Critical Appraisal of Poverty Alleviation Programmes in Nigeria. School of Arts and Social Science, Adeyemi College of Education, Ondo, Nigeria.
Loayza, N. V. and Raddatz, C. (2010). The Composition of Growth Matters for Poverty Alleviation. Journal of Development Economic, 93(1): 137-151.
Mogues, T., Morris, M. (2008). Agricutural Public Spending in Nigeria. International Food Policy Research
Institute. Retrieved from
http://www.ifpri.org/sites/defauct/files/punlications/ifpridp00789.pdt.20/8/2014.
Motalvo, J. G. and Ravallion, M. (2010). The Pattern of Growth and Poverty Reduction in China. Journal of Comparative Economic, 33(4): 710-729.
National Bureau of Statistics (NBS) (2012). Annual Abstract of Statistics.
National Human Development Report, Nigeria. United Nations Development Programme, Lagos, Nigeria 1996 and 1998 series
Nick, A. (1998). The Human Ecosystem of the Niger Delta, an ERA handbook. Benin: Environmental Rights Action (ERA).
Nobbs, J. (1984). Sociology in Context. London: Macmillan Education.
Nwibo, S. (2012). Effect of Agricultural Exports on Food Security in Ebonyi State, Nigeria. Journal of Agricultural Research and Development, 2(3): 077-082.
Nyong, M. A. (1995). Contributions of Karl Marx and Marx Weber to Social Thought and Development. Ecojournal, 1(1): 40-43.
Obadan, M. I. (1997). Analytical Framework for Poverty Reduction: Issues of Economic Growth Versus Other Strategies. Nigeria Economic Society (NES) Annual Conference. Ibadan: Pat Mag Press Ltd.
Ogwumike, F. O. (1998). Poverty Alleviation Strategies in Nigeria- In Measuring and Monitoring Poverty in Nigeria, Proceedings of the Seventh Annual Conference of the Zonal Research Units of CBN.
Ogwumike, F. O. (2001). An Appraisal of Poverty and Poverty Reduction Strategies in Nigeria. CBN Economic and Financial Review, 39(4): 45-71.
Olayemi, J. K. (1995). A Survey of Approaches to Poverty Alleviation. NCEMA, Ibadan.
Olayemi, J. K. (1998). A Survey of Approaches to Poverty Alleviation. A paper presented at (NCEMA) National Workshop on Integration of Poverty Alleviation Strategies into Plans and Programmes in Nigeria, Ibadan. Nov. 27 – Dec. 1.
Olowa O. W. and Olowa O. (2013). Policy Interventions and Public Expenditure Reform for Pro-Poor Agricultural Development in Nigeria. African Journal of Agricultural Research, 9(4): 487-500. Quinney, R. (1980). Class, Stated and Crime. London: Longman.
Ravallion, M. and Chen, S. (2007). China’s (Uneven) Progress against Poverty. Journal of development Economics, 82 (1): 1-42.
Ravallion, M. and Datt, G. (1996). How Important to India’s Poor is the Sectoral Composition of Economic Growth. World Bank Economic Review, 10(1):1-26.
Ravallion, M. and Datt, G. (2002). Has Economic Growth been more Pro-poor in some States of India than others? Journal of Development Economics, 68:381-400.
Robertson, I. (1980). Sociology, New York: Worth Publishers Inc.
Ruggles, P. (1990). Drawing the Line: Alternative Poverty Measures – Their Implications for Public Policy. The Urban institute, Washington.
Schneider, K. and Gugerty, M. K. (2011). Agricultural Productivity and Poverty Reduction: Linkages and Pathways. The Evans School Review, 1(1): 56-74.
Sikira, M. (2006). Fiscal Decentralization and Poverty: Conceptual Framework and Application to Uganda. Journal of Public Administration and Development, 27(3): 175-185.
Sunkanmi, O. and Abayomi, O. (2014). Testing Public Expenditure and Poverty Reduction Nexus in Nigeria. Journal of developing Country Studies, 4 (6): 116-123.
Suryahadi, A., Daniel, S. and Sudarno, S. (2009). The Effects of Location and Sectoral Components of Economic Growth on Poverty: Evidence from Indonesia. Journal of Development Economics, 89(1): 109-17.
Ubi P. S., Effiom L. and Okon E. (2013). Poverty and its Related Theories: Reassessing the Relevance. American Journal of Social Issues and Humanities, 3(3):152-158.
Umo, J. (2012). Escaping Poverty in Nigeria: A Perspective on Strategic Agenda for Nigeria. Millennium Text publishers Ltd, Uyo.
UNICEF Annual Report (2014). Retrieved from
http://www.npr.org/blogs/goatsandsoda/2014/08/13/34009/377/unicef-report-africas-population-could-hit-4-billion-by-2100.
World Bank (1990). Poverty World Development Report. New York Oxford University Press.
World Bank (1993). Poverty Reduction Handbook. International Bank for Reconstruction and Development, Washington D. C.