Supervised Learning of Salient 2D Views of 3D Models
Hamid Laga∗ Global Edge Institute Tokyo Institute of Technology
Masayuki Nakajima† Computer Science Department
Tokyo Institute of Technology
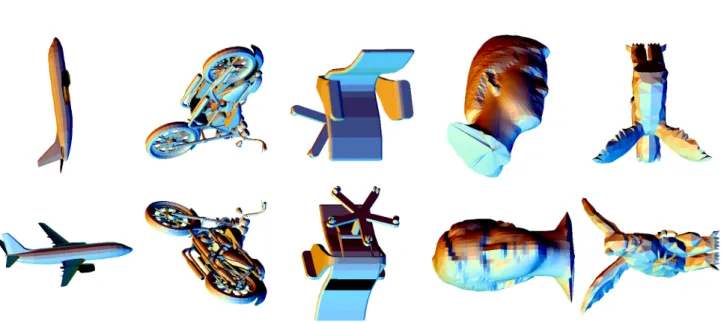
Figure 1: The first two best views selected using our algorithm.
Abstract
We introduce a new framework for the automatic selection of the best views of 3D models based on the assumption that models belonging to the same class of shapes share the same salient features. The main issue is learning these features. We propose an algorithm for computing these features and their corresponding saliency value. At the learning stage, a large set of features are computed from every model and a boosting algorithm is applied to learn the classification function in the feature space. AdaBoost learns a classifier that relies on a small subset of the features with the mean of weak classifiers, and provides an efficient way for feature selection and combination. Moreover it assigns weights to the selected features which we interpret as a measure of the feature saliency within the class. Our experiments using the LightField (LFD) descriptors and the Princeton Shape Benchmark show the suitability of the approach to 3D shape classification and best-view selection for online visual browsing of 3D data collections.
Keywords: 3D Model Retrieval, Boosting, Best view selection, Feature saliency
∗e-mail: [email protected] †[email protected]
1
Introduction
In recent years, with the significant advances in 3D acquisition and modeling, 3D model collections have gained significant impor-tance. They provide a mean for knowledge representation in a wide range of applications including Computer-Aided Design (CAD), molecular biology, medicine, digital archiving, and entertainment. However, extraction and reuse of this knowledge depends on the availability of efficient tools for browsing the large collections of 3D data available on the web. In this context, search engines are getting popular. For 3D models, the user specifies a query and the system returns a list of 3D models that match the query. However, in many situations, the user would want to get a broad overview of what is in the database or a broad overview of the search results in order to refine the search query. In this case, the stored models should be presented to the user in the form of few representative views, called also best or salient 2D views. Each one should carry the information that allows to understand the structure of the shape and to distinguish it from other shape classes.
The saliency of a 2D view of a 3D object can be defined as a func-tion of some view-dependent shape properties. The salient view is then the view that maximizes this function [Polonsky et al. 2005]. View entropy, for example, assumes that the best view of an object is the view that carries the largest amount of information about that object independently of the other objects in the database. In this paper, we define the best views of a 3D object as the views that al-low to distinguish the object from the other objects in the database. This definition is particularly suited for visual exploration and au-tomatic summarization of the contents of a database. Our solution is based on the assumption that 3D models belonging to the same class of shapes share the same salient features. Therefore, finding the best views of a 3D model, that we call representative feature set, can be regarded as a feature selection task. Particularly, supervised learning of shape features allows to capture the high-level semantic concepts of the data using low-level geometric features.
This paper extends over the approach proposed in [Laga and Naka-jima 2007] which is based on boosting. Our key idea is to use a large set of local and global features that describe the shape when viewed from different viewing angles, then use AdaBoost [Schapire 2003] to select only the most efficient ones. Boosting as a mean for classifier combination provides an efficient way for feature selec-tion and combinaselec-tion. It has been efficiently used for online learn-ing of the query features for relevance feedback in image retrieval [Tieu and Viola 2004; Amores et al. 2004]. Boosting, like many machine-learning methods, is entirely data-driven in the sense that the classifier it generates is derived exclusively from the evidence present in the training data itself [Schapire 2003]. Moreover, allow-ing redundancy and overlappallow-ing in the feature set has been proven to be more efficient in recognition and classification tasks than or-thogonal features [Tieu and Viola 2004].
The problem of defining representative 2D views of 3D models has received increasing attention in recent years. Early works study the similarity and stability relationship between different 2D views of a 3D model [Denton et al. 2004; Yamauchi et al. 2006]. The common approach is to:
1. extract a set of features from the 3D model, 2. quantify the importance of each feature,
3. define the importance of a view as a function of the impor-tance of the features that are visible from a given viewpoint, 4. then select the set of views that maximizes this quantity.
The mesh saliency [Lee et al. 2005] and the salient multi-view rep-resentation [Yamauchi et al. 2006] are based on this idea. These solutions consider isolated 3D models out of context. However, in order to capture the high-level semantic concepts of the 3D shapes, which are very important for visualization and exploration, we con-sider the problem in the context of 3D shape repositories where the data are clustered into semantic classes. The models within each class share common semantic concepts. Best-view selection and view saliency quantification can then be formulated as a problem of learning these features by the mean of feature selection and fea-ture importance measurement. This is a well studied problem in the pattern recognition and machine learning community.
The basic learning approach is the Nearest Neighbor classifica-tion. It has been used for the classification of 3D protein databases [Ankerst et al. 1999], and 3D engineering parts [Ip et al. 2003]. Hou et al. [Hou et al. 2005] introduced a semi-supervised seman-tic clustering method based on Support Vector Machines (SVM) to organize 3D models semantically. SVMs have been widely used in statistical learning. The given query model is first labeled with some semantic concepts and automatically assigned to a single clus-ter. Then the search is performed only inside the corresponding cluster. Supervised learning and ground-truth data are used to learn the patterns of each semantic cluster off-line. Later, they extend the idea [Hou and Ramani 2006] to combine both semantic concepts and visual content in a unified framework using probability-based classifier. They use a linear combination of several classifiers, one classifier per shape descriptor. The individual classifiers, which are trained in a supervised manner, output an estimate of the probabil-ity of data being classified to a specific class. The output of the training stage is also used to estimate the optimal weights of the combination model. In this approach features to use and type of classifiers are defined manually. The method we propose provides a framework for automatic feature selection and weight assignment. The closest work to ours is of Shilane and Funkhouser [Shilane and Funkhouser e 07]. Their approach uses also supervised learning to predict the retrieval performance of each feature, and select only a set of the most effective descriptors to be used during the retrieval. Given that the descriptors are computed locally, the approach al-lows to select the most important regions of the surface of a 3D shape. The algorithm we propose relies on a large set of features and the computation time at the run-time is not affected by the num-ber of features. Specifically, we make the following contributions:
1. an algorithm for learning the discriminative 2D views of a class of shapes from a training set,
2. a measure for the discrimination ability of 2D views with re-spect to the semantic classes defined by the database classifi-cation,
3. a method for selecting automatically the best views of 3D models,
4. the selected views are consistent for all objects of the same class, and are suitable for multi-scale organization of the shape space based on the hierarchical classification of the training set.
Best view selection has many applications in Computer Graphics and online browsing of digital media contents. We are particularly motivated by the automatic generation of thumbnails of 3D models, automatic summarization of the database contents, and 2D-based 3D model search.
This paper is organized as follows; Section 2 gives and overview of the proposed framework. Section 3 details the feature selection and combination algorithm for binary classification problems. The gen-eralization to a multi-class problem, and to unseen 3D models are
presented in Section 4.1 and 4.2. Experimental results are provided in Section 5. Section 6 concludes the paper.
2
Overview
Our approach performs as follows; During the training stage a strong classifier is learned using AdaBoost. The classifier returns the likelihood that a given 3D model O belongs to a class of shapes
C. First a large set of features are extracted. In our
implementa-tion we used 100 Light Field Descriptors (LFD) [Chen et al. 2003]. Each descriptor encodes the properties of a 2D projection of a 3D shape. Then a set of binary classifiers are trained using AdaBoost. Each binary classifier learns one class of shapes and its optimal set of salient views. Finally, the binary classifiers are combined into one multi-class classifier.
At the run-time, given the user-specified 3D model Q, a ranked list of k−best views is produced in a two-stage process. First, a large set of features are computed from the query model Q, in the same manner as for the database models. Then in the first stage, a set
of highly relevant classes to Q is found. Each binary classifierCi
decides wether the class Ciis relevant to the query Q or not. The
class with highest posterior probability CQ=argmaxCP(C|Q)is
selected. In the final stage, the best views of the query model Q are
the selected views of the class of shapes CQ.
The key step is the way we predict the saliency of each feature with respect to a class of shapes in the training set. More formally, the
saliency of a feature−→v with respect to a class of shapes C is the
ability of this feature to discriminate the shapes of class C from the shapes of other classes in the database. Mathematically, given the
binary classifierC−→v trained with the feature−→v , the saliency of−→v
is directly related to the overall classification error ofC−→v on the
data set. However, none of the existing classifiers that are based on a single feature can achieve zero classification error. Therefore none of the features is sufficiently salient. AdaBoost provides a way for combining weak classifiers and shape features with different saliency degrees, into a single strong classifier with high classifica-tion performance. There are several advantages of this approach; Although a large set of features is extracted both at the training and online stages, only a small subset of the features (between 10 to 50) is used during the similarity estimation. This allows retrieval at interactive rates.
Finally, the algorithm selects automatically the representative set of features for each class of shapes, and provides a mean for automatic combination of the selected features. In our implementation, we use the Light Field descriptors (LFD) which has been proven to be the most effective on the Princeton Shape Benchmark (PSB) [Shilane et al. 2004]. However, a further investigation is required to test the efficiency of other 2D view descriptors when boosted.
3
Supervised classification - the binary case
The first task in our approach is to build a classifierC that decides
wether a given 3D model O belongs to a class of shapes C or not. The challenge is to define a feature space such that 3D shapes be-longing to the same class are mapped into points close to each other in the new feature space. Clusters in this feature space will corre-spond to classes of 3D models. There are many feature spaces that have been proposed in the literature, but it has been proven that none of them achieved best performance on all classes. We propose
to follow a machine learning approach where each classifier is ob-tained by the mean of training data. In the following we explain in detail each step in the case of a binary classification problem.
3.1 Feature extraction
The process starts by computing a large set of features for each model in the training set, the contents of the database to search. There are many requirements that the features should fulfill: (1) compactness, (2) computation speed, and (3) the ability to discrim-inate between dissimilar shapes. However, in real applications it is hard to fulfill these requirements when the goal is to achieve high retrieval accuracy. In fact, compact features, which are easy to com-pute, are not discriminative enough to be used for high accuracy retrieval. We propose to extract a large set of features following the same idea as in [Tieu and Viola 2004].
There are many shape descriptors that can be computed from a 3D model. A large set of spherical harmonics [Funkhouser and Shilane 2006] and spherical wavelet-based descriptors [Laga et al. 2006] can be computed by moving the center of the sphere across differ-ent locations on the shape’s surface or on a 3D grid. However, in the literature, it has been proven that view-based descriptors out-perform significantly the spherical descriptors. We propose to use the Light field descriptors (LFD).
First, all the models in the database are translated to their center of mass, scaled to fit inside a unit sphere, and normalized for rotation using continuous PCA [Vranic 2003]. Then we compute for each 3D model a set of 100 Light Field descriptors in the same manner as in [Chen et al. 2003]. Recall that the length of one light field de-scriptor is 45. Therefore, every 3D model is represented with a set of 100 vectors of dimension 45. Each LFD provides a description of the shape when viewed from the corresponding projection point.
3.2 Boosting the binary classification
A brute force approach for comparing a large set of features is
com-putationally very expensive. In the best case, it requires M×d×N
comparisons, where M is the number of feature vectors used to de-scribe a 3D model, d is the dimension of the feature space, and N is the number of models in the database.
Previous work consider this problem from the dimensionality re-duction point of view. Ohbuchi et al. [Ohbuchi et al. 2007] provides an overview and performance evaluation of six linear and non-linear dimensionality reduction techniques in the context of 3D model re-trieval and demonstrated that non-linear techniques improve signif-icantly the retrieval performance. There have been also a lot of research in classifiers that have a good generalization performance by maximizing the margin. The major advantage of boosting over other classification algorithms such as Support Vector Machines (SVM) [Hou et al. 2005], and non-linear dimensionality reduction techniques [Ohbuchi et al. 2007; Ohbuchi and Kobayashi 2006] is its speediness. Moreover, it provides a good theoretical and practi-cal quantification of the upper bound of the error rate, therefore a good generalization performance. Furthermore, it can be used as a feature selection algorithm.
We use AdaBoost version of boosting. Every weak classifier is based on a single feature of a 3D shape (recall that we have com-puted a large set of features for each 3D model). The final strong classifier, a weighted sum of weak classifiers, is based on the most discriminant features weighted by their discriminant power. The algorithm is summarized in Algorithm 1. The output of the strong
classifier can be interpreted as the posterior probability of a class C given the shape O:
P(C|O) = e
fC(O)
efC(O)+e−fC(O) (1)
where fC(O) is the weighted average of the base classifiers
pro-duced by AdaBoost for the 3D object O.
Algorithm 1: AdaBoost algorithm for binary classification Input:
• Training set SC={(Vi,yi),i=1. . .N}, where
Vi={−→v1, . . . ,−→vK}a large set of K features computed
from the 3D object Oi,
yi∈ {+1,−1}the desired classification of Oi.
Output:
• The decision function fC, such that, fC(O)>0 is O∈C,
and fC(O)<0 if O∈/C.
1. Initialize the sample weights: w0,i,i=1, . . . ,N:
wi=
{ 1
N+,if Oiis a positive example
1
N−,otherwise.
where N+and N−are, respectively,the number of positive
and negative examples. 2. for t=1, . . . , T do
(a) Train one weak classifier hk,k=1. . .K for each
feature vector vk,
(b) Choose the hypothesis htwith the lowest
classification errorεt.
(c) Update the sample weights:
wt+1,i=
1
Zt
wt,ie−αtht(Oi)·yiwhere ht(Oi) = +1,−1
wether Oiis correctly or incorrectly classified by the
weak hypothesis ht,αt=0.5 log
(
1−εt
εt
)
, and Ztis a
normalizing constant so that wt+1is a distribution.
end
3. Final classifier: fC(O) =
T
∑
t=1
αtht(O).
AdaBoost requires only two parameters to tune; the type of weak classifier, and the maximum number of iterations, i.e., the num-ber of weak classifiers. The classification performance of the weak classifier is only required to be slightly better than random. We used the LMS classifier bacause of its simplicity. The parameter T can
be set such that E[fC], the upper bound of the classification error on
the training data of the strong classifier fC, is less than a threshold
θ. In our experiments we found that a value of T between 20 and
50 is sufficient to achieve an upper bound of the classification error
on the training set less than 1.0%.
For training the classifiers we use as positive and negative exam-ples the relevant and non-relevant models provided in the Prince-ton Shape Benchmark (PSB) classification. For example, to build a strong classifier that learns the decision boundary between the biped
human objects and non-biped human objects, the positive examples
are set to all models that belong to the class biped human, while the negative examples are the remaining models in the database. The PSB is provided with a train and test classifications. We use the train classification to train our classification and the test classifica-tion to assess the performance of the classificaclassifica-tion and retrieval.
3.3 Interpretation of the weak classifiers
Boosting algorithm can be used as a feature selection and combi-nation technique. Each iteration learns a new weak classifier that is based on the most discriminative feature according to the prob-ability distribution of the training data. In the case of LFD, the selected feature is the descriptor of a 2D projection of a 3D model. Therefore, by adopting a Boosting approach we provide a tool for best view selection and view ordering based on their ability to dis-criminate the shapes of a certain class from the other classes in the database. Recall that here we assume that the quality of a view is quantified as its discrimination ability. Furthermore, the weight of each weak classifier can be considered as a measure of the saliency of the selected feature.
4
Generalization
4.1 Generalization to multiple classes
Two straightforward extensions schemes are the one-vs-all classi-fier and the pairwise classiclassi-fier [Hao and Luo 2006]. The pairwise
classifier uses L(L−1)/2 binary classifiers, where L is the number
of classes in the training set, to separate each class from the other classes. A voting scheme at the end is used to determine the correct classification [Hao and Luo 2006]. With the one-vs-all classifier, L AdaBoost-based binary classifiers are trained, each of which is able to distinguish one class from all the others. The pairwise classifier has a smaller area of confusion in the feature space compared to the one-vs-all. In our implementation we used a one-vs-all classi-fier for its simplicity. The details of the algorithm are sketched in Algorithm 2.
The output of the training stage is a set of L binary classifiers, where
L is the number of classes in the database. Given a query model Q each binary classifier will return a vote for a certain class. We
use the positive votes to construct the set of candidate classes to which the query Q may belong. It is important to notice that when a new 3D model or a new class of models are added to the database, only the classifier that corresponds to the model’s class that needs training.
Algorithm 2: One-vs-all extension of binary AdaBoost for
multi-class problem. Input: • Training set SCl={(V l i,y l i),i=1. . .N},l=1, . . . ,L, where
Vil={−→v1l, . . . ,−→vlK}a large set of K features computed
from the 3D object Oi,
yli∈ {+1,−1}the desired classification of Oi.
Output:
• L binary decision functions fCl, such that, fCl(O)>0 is Clis
a candidate class for the 3D model O,
and fCl(O)<0 otherwise.
for l=1, . . . , L do
1. Train one strong binary classifierCl, using Algorithm 1.
fCl(O)>0 if O∈Cl, and negative otherwise.
end
4.2 Generalization to unseen 3D models
At the run time, the user specifies a 3D model, that we call a query
Q, and seeks to find its salient 2D views. This is performed in two
steps; first we seek to find the candidate classes to which the query may belong. Then, the best views of the query model are those selected for its best candidate class.
To classify the query Q, we compute a set of M feature vectors (LFD in our case) in the same manner as in the training stage
(Sec-tion 3.1). Then we let each binary classifierClvote for a the class
Cl,l=1, . . . ,L. The candidate classes are determined by the
classi-fiers that have positive response to the query Q. We order them in descending order of the class posterior probabilities given in Equa-tion 1. Next, we select the class with the highest response and as-sign to the 3D model the best views that have been learned for this
class, i.e, the salient features of the class Ci. Notice that the
clas-sification is performed only on a subset of the large set of features. This has significant impact on the computation time.
5
Experimental results
To evaluate the performance of the proposed approach, we use the Princeton Shape Benchmark (PSB) [Shilane and Funkhouser 2006] training and test sets, and the Shape Retrieval Evaluation Contest (SHREC2006) [Veltkamp et al. 2006] query set and performance evaluation tools. The Princeton Shape Benchmark contains 1814 polygon soup models, divided into the training set (907 models) and the test set (907 models). Every set contains four classification levels; the base train classification contains 129 classes while the coarsest classification (coarse3) contains two classes: man-made and natural objects. We use the base train classification to train our classifiers and the test set to assess the classification performance. Figure 1 shows the first two best views of five different models. This figure shows clearly that the important features of the models are visible from the selected views. Figure 2 shows other results. In this experiment, for each model we show the first five best views automatically selected by our algorithm. The views are ordered by their saliency value. There are two important properties of our algorithm:
• First, the selected views are consistent across all models of a
same class of shapes. This is shown by the first and second rows of Figure 2 for the horse class, row 3 and 4 for the hand class, row 5 and 6 for the dinosaur class, and rows 7, 8, 9 for the rabbit class. Notice that the two hand models have differ-ent shape and posture. Even with the presence of high shape variability within the classes, the algorithm we developed is able to compute consistent best views.
• The LFD we used to characterize each 2D projection is
rota-tion invariant in the 2D plane, and reflectance invariant in 3D. Consequently, the selected best views are 2D rotation and re-flectance sensitive. We can see this for the hand class (rows 3 and 4), and also for the rabbit class (rows 7, 8, and 9). We will experiment in the future with descriptors that take into account the symmetries of the 3D model.
To evaluate quantitatively the efficiency of the best view selection algorithm, we propose to use the selected views as features for in-dexing 3D model collections. We assume that the selected views are good if they achieve better classification and retrieval performance than when using the entire set of 2D views. This is equivalent to our initial assumption which states that a 2D view is salient if it allows to discriminate the object from the other objects in the database.
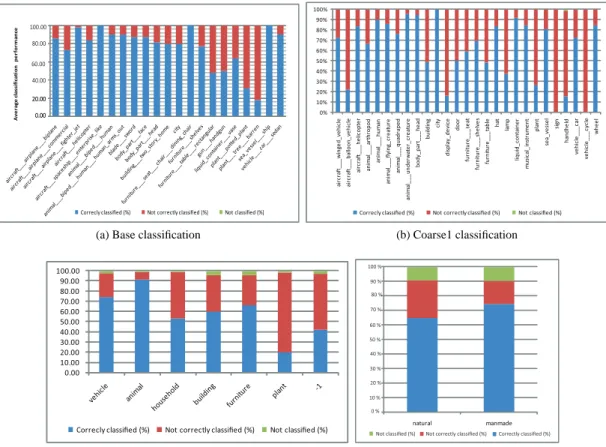
Figure 3 summarizes the classification performance of the devel-oped AdaBoost classifier. In this figure, the average classification performance is the ratio between the number of correctly classified models of a class C to the total number of models in the class. We see that, for the coarse3 classification (Figure 3-(d)), which con-tains only two classes with very high shape variability within each
class, the classification performance is at 65.3% for natural shape
and 73% for man-made models. This clearly proves that the training procedure captures efficiently the semantic concepts of the shape classes and generalizes relatively well to unseen samples.
The performance on the other classification levels: base, coarse1 and coarse2 are shown in Figure 3-(a),(b) and (c). In this experi-ment we show only the classification results on the classes of the test set that exist in the training set. On the base classification (Fig-ure 3-(a)), we can see that the classifiers achieve 100% classifica-tion performance on space ship entreprise like, dining chair and
sea vessel. The lowest performance is on the plant tree models.
This is because probably the class has high variability and many small detailed features that cannot be captured by the Light Field descriptors.
To evaluate the retrieval performance we use the query set of the SHREC2006. Recall that none of the query models is present in the database. Therefore, they can be used to assess the ability of the classifier to generalize to unseen models. We compare with the algorithms that have been benchmarked in the contest [Veltkamp et al. 2006]. We show only the top six results but the reader can refer to [Veltkamp et al. 2006] for a complete comparison. Each query has a set of highly relevant classes, relevant classes, and not
relevant classes.
Table 1 summarizes the performance on the Mean Average Pre-cision, Mean First Tier and Second Tier, for both highly relevant and relevant classes. Our method ranks top on all measures for relevant classes. Moreover, it outperforms significantly the other methods on the Mean Second Tier for both highly relevant and rel-evant classes. This shows that the combination of classification and search improves the ability to retrieve the relevant results in the top of the retrieved list. Our method however, achieved relatively low performance on Cumulative Gain-related performance measures. We believe that this is because of lack of data at the training stage and therefore, it is hard to capture the salient features of the class. We plan in the future to experiment with larger databases. Finally, we compare the retrieval performance of the selected views with the retrieval performance of the LFD. In this experiment we use our own implementation of the LFD. Table 1 shows that the proposed method outperforms significantly the original LFD which uses 100 views sampled uniformly around the object. This partic-ularly demonstrates that the selected views with our algorithm are salient as they allow to discriminate the object from the other ob-jects in the database. However, in some situations such as the rabbit model in Figure 2, the selected views may not be visually plausi-ble. We plan in the future to extend our algorithm by incorporating more constraints, physical constraints for example, to handle such situations.
6
Conclusion
We have proposed in this paper a new framework for best view se-lection of 3D models. By using a boosting approach we are able to use a large set of features in order to capture the high level semantic concepts of different shape classes. Moreover, we provide a way to quantify the saliency of a 2D view with respect to the classification. The developed algorithm allows to use simultaneously a cascade of
0.00 20.00 0.00 20.00 40.00 60.00 80.00 100.00
(a) Base classification
0 % 1 0 % 2 0 % 3 0 % 4 0 % 5 0 % 6 0 % 7 0 % 8 0 % 9 0 % 1 0 0 % a n im a l_ _ _ a r t h r o p o d a n im a l_ _ _ h u m a n a n im a l_ _ _ q u a d r u p e d a n im a l_ _ _ u n d e r w a te r _ c r e a t u r e b o d y _ p a r t _ _ _ h e a d b u i ld i n g c it y d is p l a y _ d e v ic e d o o r f u r n it u r e _ _ _ s e a t f u r n it u r e _ _ _ s h e lv e s fu r n i t u r e _ _ _ ta b le h a t la m p l iq u id _ c o n t a in e r m u s i c a l _ i n s t r u m e n t p l a n t s e a _ v e s s e l s i g n h a n d h e l d v e h ic le _ _ _ c a r v e h ic l e _ _ _ c y c l e w h e e l (b) Coarse1 classification 0 .0 0 1 0 .0 0 2 0 .0 0 3 0 .0 0 4 0 .0 0 5 0 .0 0 6 0 .0 0 7 0 .0 0 8 0 .0 0 9 0 .0 0 1 0 0 .0 0 (c) Coarse 2 classification. natur al manmade 0 % 10 % 20 % 30 % 40 % 50 % 60 % 70 % 80 % 90 % 100 % (d) Coarse 3 classification
Figure 3: Average classification performance for each class of shapes in the test set of the Princeton Shape Benchmark.
shaped descriptors. Although we have experimented only with one type of descriptors, we may want to use a different set of descriptors for classification.
This work opens many avenues to explore. First, the framework we proposed allows the use of heterogeneous features, all what we need is to plug new types of descriptors to the training process. Particularly we are interested in descriptors that take into account the 2D and 3D symmetries in order to solve the ambiguity problem illustrated in Figure 2. Also we plan to investigate on the meaning of the selected feature space for each shape class and extend the framework to the problem of building creative prototypes of 3D object classes, where the prototype should capture the high level semantic features of the class.
Acknowledgement. This research is supported by the Japanese Ministry of Education, Culture, Sports, Science and Technology (MEXT) program Promotion of Environmental Improvement for Independence of Young Researchers under the Special Coordina-tion Funds for Promoting Science and Technology.
References
AMORES, J., SEBE, N., RADEVA, P., GEVERS, T.,AND
SMEUL-DERS, A. 2004. Boosting contextual information in content-based image retrieval. In the 6th ACM SIGMM international
workshop on Multimedia information retrieval, 31–38.
ANKERST, M., KASTENMOLLER, G., KRIEGEL, H.-P., AND
SEIDL, T. 1999. Nearest neighbor classification in 3D protein
databases. In the Seventh International Conference on Intelligent
Systems for Molecular Biology, AAAI Press, 34–43.
CHEN, D.-Y., TIAN, X.-P., SHEN, Y.-T.,ANDOUHYOUNG, M.
2003. On visual similarity based 3D model retrieval. Computer
Graphics Forum 22, 3, 223–232.
DENTON, T., DEMIRCI, M., ABRAHAMSON, J.,
SHOKOUFAN-DEH, A.,ANDDICKINSON, S. 2004. Selecting canonical views
for view-based 3-D object recognition. II: 273–276.
FUNKHOUSER, T.,ANDSHILANE, P. 2006. Partial matching of
3D shapes with priority-driven search. In SGP ’06: Proceedings
of the fourth Eurographics Symposium on Geometry Processing,
Eurographics Association, 131–14.
HAO, W.,ANDLUO, J. 2006. Generalized multiclass adaboost
and its applications to multimedia classification. In CVPRW ’06:
Proceedings of the 2006 Conference on Computer Vision and Pattern Recognition Workshop, IEEE Computer Society, 113.
HOU, S.,ANDRAMANI, K. 2006. A probability-based unified
3D shape search. In European Commission International
Con-ference on Semantic and Digital Media Technologies, Lecture notes in computer science, vol. 4306, 124–137.
HOU, S., LOU, K.,ANDRAMANI, K. 2005. Svm-based
seman-tic clustering and retrieval of a 3D model database. Journal of
Computer Aided Design and Application 2, 155–164.
IP, C. Y., REGLI, W. C., SIEGER, L.,ANDSHOKOUFANDEH, A.
Rank Methods Value 1 Shilane et al. (R3) 0.53 2 Zaharia et al. (R1) 0.50 3 Our method 0.49 4 Makadia et al. (R2) 0.46 5 Shilane et al. (R2) 0.48 6 Makadia et al. (R1) 0.47 7 LFD 0.28
(a) Mean Average Precision(highly relevant).
Rank Participant Value
1 Our method 0.53 2 Shilane et al. (R3) 0.52 3 Zaharia et al. (R1) 0.51 4 Shilane et al. (R2) 0.49 5 Makadia et al. (R2) 0.43 6 Makadia et al. (R1) 0.42 7 LFD 0.22
(b) Mean Average precision (Relevant)
Rank Methods Value
1 Makadia et al. (R2) 44.77% 2 Makadia et al. (R1) 43.77% 3 Our method 43.28% 4 Daras et al. (R1) 42.74% 5 Papadakis et al. (R1) 41.85% 6 Shilane et al. (R3) 40.86% 7 LFD 24.51%
(c) Mean First Tier (Highly relevant).
Rank Participant Value
1 Our method 43.78% 2 Makadia et al. (R2) 40.55% 3 Makadia et al. (R1) 38.78% 4 Shilane et al. (R3) 37.40% 5 Papadakis et al.(R1) 37.40% 6 Shilane et al. (R2) 37.30% 7 LFD 21.63%
(d) Mean First Tier (Relevant)
Rank Participant Value
1 Our method 39.97% 2 Makadia et al. (R2) 27.86% 3 Makadia et al. (R1) 26.62% 4 Daras et al. (R1) 25.663% 5 Shilane et al. (R3) 25.63% 6 Papadakis et al. (R1) 25.61% 7 LFD 15.80%
(e) Mean Second Tier (Highly Relevant)
Rank Participant Value
1 Our method 42.73% 2 Shilane et al. (R2) 26.58% 3 Shilane et al. (R3) 26.26% 4 Makadia et al. (R2) 25.22% 5 Zaharia et al. (R1) 24.63% 6 Papadakis et al. (R1) 24.24% 7 LFD 14.32%
(f) Mean Second Tier (Relevant)
Table 1: Mean Average precision, Mean First Tier and Second Tier performance.
Proceedings of the eighth ACM symposium on Solid modeling and applications, ACM Press, 322–327.
LAGA, H., ANDNAKAJIMA, M. 2007. Supervised learning of
salient 2d views of 3D models. In In NICOGRAPH 2007.
LAGA, H., TAKAHASHI, H.,ANDNAKAJIMA, M. 2006.
Spheri-cal wavelet descriptors for content-based 3D model retrieval. In
SMI ’06: Proceedings of the IEEE International Conference on Shape Modeling and Applications 2006 (SMI’06), 75–85.
LEE, C. H., VARSHNEY, A.,ANDJACOBS, D. W. 2005. Mesh
saliency. In SIGGRAPH ’05: ACM SIGGRAPH 2005 Papers, ACM Press, New York, NY, USA, 659–666.
OHBUCHI, R.,ANDKOBAYASHI, J. 2006. Unsupervised learning
from a corpus for shape-based 3D model retrieval. In MIR ’06:
Proceedings of the 8th ACM international workshop on Multi-media information retrieval, ACM Press, 163–172.
OHBUCHI, R., KOBAYASHI, J., YAMAMOTO, A.,ANDSHIMIZU,
T. 2007. Comparison of dimension reduction method for
database-adaptive 3D model retrieval. In Fifth International
Workshop on Adaptive Multimedia Retrieval (AMR 2007).
POLONSKY, O., PATAN`E, G., BIASOTTI, S., GOTSMAN, C.,AND
SPAGNUOLO, M. 2005. What’s in an image? The Visual
Com-puter 21, 8-10, 840–847.
SCHAPIRE, R. E. 2003. The boosting approach to machine
learn-ing: An overview. In In D. D. Denison, M. H. Hansen, C.
Holmes, B. Mallick, B. Yu, editors, Nonlinear Estimation and Classification, Springer.
SHILANE, P., AND FUNKHOUSER, T. 2006. Selecting
Distinc-tive 3D Shape Descriptors for Similarity Retrieval. IEEE
In-ternational Conference on Shape Modeling and Applications (SMI2006) 0, 18.
SHILANE, P.,ANDFUNKHOUSER, T. e 07. Distinctive regions of
3D surfaces. ACM Trans. Graph. 26, 2, 7.
SHILANE, P., MIN, P., KAZHDAN, M., ANDFUNKHOUSER, T.
2004. The princeton shape benchmark. In SMI’04: Proceedings
of the Shape Modeling International 2004 (SMI’04), 167–178.
TIEU, K.,ANDVIOLA, P. 2004. Boosting image retrieval.
Inter-national Journal of Computer Vision 56, 1-2, 17–36.
VELTKAMP, R. C., RUIJSENAARS, R., SPAGNUOLO, M., VAN
ZWOL, R.,AND TERHAAR, F. 2006. SHREC2006: 3D Shape
Retrieval Contest. Tech. Rep. UU-CS-2006-030, Department of Information and Computing Sciences, Utrecht University, 06. VRANIC, D. V. 2003. An improvement of rotation invariant
3D-shape based on functions on concentric spheres. In ICIP 2003, 757–760.
YAMAUCHI, H., SALEEM, W., YOSHIZAWA, S., KARNI, Z.,
BELYAEV, A.,ANDSEIDEL, H.-P. 2006. Towards stable and
salient multi-view representation of 3D shapes. In Proceedings
of the IEEE International Conference on Shape Modeling and Applications 2006 (SMI’06), 40.