VYSOKE´ UC
ˇ ENI´ TECHNICKE´ V BRNEˇ
BRNO UNIVERSITY OF TECHNOLOGYFAKULTA INFORMAC
ˇ NI´CH TECHNOLOGII´
U
´ STAV POCˇI´TACˇOVE´ GRAFIKY A MULTIME´DII´
FACULTY OF INFORMATION TECHNOLOGYDEPARTMENT OF COMPUTER GRAPHICS AND MULTIMEDIA
VISIPEDIA:
MULTI-DIMENSIONAL OBJECT EMBEDDING
BASED ON PERCEPTUAL SIMILARITY
DIPLOMOVA
´ PRA´CE
MASTER’S THESIS
AUTOR PRA
´ CE
Bc. TOMA
´ Sˇ MATERA
AUTHOR
VEDOUCI´ PRA
´ CE
Prof. Dr. Ing. PAVEL ZEMC
ˇ I´K
Abstrakt
Problémy jako je jemnozrnná kategorizace či výpočty s využitím lidských zdrojů se v posledních letech v komunitě stávají stále populárnějšími, což dosvědčuje i značné množství publikací na tato témata. Zatímco většina těchto prací využívá “klasických” obrazových příznaků extrahovaných počítačem, tato se zaměřuje především na percepční vlastnosti, které nemohou být snadno zachyceny počítači a vyžadují zapojení lidí do procesu sběru dat. Práce zkoumá možnosti levného a efektivního získávání percepčních podobností od uživatelů rovněž ve vztahu ke škálovatelnosti. Dále vyhodnocuje několik relevantních ex-perimentů a představuje metody zlepšující efektivitu sběru dat. Jsou zde také shrnuty a porovnány metody učení multidimenzionálního indexování a prohledávání tohoto pros-toru. Získané výsledky jsou následně užity v komplexním experimentu vyhodnoceném na datasetu obrázků jídel. Procedura začíná získáváním podobností od uživatelů, pokračuje vytvořením multidimenzionálního prostoru jídel a končí prohledáváním tohoto prostoru.
Abstract
Some problems like fine-grained categorization or human-based computation has become popular in recent years in the community, which has been proven by a large number of published works concerning these topics. Whereas most of these works uses a “classical” visual features extracted by machine, this one in partricular focuses on perceptual properties which cannot be easily sampled by machine and which involves humans into this data retrieval process. There are examined ways, how to obtain perceptual similarities from humans cheaply and effectively also in terms of scalability. There are performed various experiments and purposed several methods to improve this efficiency. The work also reviews and compares existing methods of embedding learning and navigating through its space. The acquired observations are subsequently used in a complex experiment evaluated with a food image dataset, covering the whole procedure from similarity retrieval from humans, over data embedding learning up to searching in such multi-dimensional space.
Klíčová slova
Visipedia, jemnozrnná kategorizace, percepční podobnost, získávání podobností, crowd-sourcing, MTurk, multidimenzionální indexování dat, mental matching, výpočty s využitím lidských zdrojů
Keywords
Visipedia, fine-grained categorization, perceptual similarity, similarity retrieval, crowd-sourcing, MTurk, multi-dimensional data embedding, mental matching, human-based com-putation
Citace
Tomáš Matera: Visipedia: Multi-dimensional Object Embedding Based on Perceptual Sim-ilarity, diplomová práce, Brno, FIT VUT v Brně, 2014
Visipedia: Multi-dimensional Object Embedding
Based on Perceptual Similarity
Prohlášení
Prohlašuji, že jsem tuto diplomovou práci vypracoval samostatně pod vedením pana profe-sora Pavla Zemčíka. Další informace mi poskytl můj konzultant, profesor Serge Belongie. Uvedl jsem všechny literární prameny a publikace, ze kterých jsem čerpal.
. . . . Tomáš Matera 28. května 2014
Poděkování
Na tomto místě bych chtěl poděkoval lidem, kteří mi radili, pomáhali a motivovali mě při psaní diplomové práce. V první řadě děkuji svému konzultantovi, profesoru Sergeovi Belongiemu, za vřelé přijetí na University of California v San Diegu, uvedení do prob-lematiky práce, o které jsem měl předtím jen okrajové znalosti, cenné rady a trpělivost během mé celé desetiměsíční stáže. Dále bych chěl poděkovat svému vedoucímu práce, profesoru Pavlu Zemčíkovi, za organizaci zahraničního výjezdu a věcné připomínky k práci samotné. Poděkování patří také všem členům Computer Vision Labu na UC San Diego a Caltechu za nápady a připomínky k mé práci.
Acknowledgments
At this place I would like to thank to people who advised, helped, and motivated me during the work on my Master’s thesis. Firstly, I thank to my adviser, professor Serge Belongie, for a warm welcome at University of California in San Diego, introduction to the field of the thesis, in which I had before just peripheral knowledge, valuable advices and his patience during my whole ten-month internship. I also thank to my supervisor, professor Pavel Zemčík, for the arrangement of the internship and for substantive comments to the work itself. My thanks also go to all members of Computer Vision Lab at UC San Diego and Caltech for their ideas and comments to my work.
c
Tomáš Matera, 2014.
Tato práce vznikla jako školní dílo na Vysokém učení technickém v Brně, Fakultě in-formačních technologií. Práce je chráněna autorským zákonem a její užití bez udělení
Contents
1 Introduction 3
2 About the Visipedia Project 4
2.1 Motivation . . . 4
2.2 Visipedia Concept and Design . . . 4
2.3 Relation to the Thesis . . . 6
3 Crowdsourcing 7 3.1 Crowdsourcing Types . . . 7
3.2 Reward . . . 8
3.3 On-line Tools and Services . . . 9
3.4 Cost Estimation . . . 11
3.5 Quality Assurance . . . 12
3.6 Crowdsourcing in Machine Vision . . . 12
4 Data Embedding 14 4.1 Techniques to Learn Data Embedding . . . 14
4.2 Navigating Through the Space of Embedding . . . 20
5 Ways of Getting Similarities 24 5.1 Term Definition . . . 24
5.2 Triplet Retrieval Efficiency . . . 26
5.3 Templates and Screens . . . 26
5.4 Template-specific Triplets . . . 28
5.5 Necessary Amount of Triplets . . . 30
5.6 Algorithms for Triplet Selection . . . 31
6 Experiments on a Toy Dataset 32 6.1 Triplet Universe Generation . . . 32
6.2 Templates and Artificial Worker . . . 33
6.3 Error Measurement . . . 33
6.4 Experiment 1: Quality of Triplets . . . 34
6.5 Experiment 2: Embedding Error . . . 37
6.6 Experiment 3: Necessary Amount of Triplets . . . 38
7 Perceptual Similarity Evaluation on a Country Flags Dataset 42
7.1 Experiment Setup . . . 42 7.2 Results. . . 43
8 Experiments on Food Images 46
8.1 Similarity Retrieval . . . 46 8.2 Embedding Construction. . . 47 8.3 Searching in Embedding . . . 51
9 Conclusions 55
Chapter 1
Introduction
Human beings have five traditional senses giving them an opportunity to distinguish things, which the machines cannot. Although the machines are nowadays able to process audiovi-sual information at a decent level, they do not cope with properties as a taste or a smell. But if they did, it would open the door to a number of new approaches how the machines could be helpful and useful for humans.
As an example we may consider food. People are able to distinguish between different types of food nearly perfectly on the basis of their taste, and they group meals which taste similar together somewhere inside the brain. If such human is familiar with tastes of multiple types of food, this grouping process creates a virtual distribution of different types of food in the human’s brain.
On the opposite side, there are machines, which are nowadays able to process the visual information of the meal, but they do not obtain any information about the taste without human assistance. However, if they are somehow given this information, they could model the distribution of different types of food in a similar way as the human brain does. This step of the information exchange is not trivial and it requires some investigation in methods, how to do this exchange effectively, which is the subject of this work.
In this thesis I examine ways how to compare objects on the basis of their perceptual similarity in order to obtain the structural information among them. This structural infor-mation is subsequently transformed to a generally multi-dimensional space, in which more similar objects should be placed close to each other whereas the less similar ones far apart. Such space then serves as a guideline for the searching algorithm, which also involves hu-mans to the searching process. Since the cooperation with huhu-mans is in this system widely used, the particular focus is placed to efficiency and low-cost solution of the interaction with them.
The aim of the research, developed software, and conclusions described in this thesis was to extend the Visipedia project, which is introduced in Chapter2. In Chapter3 there is introduced crowdsourcing, benefits of its usage, its types, and on-line services, which were also used for some experiments. Chapter 4 is dedicated to algorithms for embedding learning and methods of navigating through the space of embedding. In Chapter 5 there are defined some fundamental terms used in this work and there are presented approaches of getting objects similarities from users. Experiments on a toy dataset of US and Canadian cities, dataset of country flags, and a food image dataset respectively are described in the chapters 6,7, and 8. The summary of achieved results and possible directions of a future work are presented in Chapter9.
Chapter 2
About the Visipedia Project
The idea of the project Visipedia dates back to the year 2009, when Pietro Perona presented his thoughts in the paperVision of a Visipedia [16]. As Wikipedia is based on text articles with connections to another related articles, the aim of Visipedia is to be an analogy focused towards the images. Although the word Visipedia stands for “Visual Encyclopedia”, it is not literally an encyclopedia but rather a layer on the top of Wikipedia (or generally any other knowledge database).
This chapter presents reasons which led to this project. It briefly introduces the Visi-pedia project reviews it’s architecture and points out some remarkable and unique features of this system.
2.1
Motivation
Imagine this example: You see a mushroom during a stroll and the questions like “Can I eat it?”, “Should I pick it up?”, come into your mind. If you are not familiar with mushrooms, you will not recognize the species of the mushroom you see and therefore you do not know if you can eat it. If you started to browse the web pages about mushrooms on your cell phone in order to find the particular species, it could take a long time. On the other hand, if there was such a system as Visipedia, you could grab a picture of the mushroom, upload it to the Visipedia system as a query, and hopefully you would be redirected to the Wikipedia page of the mushroom species you are looking at.
This is just a simple example, but using just image information is not always easy or possible for several reasons: The state of the art of computer vision and machine learning does not allow to reliably classify objects on a picture and also there may be another features that cannot be extracted directly from an image. Either can be hidden or not capable to be captured by camera (e.g. volume information, smell, hardness, etc.). Although there are some methods how to improve the amount of captured information (supplying video sequence instead of a single picture, using stereo cameras, structured light, or using other detectors), for some tasks the system still requires cooperation with humans.
2.2
Visipedia Concept and Design
Such a project as Visipedia that would simplify searching, indexing and linking the parts of images cannot be done by individual or a small team. It rather involves a cooperation of
VISIPEDIA Images, segments annotations, links, GUIs, diagnostics Users Annotators
Image databases Vision
scientists Experts
Automata
Figure 2.1: The Visipedia system connects together users sending queries to the system, pages like Wikipedia as a source of information, available image databases for training data, human domain experts providing knowledge, crowd workers for annotation tasks and computer vision and machine learning systems. 1
many experts from different fields. That is the reason why Visipedia has been designed to be open to public. Anyone will be able to participate in this project by creating software augmenting the functionality, uploading and annotating images, etc. in order to improve the level of automation as much as possible and hence save a human labor.
As previously mentioned, it is not yet possible to build automata that would carry out all this job, therefore the concept of the system proposes interaction with 5 groups of people: Theusers benefiting it while looking for a useful information using queries,domain experts
willing to share results of their research and providing basic knowledge, non-experteditors
helping with data cleaning, crowd workers used for annotation and other mass work and
automation experts providing computer vision and machine learning support. The concept of Visipedia system is summarized in Figure2.1. The approach that combines automation and human labor is called “humans-in-the-loop”.
To make such idea working, it is necessary to process each input image and gather as much information as possible from it. Since the system works also with humans providing needful information which can be again used by automata, the image processing has to be performed iteratively. Then the default Visipedia pipeline consists of the following steps:
1. Image upload,
2. automatic image processing – saliency detection, meaningful feature measurement, and decomposition to sub-tasks,
3. distribution of sub-tasks to appropriate system parts (automatas or human resources), 4. collection of the results from sub-tasks and its processing
5. go to #2.
Besides human resources and automata parts the system is designed to be connected with Wikipedia and other similar knowledge databases, that can be used as a source of
information and also for example Wikipedia pages can be associated with corresponding images or its parts. This would allow Visipedia users to access the information they are looking for quickly and directly from their supplied image.
2.3
Relation to the Thesis
As I pointed out, Visipedia is the image oriented project. It performs a wide range of different tasks with images like segmentation, classification, annotation, etc.
Taking into account classification part, Visipedia does not aim only to classification or clustering into groups, but there is also an effort to support fine-grained categorization, where the objects are not just a part of a particular group, but rather they are placed into a multi-dimensional space according to their similarity.
“Classification” of non-taxonomically related objects is a continuous function, that as-signs coordinates of multidimensional space to the input objects, is called embedding. Po-sition of objects in embedding is determined by their similarity: more similar objects are located closer together in the embedding. In the case of this thesis a special focus is placed on perceptual similarities.
Chapter 3
Crowdsourcing
Crowdsourcing is a technique how to distribute some work to a large amount of generally anonymous workers in order to obtain and merge their contributions. This practice has been used especially in on-line community. The word “crowdsourcing” arose in 2005 as a combination of words “crowd” and “outsourcing”. The main idea is to divide a complex task into several subtasks that often repetitive and time-consuming. The individuals working on such tasks as volunteers or part-time workers are usually rewarded for their work and hence this cooperation is mutually beneficial.
Definition. An integrating definition of crowdsourcing was developed by Enrique
Estellés-Arolas and Fernando González Ladrón-de-Guevara [7]:
“Crowdsourcing is a type of participative on-line activity in which an individual, an institution, a non-profit organization, or company proposes to a group of individuals of varying knowledge, heterogeneity, and number, via a flexible open call, the voluntary undertaking of a task. The undertaking of the task, of variable complexity and modularity, and in which the crowd should participate bringing their work, money, knowledge and/or experience, always entails mutual benefit. The user will receive the satisfaction of a given type of need, be it economic, social recognition, self-esteem, or the development of individual skills, while the crowdsourcer will obtain and utilize to their advantage that what the user has brought to the venture, whose form will depend on the type of activity undertaken”.
This chapter summarizes benefits and various use cases of crowdsourcing. There are also presented existing applications in this field, which were used for some experiments in this work. This chapter also summarizes ways and benefits of crowdsourcing usage in machine vision.
3.1
Crowdsourcing Types
Crowdsourcing has already been developing for several years and there has emerged various direction of its exploitation. Some of the most important and expanded are presented in the following list:
• Crowdfunding is the collection of finance to support projects or realize ideas. Con-tributors are people who usually provides a small amount of money voluntarily or in
exchange for some benefits from such project The goal for requesters is to reach a target amount [3].
• Crowdvoting is a type, where the “crowd” is asked about a judgment or an opinion on some topic. This method is usually used to organize or rank some content as photos, articles, etc.
• Language-related data collection has been used for collecting translations for dictio-naries or to refine translations in services as Google Translator.
• “Wisdom of the crowd” is a process where multiple individuals are asked for an opinion rather then a single expert. The collection of answers is very often followed by their aggregation and processing to a final result. It is advantageous in many cases, because the answers of the crowd are usually as good as (and often even better than) the answer of the best individual from the group [26].
• Makrowork is a type of crowdsourcing where the workers are called to do some more complex work, which can require special skills. It can be for example some indepen-dent part of a large project or some specialized task.
• Microwork is a type where a requester divide the complex problem into a large number of simple, repetitive tasks, that also unskilled workers are able to work on them. It usually takes a couple of seconds or minutes to solve the task and hence these tasks are low payed.
• Implicit crowdsourcing can be represented by a software that serves primarily to a different purpose (at least from the crowd’s point of view), but on the background it collects information about users’ actions and profits from it. Some computer games or ReCAPTCHA [19,20,21] are examples of such software.
3.2
Reward
The important part of the crowdsourcing is to motivate workers to work on the crowdsourced tasks. Crowdsourcing services can be divided on the basis of the type how the workers are rewarded. There are some approaches which have been put into operation and which are interesting for a certain group of people.
Entertainment. The typical example of this category are computer games, which collects
some useful data depending on users’ actions while enjoying the game. The first example of this design was ESP game [19] originally aimed to image labeling. Games of this type are generally calledgames with a purpose (GWAP) [20].
Altruism and citizen science. Both of those cases are very similar, especially from
crowdsourcing point of view. People participating in these tasks are self-motivated for whatever reason to work on (sometimes challenging) tasks in order to “help a good thing”. In particular, citizen science is a scientific research conducted by amateur, enthusiast scien-tists. The interesting fields for amateurs are for example ornithology, astronomy or modern technology [22].
Financial reward. A complementary approach to the voluntary ones is a financial moti-vation of workers. Since workers are in this case paid for their contributions, it is necessary to watch over the quality of their work, otherwise the answer gathering process becomes expensive and ineffective. However, several ways how to assure quality are discussed in Section3.5.
3.3
On-line Tools and Services
Since the main domain of crowdsourcing is on-line community, there are several web-based services with different level of generality and different specialization offering a crowdsourcing solutions. Furthermore, this work is focused on perceptual objects similarities, so some experiments described in this work are based on humans’ responses. They fit to category
microwork and therefore they take advantage of crowdsourcing.
Amazon Mechanical Turk (MTurk) is a well-known platform for task crowdsourcing with hundreds of thousands workers on demand, which also provides an API for faster deployment and management. Rights therefore all crowdsourced tasks in this works were deployed on MTurk. Since the financial reward is only way how to reward workers on MTurk, a part of the thesis aims to explore effective ways of answer retrieval from workers. Another software used in this work is a SaaS (software as a service) application called
Visipedia: Crowdwork, which cooperates with MTurk, and which provides an interface for simple tasks creation and management. Both of these applications are described more in detail in the following sections.
3.3.1 Amazon Mechanical Turk
Amazon Mechanical Turk (MTurk)1 is a marketplace for crowdsourcing tasks, that allows
individuals or businesses to outsource tasks, that computers are unable to do, to human workers. Although MTurk falls according to its main specialization to categorymikrowork, its API makes it a very universal platform, that allows developers to use it flexibly according to their requirements.
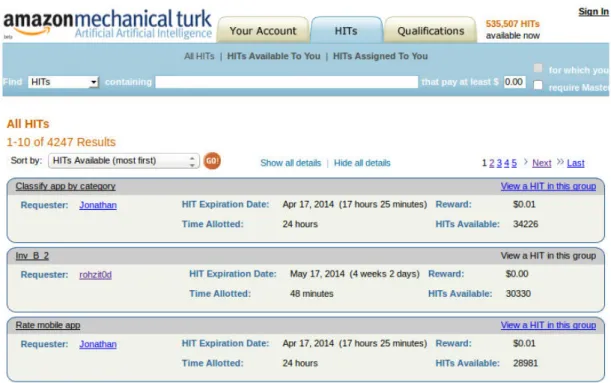
MTurk is also one of the biggest on-line marketplace. Indeed, hundreds of thousands HITs are available on MTurk at any time and there were registered more than 500 000 workers from over 190 countries in January 2011. Using some monitoring and quality assurance techniques is can be also consider as a source of inexpensive and fair-quality data from the crowd [15,5]. MTurk recognizes two groups of participants: Requesters and
workers. A default unit of work (a task deployed to MTurk) is calledHuman Intelligence Task (HIT).
Requesters are individuals or businesses who create and deploy HITs to the market-place in order to let workers the solve them. Requesters also specify the wage, which a worker receive when she complete the HIT, and Amazon collects 10% commission on top of the specified reward. Requesters can also specify the number of assignments for each HIT (number of redundant HITs displayed to different workers), which allows synthesis of opinions and which is also useful for quality assurance. Another possibility how to assure high quality of responses is to apply qualification criteria. Only workers who are qualified for certain HITs, may start to work on them. MTurk offers a couple of pre-prepared qual-ification criteria like country of residence, minimal number of completed HITs, percentage
1
Figure 3.1: Screenshot of MTurk workers interface, where they can browse, preview, and accept HITs.
of accepted HITs etc., but it is also possible to create a custom qualification criteria. There are two possibilities for requesters how to deploy their tasks on MTurk: Using MTurk wizard or using MTurk API. In the first case a requester can simply create a HIT using MTurk website and supplying HTML code of the interface presented to workers. This way is probably in most cases easier then using API, but it is not so flexible, because all HITs have to be created manually, whereas using API allows system developers to deploy tasks to MTurk automatically. There are several, either official or unofficial SDKs for different programming languages as PHP, Python, Ruby, Perl etc. [2]
Workers are able to browse the HITs and work on them in case they meet the qualifi-cation requirements. When they decide to accept a HIT, a HIT assignment is allocated for them for a specific time period, within which they have to submit the HIT. If they decide not to complete the HIT they can return it and it is offered to other workers. For any HIT which they complete and which is accepted by the requester, they obtain the specified reward. A screenshot of MTurk workers interface is in Figure 3.1.
MTurk offers two modes of their system: Production and Sandbox mode. Production mode is the one where workers complete tasks and get paid for their work, whereas Sandbox mode is a testing environment – a copy of the production system, where no charges are applied. It serves developers to test there their software using MTurk API, and requesters and workers to familiarize with the interface.
3.3.2 Visipedia: Crowdwork
Collecting contributions from crowd workers is not as fast as it could could be. It often entails setting up server-side database and software, creating user interface, assuring workers competency, etc. All these time-consuming subtasks are usually carried out over and over
(a) Requester environment
(b) Worker environment
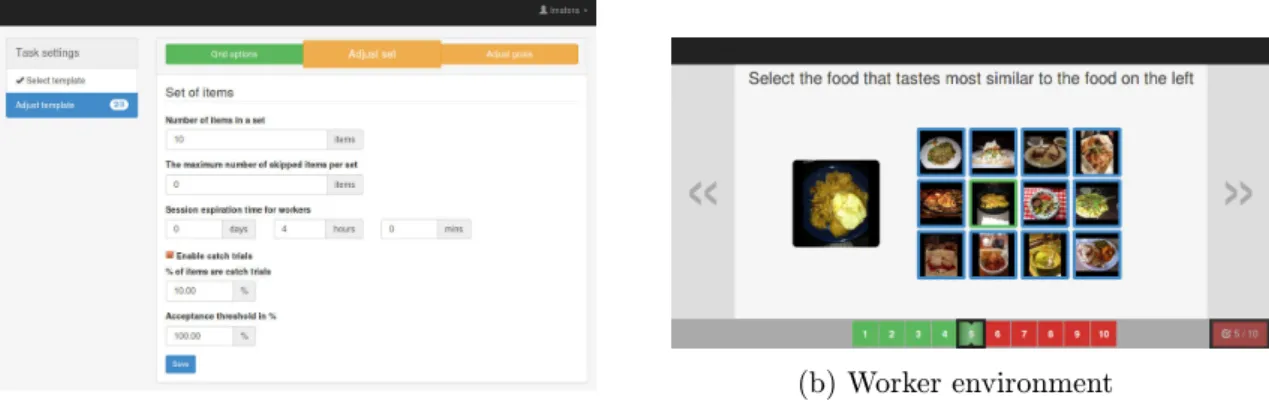
Figure 3.2: Screenshots from Visipedia: Crowdwork application showing environments for requesters and for workers.
again when it is necessary to crowdsource any new type of task, although the majority of such subtasks is each time almost identical. This was an inspiration to create application
Visipedia: Crowdwork [14], that makes all these steps easier. The advantage of being incorporated into Visipedia system is that it uses unified Visipedia account management and the image resource service.
This crowdsourcing task manager is designed as Software as a Service (SaaS) running on top of Amazon Web Services and it allows requesters to set up their tasks and deploy them to crowdsourcing services as MTurk in “a few clicks”. The idea of this manager was to make as universal and reusable as possible the whole process of task setup and to allow users to extend the functionality by implementing their interface.
The manager is divided into two separate parts: Requester environment and Worker environment. The requester environment consists of setting form where she can select and adjust a template (a layout which will be displayed to workers) specify task goals as number of answers or a time period, create catch trials and deploy the tasks to MTurk. The requester environment also shows statistics about workers activity and supports browsing and exporting the contributions. The worker environment displays the selected template to workers and allows them to solve the task. It also handles navigation between screens and implements extra functions such timers or onboarding tutorials. Screenshots from these two environments are displayed in Figure3.2.
3.4
Cost Estimation
When deploying some task to a crowdsourcing service with financial reward, it is always necessary to determine the reward for a work unit (HIT) and estimate total costs. According to several forums2 3 4, the optimal reward, when workers consider HITs as “worth turking
for”, is between $4-6 per hour.
Another interesting fact discovered authors of [13] when they figured out then higher reward increases quantity but has minimal impact to quality of work. In other words the
2 http://www.reddit.com/r/HITsWorthTurkingFor/ 3 http://turkernation.com/showthread.php?8027-Must-read-for-turkers! -Guideline-for-requester-pay 4 http://www.mturkgrind.com/forums/8-Hits-Worth-Turking-For
time necessary to solve certain number of HITs decreases with higher reward but the quality of work remains nearly constant.
3.5
Quality Assurance
Since the workers working on crowdsourced tasks are generally anonymous and such task is not assigned to some particular worker, where the requester would know her capabilities, and as well there are also potentially bad workers still around trying just to earn some money regardless of the quality of their work, it is necessary to assure, or at least evaluate the relevance of workers’ contributions. Although this section is mainly focused on sev-eral approaches how the quality of answers can be evaluated or measured, there are also mentioned ways of preliminary workers selection.
Qualifications. Some crowdsourcing services (e.g. MTurk) offer system of qualifications
to filter out ineligible workers before they start to work on tasks. Workers can be classified on the basis of country residence, number of submitted tasks, its approval rate, etc. Such qualification systems are often specific for particular crowdsourcing marketplaces, however, it is very advantageous to use them.
Redundant answers. Instead of assigning a particular task to just one workers, it is
assigned to multiple workers and then their answers are somehow synthesized. Depending on the particular use case it can be taken the average from the answers, the highest-voted answer or the answer selected by a reviewer. The drawback of this method is the costs growth in direct proportion to the number of redundant tasks.
Repetitions. Repetitions are appropriate especially in tasks composed of a larger number
of small subtasks of the same type. The principle of repetitions is to present to a worker multiple times some of these subtask and subsequently compare her answers. Although such subtasks do not have to look exactly the same, it is essential to ask the worker for the same thing multiple times. Basically, it is a measurement of intra-class variation of redundant answers.
Catch trials. Catch trials, also known as Gold standard, are intentionally created
sub-tasks, where the answer is indisputable and defined a priori. Once a worker submits her answers for a catch trial, the quality of her answer can be determined by comparison with the predefined one. As well as repetitions, catch trials are also beneficial primarily in tasks consisting of a several subtasks.
3.6
Crowdsourcing in Machine Vision
Many tasks and solutions in machine learning and computer vision involve training and testing on large annotated datasets of various type. Basically, these tasks fall into two groups according to the employment of workers. The tasks from the first group are com-pleted by workers “off-line”, whereas in the case of the second one (“on-line”), the human workers are involved directly in the system.
Annotation tasks. In many cases the annotation tasks of datasets does not require do-main experts but rather a large number of workers who might be also unskilled in the field. As examples of such tasks can be mentioned image segmentation, written text transcription, labeling, etc. The usage of crowdsourcing is in these cases very convenient, advantageous, and sometimes almost only way how to gather sufficient amount of annotations for a reason-able price. ImageNet [6], which is a database of more than 11 million images hierarchically organized, and CUB-200 [24] of 6000 birds of 200 species are examples of datasets, where the crowdworkers were used to annotate images by segmentation, bounding boxes and binary attribute annotation.
Systems with humans-in-the-loop. A different approach, how the crowdworkers can
be useful, is to involve them directly in the pipeline of a computer vision system [22]. Workers can be employed for different stages of the pipeline, for example during model learning, classification, detection, feature extraction etc. Then the system is continuously processing their contributions on a basis of which it adapts its future behavior. This type of system architecture is a fundamental pillar of whole Visipedia project.
Chapter 4
Data Embedding
Data embedding is a traditional problem in many fields including mathematics, machine learning, data mining, etc. In the field of machine learning, it falls into theManifold learning
category, which represents a group of unsupervised or semi-supervised methods aiming to reduce the dimensionality of the data preserving the important features. In particular, it is an approach to non-linear dimensionality reduction. Dimensionality reduction is often required in terms of machine learning, either for intuitive data visualization or for reduction of memory and computational requirements [11].
In the first part of this chapter there is defined the term embedding and there are re-viewed existing algorithms for data embedding construction. These methods are compared among themselves as well as in the terms of perceptually similar data modeling. In the second part of the chapter there is reviewed an existing method, which allows navigation and searching in the space of embedding.
Although data embedding comes from the effort of dimensionality reduction with min-imization of error, the dimensionality reduction is not always necessary. In other words, data embedding is generally a projection of input objects intod-dimensional space. Tradi-tional approaches used in machine learning such as linear discriminant analysis (LDA) or principal component analysis (PCA) are special types of data embedding.
Definition. Given a set of inputs Z = {z1, . . . , zn} and the number of dimensions d,
embedding is the map Z →Rd. Specifically, we define embedding as a matrix
E= x1,1 x1,2 · · · x1,d x2,1 x2,2 · · · x2,d .. . ... . .. ... xn,1 xn,2 · · · xn,d , (4.1)
such that ith row in the matrix E corresponds to the vector of coordinates of input z
i in
the embedding.
4.1
Techniques to Learn Data Embedding
Lot of research has been done and a several algorithms has been proposed in the field of data embedding. There are two main approaches which these algorithms follow:
• Top-down approach is based on a distance (dissimilarity) matrix of input objects regardless of their dimensionality. Methods based on this approach try to place objects into multidimensional Euclidean space with respect to the constraints arising from the distance matrix. It does mean that those methods try to (relatively) preserve distances by minimizing the total error.
• Bottom-up approach uses information of local neighborhood of input objects and consolidates it in order to derive the global structure. There are often used local coordinates, distances, or weighted linear combination of surrounding points as a source of local information.
There are presented algorithms using either of these approaches. 4.1.1 Multi Dimensional Scaling (MDS)
Also known as Euclidean embedding, is a classical metric embedding method which has been used as a technique for analysis of data similarity or dissimilarity on a set of objects. It is a process of visualization of the given distance matrix. MDS algorithm places each object from the set intod-dimensional space, where the number of dimensionsdis specified a priori [4].
Input of this method is a distance matrix∆of set of objectsZ ={z1, . . . , zn}, on which
a distance function is defined asδi,j :=distance between objects zi and zj.
∆= δ1,1 δ1,2 · · · δ1,n δ2,1 δ2,2 · · · δ2,n .. . ... . .. ... δn,1 δn,2 · · · δn,n (4.2)
is subject toδi,i= 0,δi,j =δj,i.
The goal of the algorithm, given a matrix ∆and a number of dimensiond, is to findn
vectors
x1, . . . ,xn∈Rd, such that ∀i, j∈1, . . . , n:kxi−xjk2 ≈δi,j. (4.3)
One possible and also quite common way how to determine these vectors, is to formulate it as an optimization problem. For example
min
x1,...,xn
X
i<j
(kxi−xjk2−δi,j)2. (4.4)
This algorithm does not allow neither infinite nor missing distancesδi,j, which makes this
method not appropriate in applications, where the distance magnitudes are not available, unreliable or too difficult to measure.
4.1.2 Non-Metric MDS (NMDS)
This non-metric modification of MDS tries to break away from distance magnitudes and it uses only a provided set of order relations [1]. Such formulation leads to the problem also calledShepard-Kruskal Scaling. Given a distance matrix ∆and a number of dimensiond, find vectors
The algorithm that solves Shepard-Kruskal Scaling problem is based on minimization of the stress-1 functional
σ1(E) = min θ P i,j(kxi−xjk2−θ(δi,j))2 P i,jkxi−xjk2 , (4.6)
whereθ(·)is an arbitrary monotonic function. The minimization is performed with respect to the embedding E.
Although this method might seem to be more useful for a data with unknown distance magnitude, there are some issues which make it barely usable: The method requires all order comparisons, which can be sometimes really difficult if not impossible to provide. Although the NMDS concerns just about ordinal information, it still needs a distance matrix ∆ on its input. The process of perceptual properties retrieval cannot meet these requirements easily, therefore also this method is not very suitable.
4.1.3 Generalized Non-Metric MDS (GNMDS)
This algorithm was developed to get rid off completely the dependency on the distance matrix and it uses just the paired comparisons instead [1]. That was formulated to the problem called Paired Comparisons, which is derived from the Shepard-Kruskal Scaling
problem.
Given a set of quadruples S, find E=x1, . . . ,xn|xi∈Rdsuch that
(i, j, k, l)∈S ⇐⇒ kxi−xjk2≤ kxk−xlk2. (4.7)
Algorithm review. The algorithm solving the previously mentioned problem has been
proposed and described in [1]. This is just its brief review. LetS to be a set of quadruples
(i, j, k, l). The algorithm aims to find an embedding E=x1, . . . ,xn such that
kxi−xjk2≤ kxk−xlk2, ∀(i, j, k, l)∈S (4.8)
The algorithm finds a Gram matrixK=ETE and tries to minimize its rank by trace-norm minimizing. The advantage of this method is that it accepts inconsistencies in the set of input paired comparisons. In order to allow inequality violations, it introduces a slack variable ξi,j,k,l for each inequality constrain and the objective of algorithms solving this
problem is to minimize the total amount of slack. In order to accommodate the algorithm to users demanding low-dimensional embedding, there has been added the regularizerλhas which trades-off the embedding complexity with the total slack. The above results to the program min K, ξi,j,k,l X (i,j,k,l)∈S ξi,j,k,l+λTrace(K) (4.9)
subject to kk,k−2kk,l+kl,l−ki,i+ 2ki,j−kj,j ≥1−ξi,j,k,l,Pabka,b= 0,K0.
4.1.4 Crowd Kernel Learning (CKL)
The motivation to introduce CKL system was an effort to make available data embedding and learning algorithm deployment on a specific domain without assistance of machine learning researcher. Given a set of triplets, the CKL algorithm learns a similarity matrix
over all n2 pairs [17]. It introduces probabilities that are inversely proportional to the quality of triplet modeling [18]:
pi,j,l =
ki,i+kj,j−2ki,j+µ
(ki,i+kj,j−2ki,j) + (ki,i+kl,l−2ki,l) + 2µ
, (4.10)
where µ servers as a regularizer preventing numerical problems. The kernel is learned by empirical log-loss minimization:
min
K
X
(i,j,l)∈T
log(pi,j,l) subject to ∀i:ki,i= 1,K0. (4.11)
The gradient descent method is used for CKL learning and the resulting embedding is obtain by singular value decomposition of kernelK.
Besides the algorithm for embedding construction, this system also introduces a method of adaptive triplet selection, which uses a history of user’s answers on presented triplets and selects the most informative triplet, that maximizes information gain to be presented to the user. Since this process become computationally expensive for a larger datasets, the approximation consists of the selection of the best candidate from a randomly sampled subset.
4.1.5 Stochastic Triplet Embedding (STE)
Stochastic Triplet Embedding is another method for embedding construction, which is more local than previous ones. More specifically, it gives nearly constant rewards to triplets that are satisfied with a large margin and nearly constant penalties to large triplet violations [18].
The methods defines probabilities
pi,j,l =
exp(−kxi−xjk22)
exp(−kxi−xjk22) + exp(−kxi−xlk22)
(4.12) which measure the probability that the triplet (i, j, l) is satisfied. Given a set of training tripletsT, the program aims to maximize log-probabilities over all supplied triplets:
max
E
X
∀(i,j,l)∈T
logpi,j,l. (4.13)
Such program is a convex optimization problem and can be solved by gradient descent or by singular value decomposition using trace-norm regularizer to minimize the rank of the kernel matrix.
t-Distributed STE (t-STE). This modification of classical STE has been proposed due
to a too rapid decline of gradient, that makes hard to fix errors made in the beginning of the optimization process. This led authors of [18] to propose another, heavy-tailed Student-t kernel withα degrees of freedom. Then the triplet probability is defined as
pi,j,l = 1 +kxi−xjk22 α −α+12 1 +kxi−xjk22 α −α+12 +1 +kxi−xlk22 α −α+12 . (4.14)
d(x1, x2) > d(x1, x3) > 0 10 10 0 d(x1, x2) > d(x1, x3) > 0 10 10 0 d(x1, x2) > d(x1, x3) > 0 10 10 0 d(x1, x2) > d(x1, x3) > 0 10 10 0 d(x1, x2) > d(x1, x3) > 0 10 10 0 d(x1, x2) > d(x1, x3) > 0 10 10 0 d(x1, x2) > d(x1, x3) > 0 10 10 0 d(x1, x2) > d(x1, x3) > 0 10 10 0 d(xi,xj) d ( xi , x` ) d ( xi , x` ) d(xi,xj) d(xi,xj) d(xi,xj) GNMDS CKL STE t-STE x x x x @O @xj x x @O @x` −1 −0.8 −0.6 −0.4 −0.2 0 0.2 0.4 0.6 0.8 1 pu ll pu sh
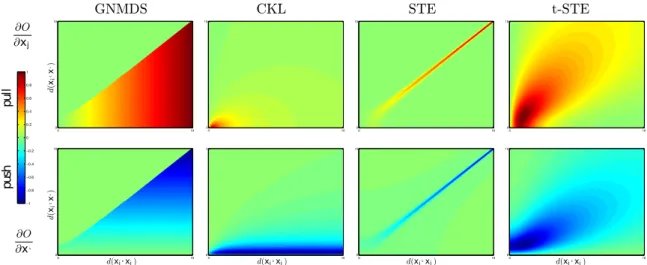
Figure 4.1: Partial gradients induced by a triplet constraint for methods GNMDS, CKL, STE a t-STE. Given the triplet (i, j, l) of input points zi, zj, zl, on every image the short
edge distance kzi−zjkis on axisxand thelong edge distancekzi−zlkon axisy. The
top-left region indicates a constraint satisfactionkzi−zjk ≪ kzi−zlk, the bottom-right region
indicates a strong constraint violation kzi−zjk ≫ kzi−zlk. The bottom-left to top-right
diagonal indicates the equality betweenshort edge andlong edge kzi−zjk ≈ kzi−zlk. The
top row shows the rate (the redder the higher) of pulling zl apart fromzi and the bottom
row shows the rate (the bluer the higher) of pushingzj towardszi. 1
Using such heavy-tailed function as Student-t kernel is more advantageous than “stan-dard” kernels. Given a triplet (i, j, l), t-STE decreases distances between xi and xj and
analogically increases distances betweenxi andxl even if the constraint is already satisfied.
The result of such a behavior is that it collapses points unless there is a triplet keeping them apart. Similarly it separates points unless there is a triplet keeping this points together. 4.1.6 Comparison of Previously Reviewed Methods
In previous section there were reviewed common algorithms used to build data embeddings. Each method has different properties, advantages, and disadvantages, and is suitable for different input data. This section is focused on comparison of those methods according to different criteria. At the end of this section, there are selected methods, which are potentially useful to work with perceptually similar data.
There can be observed two groups of methods according to data required on their inputs. First group is formed by methods MDS and NMDS that requires a complete matrix ∆of pairwise distances between objects from the input set. (Although NMDS uses just the ordinal information.) The second group consists of GNMDS, CKL, (t-)STE requiring on the input a set of paired distance comparisons. In particular, all these methods accept on its input a set of triplets T.
If we consider that the input data are perceptually similar objects, where the exact dis-tances between object cannot be neither measured nor exactly determined, we can exclude the first group (MDS and NMDS) from future considerations.
The next comparison shows how the particular methods move the points inside embed-ding when a triplet is presented. If we look to Figure4.1, we can see that different methods
(a) GNMDS (b) CKL
(c) STE (d) t-STE
Figure 4.2: Comparison of embeddings created by different methods.
put similar objects together or pull apart in different ways. If we look in detail to each method, we can observe this behavior:
GNMDS. This method moves the points just when the triplet constraint is violated and
ignores cases when the triplet constraint is already satisfied. The gradient is linear along the axes in lower right triangle, which is why the method does not care much about the number of short or long edges between two particular points and it just tries to enforce triplet constraints. This leads to a quite uniform distribution of points in the embedding.
CKL. CKL method suffers a similar problem as GNMDS, however, the gradient decrease is not so rapid. Also the gradient is large only when a triplet is strongly violated. This means that CKL is concerned with correcting only strongly violated triplets.
STE. In contrast to CKL, STE gradient converges to zero for both strong constraint violations and strong constraint satisfaction. This implies that it does not tend to correct strong violations and thus it is resistant to triplets contradicting the consensus. On the other hand, the gradient decreases too rapidly, which makes hard for the method to correct errors made in the beginning of the optimization.
t-STE. Unlike the previous methods, t-STE gradient looks different and it has several good properties. The gradient is large even for already satisfied triplets, so given an already satisfied triplet, it tends to collapse points on the short edge and to separate points on the
long edge. Another quality of t-STE is that the gradient is around zero in the region, where triplet constraint is strongly violated. That handles a noise in data because it does not try to satisfy such triplets that contradict consensus.
4.2
Navigating Through the Space of Embedding
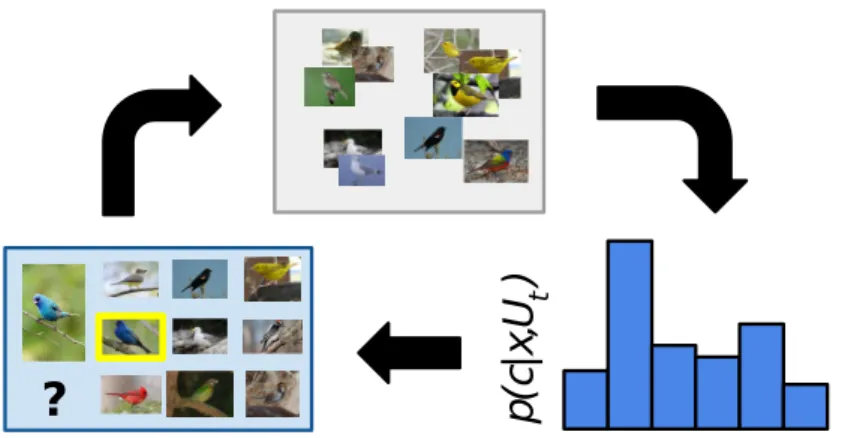
Imagine a situation when a user is considering some particular category of objects and her task is to find an image in a dataset that matches this category. Such type of tasks falls into groupQuery-by-Example. Suppose that there is a sufficiently large set of images that contains, among others, a relatively small subset of images that match user’s target category. The user is continuously presented a screen with few images and she is supposed to select one of those images until some of the presented images matches the target category. The Statistical Framework for Image Category Search from a Mental Picture aims to optimize selection of the images presented to a user until she is given an image from her target category. This searching process should be, hopefully, done in a few rounds [9]. The core of the framework is a statistical model for relevance feedback. The session starts with a random screen of images and in each iteration the user is supposed to select the image from her target category when such image is displayed or the image that is closest to the category in case that no image from the category is displayed.
4.2.1 Statistical Framework
Formally let Z = {z1, . . . , zn} be a dataset of objects and S ⊂ Z a target category. Let
also Dt be a set of m images displayed in round t. It is supposed that if D∩S 6= ∅ the
user identifies zk ∈ S and the algorithm terminates. Otherwise it is supposed that the
user selects image that is according to her metric “the closest” to S. There is a binary variable yk associated with every image zk ∈Z, such that yk= 1 when zk ∈S and yk = 0
when zk∈/ S. The framework maintains a response model for eachiand updates posterior
distribution on yk after each feedback iteration. Let Bt denote the user responses for the
firsttrounds. Thenpt(k) =P(yk = 1|Bt)is a parameter that represents distribution ofyk.
Since the images in the first round are taken randomly, thenp0(i) = 0.5. There are three
principal components in the statistical model.
Update model. Let XDt be a user’s response to a set of displayed images Dt. Update
model computespt+1(k)given pt(k) and XDt.
pt+1(k) =P(yk= 1|Bt+1)
=P(XD =i|yk= 1, Dt+1=D)pt(k)/Ct+1
=p+(i|k, D)pt(k)/Ct+1,
(4.15)
where the normalizerCt+1=p+(i|k, D)pt(k) +p−(i|k, D)(1−pt(k)).
Answer model. Let D=Dt be the displayed set of images at iterationt. IfD∩S6=∅,
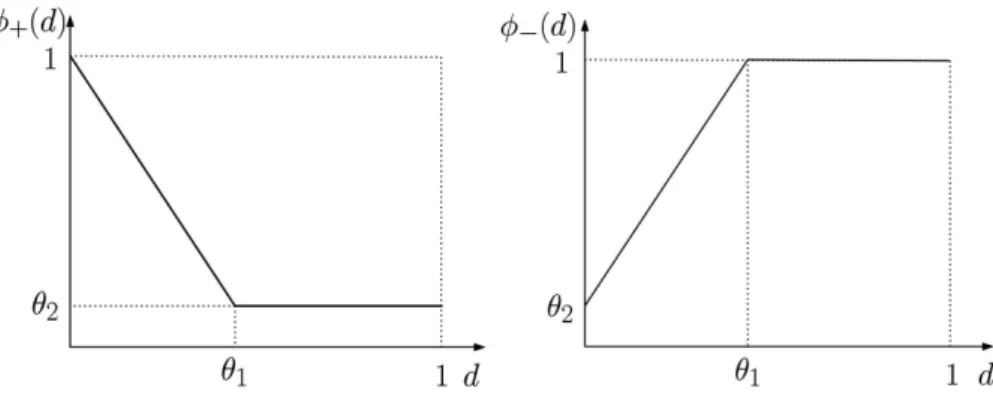
Figure 4.3: Shape ofφ+ and φ+ functions userd in answer model. 2
closest image to k according to user’s point of view. For some metric δ there is defined a positive and a negative model:
p+(i|k, D) =P φ+(δ(i, k)) j∈Dφ+(δ(j, k)) , (4.16) p−(i|k, D) =P φ−(δ(i, k)) j∈Dφ−(δ(j, k)) . (4.17)
The design of functions φ+ and φ− is based on the fact, that perceptual similarity of two objects is inversely proportional to their distance in metric δ and therefore φ+ is
monotonically decreasing and φ− monotonically increasing function. Figure 4.3shows the proposed functions as they are used in the framework.
The positive and negative functions introduce parameters θ1, which serves as a
thresh-old, from which the probability remains constant, and θ2 which controls the coherence
between normalized metric systemδ and user’s decisions.
Display model. Display model chooses which images to display for every round t. The
algorithm computing distance model assumes, that the user selects randomly one image i
from her tatget set S and uses this image i as a reference for all her responses. Since S
is random subset of Z and i is randomly chosen from S, the reference image is a random variable R. Then, given a search history and a new answerXDt+1, the derived formula to compute next display set is
Dt+1 = arg min
D⊂Z
H(R|Bt, XD), (4.18)
whereH(·) is the entropy.
This optimization problem requires looping over all mn
combinations and can become intractable for larger sets of input objects and therefore not practically useful. In order to solve above equation there is formed a Voronoi partition based on D and the metric
δ, which has cells of equal mass under the normalized pt(k) distribution over Ω. The
algorithm uses sequential method to construct display set D that approximates the cell centers from Voronoi partition. The whole procedure is described in [8].
2
Figure 4.4: An example of Voronoi partition of a set of images with 8 cells. The sizes of disks representing images are proportional to their mass. Each image in some cell is closer to the center of the cell (blue disc) than to any other center. The centers are images in the optimalD. 2
4.2.2 Parameter Determination
The positive and negative answer model depend on parametric functions φ+ and φ− and hence it is necessary to adjust parameters θ1 and θ2 for both models, which minimize the
difference between metric system and how the similarity is perceived by humans. Especially
θ1 and θ2 for the positive answer model have a strong impact on the performance of the
method. The meaning of these parameters is clearly explained in Figure4.3.
Determination ofθ1+(positive model) is based on statistical hypothesis test [9] in these steps:
1. Fixθ∈0.05,0.1, . . . ,1 to possible positive values of θ1+. 2. Choose randomly a target classS and its memberk∈S.
3. Select two imagesi, j /∈S such thatδ(i, k)≈θandδ(j, k)∈[θ,1]is chosen uniformly. 4. Present the summary of the target class S and the images iandj to the user asking her to select, which of the two images is closer to the target classS in her opinion. 5. Ask multiple users and repeat the previous steps for each user multiple times always
with different S, k, i, j. Considering two hypotheses
• H0: Theiand j images are equally close to the target image in user’s opinion,
the aim of this θ1 adjustment method is to select the highest value of θ, where the null
hypothesis is rejected at the 0.05 significance level. Let n be the total number of users’ choices for a θvalue and N(θ) the number of times when the users selected ias the closer image, then the significance levelp is approximated as
p(θ)≈1−Φ N(θ)− n 2 √n 2 ! , (4.19)
whereΦ(·)is the standard normal cumulative distribution function. Then the parameterθ1
is chosen as the highest number θ, where the matching pis closest to the 0.05 significance level.
The estimation of θ2 parameter assumes that given k∈ S and a display setD, a user
choosesi|δ(i, k)≈0fromDin case when all the otherm−1imagesj∈D, j 6=i:δ(j, k)≥
θ+1. AlsoP(XD 6=i|Yk= 1) = 1−p+(i|k, D), then θ2+∼= 1 m−1 1−p+(i|k, D) p+(i|k, D) . (4.20)
The procedure to collect data from users in order to estimate θ+2 follows the algorithm is taken from [9]:
1. Randomly choose a target class S from the ground truth and an imagek∈S. 2. Construct a display D for which there is an image i /∈ S with δ(i, k) ≈ 0 and the
other m−1 images are at leastθ+1 units away from kin the metric of the system. 3. DisplayDand a summary ofSand ask the user to select the image that in his opinion
is closest toS.
4. Record user’s decision: XD =i orXD 6=i.
5. Repeat these stepsp times for each user.
The authors of [9] also tried to estimate parameters for the negative answer model in the same fashion as for the positive model, but the results were very similar when they used uniform negative model with parameters θ1− = 0, θ2− = 1. They also tried another extensions as “No preference” option or allowing users to view target class S at any time, but none of these attempts improved searching performance.
Chapter 5
Ways of Getting Similarities
The first part of this chapter serves as an overview of terms used in the thesis. In the second part there are proposed methods which improve efficiency of similarity retrieval process. Some of the proposed methods refers to experiments presented in later chapters.
5.1
Term Definition
To prevent misunderstanding, there is presented a brief definition of each term.
Taxonomically related objects. It is a group of objects where it is suitable to perform
classification or fine-grained categorization into a fixed number of groups, because there have statically defined relations among subgroups. A particular example of such group is bird taxon. If we look into any ornithology book, we will very likely find there a taxonomy chart for birds. The hierarchy was specified by ornithology experts and it is static. Given a concrete bird, it is clear where to classify it. Such objects are called taxonomically related. The existence of taxonomic structure is suspended by a finite number of object classes.
Non-taxonomically related objects. Non-taxonomically related objects cannot be
classified into a fixed groups, even though there might be defined some hierarchy or re-lations among them. As a representative of such group can be mentioned food.
Classification. Also known as categorization. It is the process of object understanding.
The process itself refers to assignment of classes to input objects. Objects that fall to the same class are somehow similar. Objects, that can be classified have low inter-class distances and high intra-class distances. Animals can be consider as a representatives of such group, because there are methods in computer vision how to distinguish different species of animals.
Fine-grained categorization. It is similar to a classification, but the given objects are
very similar among them. Inter-class and intra-class distances are in this case very similar, so it is often hard to determine the correct class for a presented object without some external assistance. Bird taxon can be mentioned as a representative which is subject to fine-grained categorization.
p
(c
|x
,U
t)
?
Figure 5.1: Scheme of a humans-in-the-loop system. 1
Perceptual similarity. Perceptual similarity of some objects is based on its properties
that humans are able to perceive with their senses. The traditional human senses are sight, hearing, taste, smell, and touch. There is no way how to precisely measure these properties.
Physical similarity. In contrast to perceptual ones, physical properties can be precisely
measured using an appropriate measurement tool. On the basis of this measure, there can be also determined physical similarity.
System with humans-in-the-loop. System with humans-in-the-loop consists of the
software part, and the human workers. Its usage is beneficial in cases, where a tight cooperation with human is necessary. Such system works iteratively: It presents a query to users and waits for her answer. Once the answer is submitted by them, the system updates its internal state and presents another query if needed. A scheme of such system is displayed in Figure 5.1.
Input objects. LetZ ={z1, . . . , zn}be the set of all input objects and∆be the following
matrix of paired distancesδ(i, j) of objectszi andzj:
∆= δ1,1 δ1,2 · · · δ1,n δ2,1 δ2,2 · · · δ2,n .. . ... . .. ... δn,1 δn,2 · · · δn,n , (5.1)
whereδ(·)is a general metric function. In most cases in this thesis, there is used as a metric functionl2-norm, also known as Euclidean distance.
Paired comparison. Paired (or pairwise) comparison may refer to a process of selecting
one item from a pair of objects based on comparison with respect to some quantitative property.
In our case the term will be used for a process of comparing and sorting given two pairs of objects based on mutual similarity of objects in each pair, such that the objects in the first pair are “closer” with respect to some property, than objects from the second pair [1].
1
Formally, given input set of objects Z ={z1, . . . , zn} and some metric function δ, paired
comparisonπ can be defined as
π= (i, j, k, l)|δ(zi, zj)≤δ(zk, zl). (5.2)
Triplets and the triplet universe. Triplet is a special case of paired comparison. For a
paired comparison quadruple(i, j, k, l), there can be created a triplet placingi=k. Then, there is formed a tuple of 3 objects, where the first two objects are “closer” than the first and the third one [18]. Given input objects Z and metric function δ a triplet τ can be formally defined as
τ = (i, j, l)|δ(zi, zj)≤δ(zi, zl). (5.3)
Inside triplet(i, j, l), the pair(i, j) will be referred to as ashort edge and the pair(i, l) as a long edge.
Considering the definition of triplet and given set of inputs Z and its dissimilarity (distance) matrix ∆, let TΩ be a set of all existing triplets for the input set Z such that
do not violate triplet consensus with respect to the matrix ∆. The total number of such triplets can be expressed as
kTΩk=kZk · kZk −1 2 . (5.4)
5.2
Triplet Retrieval Efficiency
The first question that probably emerges in relation to triplet retrieval from human workers is something like: “How many triplets are necessary to create a good-quality embedding?”. It is apparent that, especially for a larger dataset, is impossible to ask workers about their judgment for the whole triplet universe (omitting the need of redundant triplets for quality assurance). Considering Equation5.4 for the size of triplet universe, it is obvious that its asymptotic complexity is O(n3)and hence the number of triplets grows cubically. For real
datasets containing thousands or more objects would be intractable to gather all triplets in this way.
This implies a need of some method to reduce the total number of triplets necessary for a good-quality embedding construction. In the following sections, there are proposed a concepts oftemplates andscreens, as well as a way how to use them in order to increase the amount of triplets produced from workers’ answers. Furthermore, there is a discussion about a required amount of triplets and the overview of algorithms usable for triplet selection.
5.3
Templates and Screens
The object similarity retrieval process from humans comprise a need to design an appropri-ate user interface. Using the implicit crowdsourcing for similarity retrieval would involve incorporation of the algorithm gathering similarities into some game or application, which would include a tight cooperation with designers of such games or applications.
Also in explicit tasks, where the workers are directly asked to solve some queries in order to gather similarities, there is still a need to present them the queries in a convenient way, such that the efficiency of similarity retrieval is maximal. The different types of these interfaces are referred to as templates in this work. Their usage will be demonstrated and compared using appropriate data – images. There will be presented two types of templates:
Triangle and Grid with a probe. The particular purpose of templates is to present input objects to workers in order to collect triplets from their answers.
Multiple-screen tasks. Most of similarity retrieval tasks are repetitive and in many
cases it is suitable (for quality assurance) to present to a worker multiple easy subtasks wrapped in a larger task. The termscreen is in this work used to define a single template with a task presented to a worker. HITs are usually composed of multiple screens which are also referred to as set of screens orset.
5.3.1 Triangle
The triangle template consists of three images placed in vertices of an equilateral triangle. Such template can be defined it as follow: Given a set of input objectsZ, let
T△ ={zi, zj, zk} (5.5)
be a triangle template where itemszi, zj, zk are items from the input setZ selected to the
triangle. See Figure5.2for an example of the triangle template.
The task for workers is to select the edge, which connects the most similar pair of images in triangle. Given the triangle template T and a dissimilarity function δ, the worker’s solution of the task S is defined as
Ssel(T) = (i, j)|δ(zi, zj)< δ(zi, zk)∧δ(zi, zj)< δ(zj, zk). (5.6)
In case of the triangle template, two triplets can be generated from each answer ob-tained from a worker. Suppose the templateTtriangle={zi, zj, zk} and the worker’s answer
Ssel(T) = (i, j), the set of triplets T∂ generated from this particular answer is
T∂={(i, j, k),(j, i, k)}. (5.7)
5.3.2 Grid with a probe
Grid with a probe is the second type of template presented in this work. It contains aprobe
– one image, which serves as a reference and a matrix (grid) of images. Formally, given a set of input objects Z, let
Tgp= (p, G, m) (5.8)
be a grid with a probe template, where G ⊂Z, kGk =m, m ≥2 is a subset of input set selected to the grid andp∈Z, p /∈Gis the probe. For an example of this type of template see Figure 5.2. There are two following types of tasks defined for the grid with a probe
template.
Selection task. In the selection task, the worker is asked to selectsimages from the grid,
that are most similar (or dissimilar) to the probe. Given the templateT = (p, G, m), where
G={zc1, zc2, . . . , zcm} and a dissimilarity functionδ, the selection task can be defined as
Ssel(T, s) =C, (5.9)
where C = {c1, c2, . . . , cs}, ∀i ∈ C,∀zj ∈ (G\C) : δ(p, zi) < δ(p, zj). Given a template
T, its selection Ssel(T, s) =C, and the setR={cs+1, cs+2, . . . , cm}, the triplets generated
from the selection are defined as a Cartesian product
(a) Triangle (b) Grid with a probe
Figure 5.2: Examples of templates.
in case of positive answers (most similar objects) or in case of the negative ones
T∂ =p×R×S. (5.11)
The amount of triplets generated per selection iskT∂k=s(m−s).
Ordering task. This type of task prompts worker to order images in the grid from most
similar to the less one with respect to the probe image. Given a templateT = (p, G, m), let
(G, <δ)be a total order on G, such that∀zi, zj ∈G:zi < zj ⇐⇒ δ(p, zi)< δ(p, zj). Then
(G, <δ) = zo1 < zo2 <· · · < zom and we denote (OG, <δ) = o1 < o2 <· · ·< om the order
(G, <δ) where the items from the grid are represented by their indices. Then the ordering
task on templateT is defined as
Sord(T) = (OG, <δ). (5.12)
Given the template T and the ordering resultSord(T) = o1 < o2 < · · ·< om, the triplets
from this particular answer are generated according to the following algorithm:
T∂ = (p, oi, oj)| ∀i∈ {1,2, . . . , m−1},∀j∈ {i+ 1, i+ 2, . . . , m}. (5.13)
The number of triplets generated per ordering answer iskT∂k= m(m2−1).
5.4
Template-specific Triplets
It is obvious from previous sections how to generate triplets from one worker’s answer. If we are given multiple answers from templates with different images or even different templates, the resultant set of triplets T is
T =[
∂
T∂. (5.14)
In the following text we denoteT△sela triangle template with a selection task performed on it and similarlyTgpsel(m, s) the templateTgp(p, G, m) with the selection taskSsel(Tgp, s)
and Tgpord(m) the templateTgp(p, G, m)with the ordering task.
If we take into account the templateTsel
T se l gp (2 ,1) T se l gp (4 ,1) T se l gp (4 ,2) T se l gp (8 ,1) T se l gp (8 ,2) T se l gp (8 ,4) T se l gp (12 ,1) T se l gp (12 ,3) T se l gp (12 ,6) T se l gp (16 ,1) T se l gp (16 ,4) T se l gp (16 ,8) T ord gp (4) T ord gp (8) T or d gp (12) T or d gp (16) selT Template 0 10 20 30 40 50 60 70 80 90 100 % of screens
(a) Percentage of screens needed to get the same amount of triplets from dif-ferent templates.
Template Tsel
gp(2,1) Tgpsel(4,1) Tgpsel(4,2) Tgpsel(8,1) Tgpsel(8,2)
Reduction factor 1 3 4 7 12
Tgpsel(8,4) Tgpsel(12,1) Tgpsel(12,3) Tgpsel(12,6) Tgpsel(16,1) Tgpsel(16,4)
16 11 27 36 15 48
Tgpsel(16,8) Tgpord(4) Tgpord(8) Tgpord(12) Tgpord(16) T△sel
64 6 28 66 120 2
(b) Reduction factor of screens for different templates with constant number of triplets.
Figure 5.3: Comparison of different templates with respect to the quantity of triplets. to the classical triplet definition (see Section5.1). This template will be used as a reference in future experiments. Since we already defined the triplet and the template which can generate it, what is the motivation to use different templates?
Quantity of Triplets. Lets compute the number of triplet produced from some particular
templates and tasks. If we assign 100% to the number of screens needed to achieve some certain amount of triplets using the default templateTgpsel(2,1)generating just one triplet,
we can compute the percentage of needed screens to reach the same amount of triplets for some other templates. The results are summarized in Figure 5.3.
Comparing the number of triplets produced from different templates, we can see that using some of them, we can significantly reduce the number of screens and hence the costs to achieve the same number of triplets. The highest number of triplets is produced by template
Tord
However, is the highest quantity of triplets produced from a template the only priority that should be taken into account? There are also another important questions like: “Do the triplets produced by different templates have the same quality?”, or “What is the limit size of the grid that are workers able to answer efficiently without significant error?”.
Quality of triplets. The quantity of produced triplets is undoubtedly important,
how-ever, we have to consider also the quality of triplets produced by different templates. This statement is supported by the experiment described in Section6.4.
In this experiment there were computed embedding errors for different templates and different embedding functions with fixed number of triplets. The best lowest error can be observed in embedding created from triplets using Tsel
gp(2,1) template. There is also
observed some correlation between number of triplets produced by a certain template and their embedding error (especially using t-STE or GNMDS embedding function). If the workers answering the tasks was paid per generated triplet, it would be best to use the default templateTgpsel(2,1)to get their answers. The comparison of these errors is is Figure 6.1a.
Fortunately, the workers are not paid per triplet, but rather per screen. More specifically they want to be paid for time they spend working on a task, but the reward is specified per task. So if we repeat the same experiment and instead of constant number of triplets we use constant number of screens, the results are dramatically different as one can see in Figure 6.1b. Since each default templateTgpsel(2,1)produces only one triplet, the total embedding error remains quite high. On the other hand using some templates that produces more triples, the resulting error is fairly low. However, the embedding error is not inversely related to the number of produced triplets per template.
5.5
Necessary Amount of Triplets
Once we figured out how to gather triplets from workers in an effective way, it is also important to know, how many triplets are necessary to build an embedding that would not suffer a significant error. As mentioned, it would be really expensive especially for a larger datasets to let workers to answer all triplets, even using some templates, which substantially reduces the costs. Therefore, the next task aims to determine, how many triplets or rather how many percent of all triplets do we really need and if the percentage remains still the same also for a different number of objects.
Assume that the necessary percentage for a good quality embedding is 1% for 100 objects, which means 4 851 triplets. If this 1% of triplet universe is required to build the same-quality embedding also for 1 000, 10 000 or 100 000 objects, then the task of getting such number of triplets will become extremely expensive and hence intractable already for a quite small number of objects. The number of required triplets and the costs are summarized in Table5.1a.
Fortunately, according to the experiment described in Section6.6, the required percent-age is not the same and although the size of triplet universe grows cubically, the amount of necessary triplets seems to grow much slower, perhaps even linearly. If the growth is really linear, then the expenses are reduced by cube root. The situation in such case is summarized in Table5.1b.
These results were obtained for synthetically generated triplets based on a ground truth distance matrix. The situation could be different in case of real data, because workers do not