Florida International University
FIU Digital Commons
FIU Electronic Theses and Dissertations University Graduate School
3-26-2014
Mining the Online Social Network Data: Influence,
Summarization, and Organization
Jingxuan Li
Follow this and additional works at:http://digitalcommons.fiu.edu/etd
Part of theComputer Engineering Commons, and theElectrical and Computer Engineering Commons
This work is brought to you for free and open access by the University Graduate School at FIU Digital Commons. It has been accepted for inclusion in FIU Electronic Theses and Dissertations by an authorized administrator of FIU Digital Commons. For more information, please [email protected]. Recommended Citation
Li, Jingxuan, "Mining the Online Social Network Data: Influence, Summarization, and Organization" (2014).FIU Electronic Theses and Dissertations.Paper 1241.
FLORIDA INTERNATIONAL UNIVERSITY Miami, Florida
MINING THE ONLINE SOCIAL NETWORK DATA: INFLUENCE, SUMMARIZATION, AND ORGANIZATION
A dissertation submitted in partial fulfillment of the requirements for the degree of
DOCTOR OF PHILOSOPHY in COMPUTER SCIENCE by Jingxuan Li 2014
To: Dean Amir Mirmiran
College of Engineering and Computing
This dissertation, written by Jingxuan Li, and entitled Mining the Online
Social Network Data: Influence, Summarization, and Organization, having been approved in respect to style and intellectual content, is referred to you for judgment.
We have read this dissertation and recommend that it be approved.
Sundaraja Sitharama Iyengar
Shu-Ching Chen
Bogdan Carbunar
Debra VanderMeer
Tao Li, Major Professor
Date of Defense: March 26, 2014
The dissertation of Jingxuan Li is approved.
Dean Amir Mirmiran College of Engineering and Computing
Dean Lakshmi N. Reddi University Graduate School
c
Copyright 2014 by Jingxuan Li All rights reserved.
DEDICATION
ACKNOWLEDGMENTS
I would like to thank my Ph.D. advisor, Dr. Tao Li. He offered me invaluable advice and financial support throughout my Ph.D. study in School of Computing and Information Sciences at Florida International University. Dr. Li taught me how to conduct research, gave me freedom to identify interesting research problems, and helped me find out solutions to those problems. I cannot thank Dr. Li enough.
I would also like to thank Dr. Sundaraja Sitharama Iyengar, Dr. Shu-Ching Chen, Dr. Bogdan Carbunar, and Dr. Debra VanderMeer for taking their time to serve on the committee and provide feedback for my dissertation work.
I extend my thanks to Dr. Tong Sun and Dr. Wei Peng in Xerox Research Center, who gave me help and support during my internship.
Special thanks to all of my co-authors. In addition, my thanks go to my collaborators including Dr. Ning Xie, Dr. Changjun Wu, and many others, who have provided me useful suggestions.
ABSTRACT OF THE DISSERTATION
MINING THE ONLINE SOCIAL NETWORK DATA: INFLUENCE, SUMMARIZATION, AND ORGANIZATION
by Jingxuan Li
Florida International University, 2014 Miami, Florida
Professor Tao Li, Major Professor
Online Social Network (OSN) services provided by Internet companies bring people together to chat, share the information, and enjoy the information. Mean-while, huge amounts of data are generated by those services (they can be regarded as the social media ) every day, every hour, even every minute, and every sec-ond. Currently, researchers are interested in analyzing the OSN data, extracting interesting patterns from it, and applying those patterns to real-world applica-tions. However, due to the large-scale property of the OSN data, it is difficult to effectively analyze it.
This dissertation focuses on applying data mining and information retrieval techniques to mine two key components in the social media data — users and user-generated contents. Specifically, it aims at addressing three problems related to the social media users and contents: (1) how does one organize the users and the contents? (2) how does one summarize the textual contents so that users do not have to go over every post to capture the general idea? (3) how does one identify the influential users in the social media to benefit other applications, e.g., Marketing Campaign?
The contribution of this dissertation is briefly summarized as follows. (1) It provides a comprehensive and versatile data mining framework to analyze the users and user-generated contents from the social media. (2) It designs a hierarchical co-clustering algorithm to organize the users and contents. (3) It proposes multi-document summarization methods to extract core information from the social
network contents. (4) It introduces three important dimensions of social influence, and a dynamic influence model for identifying influential users.
TABLE OF CONTENTS
CHAPTER PAGE
1. INTRODUCTION AND MOTIVATION . . . 1
1.1 Motivation to Conduct Research on Users and Contents . . . 2
1.2 Research Problem Statement . . . 5
1.3 Research Purpose and Significance . . . 6
1.4 Contributions . . . 8
1.4.1 Organization of Users and Contents . . . 8
1.4.2 Summarization of Contents . . . 8
1.4.3 Identifying Influential Users . . . 10
1.5 Chapter Organization . . . 10
2. ORGANIZATION OF USERS AND CONTENTS . . . 11
2.1 Overview . . . 12
2.2 Related Work . . . 16
2.3 Hierarchical Co-Clustering Methods . . . 19
2.3.1 Problem Formulation . . . 19
2.3.2 Hierarchical Divisive Co-Clustering . . . 19
2.3.3 Hierarchical Agglomerative Co-Clustering . . . 22
2.4 Incorporating Instance-level Constraints for HCC . . . 23
2.4.1 Best Layer . . . 24
2.4.2 Alternating Exchange . . . 25
2.5 Experiment . . . 26
2.5.1 Data Set . . . 26
2.5.2 Hierarchies Generated from HDCC . . . 27
2.5.3 Hierarchies Generated from HACC . . . 28
2.5.4 Clusterings Comparison . . . 29
2.6 A Case Study . . . 33
2.6.1 Similarity Quantification using HCC . . . 34
2.6.2 Music Feature Extraction . . . 37
2.6.3 Result Analysis . . . 38
2.7 Conclusion . . . 39
3. A SUMMARIZATION FRAMEWORK OF TEXTUAL CONTENTS . . 41
3.1 Overview . . . 42
3.2 Related Work . . . 44
3.2.1 Generic Summarization . . . 44
3.2.2 Query-Focused Summarization . . . 44
3.2.3 Update and Comparative Summarization . . . 45
3.2.4 Submodularity . . . 45
3.3 Algorithm Using Submodular Function . . . 46
3.3.1 Why Submodularity? . . . 46
3.3.2 Algorithm for Summarization . . . 49
3.4 The Summarization Framework . . . 53
3.4.1 Generic Summarization . . . 53
3.4.3 Update Summarization . . . 55 3.4.4 Comparative Summarization . . . 56 3.5 Experiments . . . 58 3.5.1 Generic Summarization . . . 58 3.5.2 Query-Focused Summarization . . . 61 3.5.3 Update Summarization . . . 62 3.5.4 Comparative Summarization . . . 63 3.5.5 Improved Algorithm . . . 65 3.6 Conclusion . . . 65
4. SUMMARIZATION FOR TIME-SENSITIVE OSN CONTENTS . . . . 67
4.1 Overview . . . 68
4.1.1 Storyline Generation . . . 68
4.1.2 Event Detection . . . 70
4.1.3 Multi-Task Multi-Label Classification . . . 73
4.2 Related Work . . . 74
4.2.1 Microblog Mining . . . 74
4.2.2 Text Summarization and TDT . . . 75
4.2.3 Event Detection . . . 76
4.2.4 Topic and Sentiment Classification . . . 77
4.3 Storyline Generation . . . 78
4.4 Event Detection . . . 82
4.4.1 Framework . . . 82
4.4.2 Batch Version . . . 84
4.4.3 Streaming Version . . . 85
4.5 Multi-Task Multi-Label Classification . . . 86
4.5.1 Problem Statement . . . 86
4.6 Experiments for Storyline Generation . . . 88
4.6.1 The Data Set . . . 88
4.6.2 Summarization Capability . . . 89
4.6.3 A User Study . . . 93
4.7 Experiments for Event Detection . . . 95
4.7.1 The Data Set . . . 96
4.7.2 Technical Set Up . . . 96
4.7.3 Detection Results . . . 97
4.8 Experiments for Multi-Task Multi-Label Classification . . . 101
4.8.1 The Data Set . . . 101
4.8.2 Ground Truth Labeling . . . 102
4.8.3 Feature Selection . . . 102
4.8.4 Evaluation . . . 103
4.9 Conclusion . . . 104
4.9.1 Storyline Generation . . . 105
4.9.2 Event Detection . . . 105
5. IDENTIFYING INFLUENTIAL USERS . . . 106
5.1 Overview . . . 106
5.1.1 Identifying Influential Users . . . 106
5.1.2 Limitations of Current Research Efforts . . . 107
5.1.3 Content of The Chapter . . . 109
5.1.4 Chapter Contribution and Organization . . . 110
5.2 Related Work . . . 111
5.3 Three Dimensions of Influence . . . 114
5.3.1 Monomorphism VS. Polymorphism . . . 114
5.3.2 High Latency VS. Low Latency . . . 115
5.3.3 Information Inventor VS. Information Spreader . . . 116
5.4 Influence Network and Influence Models . . . 116
5.4.1 Influence Network . . . 116
5.4.2 Influence Models . . . 118
5.5 Information Diffusion Model based on Continuous-Time Markov Process119 5.5.1 Model Formulation . . . 120
5.5.2 Estimation of Transition Rate Matrix . . . 121
5.5.3 Estimation of Transition Probability Matrix . . . 122
5.6 Experiment . . . 123
5.6.1 The Data Set Description . . . 123
5.6.2 Correlations Between Different Metrics . . . 124
5.6.3 An Evaluation Framework to Measure Three Dimensions of Influence 124 5.6.4 Predicting Spreading Size Using IDM-CTMP . . . 134
5.7 Conclusion . . . 137
6. CONCLUSION . . . 139
6.1 Summary . . . 139
6.2 Future Work . . . 141
LIST OF TABLES
TABLE PAGE
3.1 A quick summary of the submodular functions for different
summa-rization tasks. . . 51
3.2 Notations. . . 53
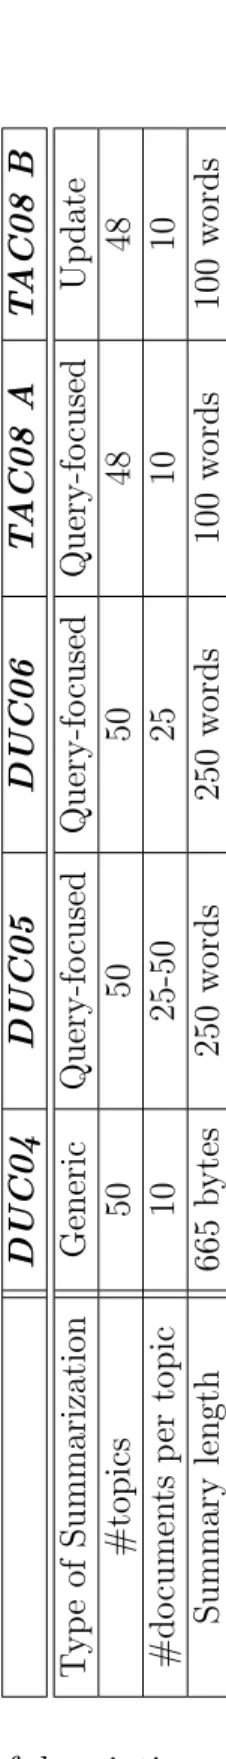
3.3 Brief description of the data sets. . . 57
3.4 Results on generic summarization. . . 59
3.5 Results on query-focused summarization. . . 59
3.6 Results on update summarization. . . 61
3.7 TDT2 corpora topic description. . . 63
3.8 A case study on comparative document summarization. Some unim-portant words are skipped due to the space limit. The bold font is used to annotate the phrases that are highly related with the topics, and italic font is used to highlight the sentences that are not proper to be used in the summary. . . 64
4.1 Statistics of Data set. . . 89
4.2 The comparison among different summarization methods. Notice that DS denotes Dominant Set, and ST represents Steiner Tree. ++ and + indicate that DS+ST significantly outperforms the best compar-ative methods with a confidence level greater than 99% and 95%, respectively. . . 91
4.3 Survey Results: User ratings on different systems based on their sat-isfaction. . . 95
4.4 The description of the data set. . . 96
5.1 The top 10 influential users lists obtained by different methods. . . 131
5.2 The comparison over the 10,000 top users. . . 136
LIST OF FIGURES
FIGURE PAGE
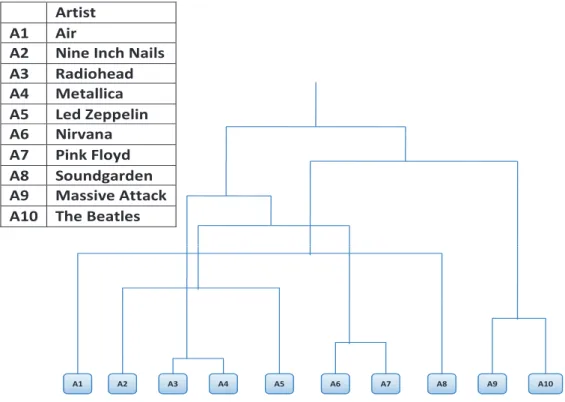
2.1 Part of the dendrogram generated by SLHC. . . 16
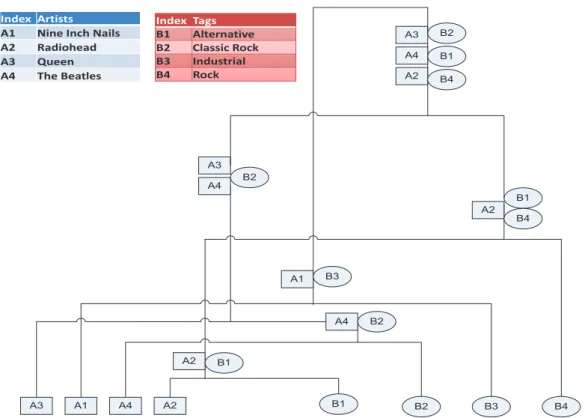
2.2 Part of HCC dendrogram. Rectangles represent artists and ellipses represent tags assigned to these artists. The nodes containing both rectangles and ellipses are clusters containing both artists and tags. 17 2.3 A sample cluster content from user-keyword (artist-style) hierarchy. (=means the most similar). . . 21
2.4 Another sample cluster content from user-keyword (artist-mood) hi-erarchy. (=means the most similar). . . 21
2.5 A sample cluster content from user-tag (artist-tag) hierarchy. (=means the most similar). . . 21
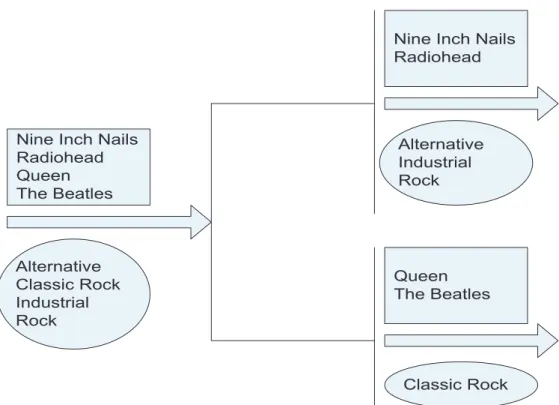
2.6 Part of HDCC dendrogram. It shares the same artists and tags as Figure 2.2. . . 28
2.7 CPCC of HDCC, HACC and SLHC. . . 30
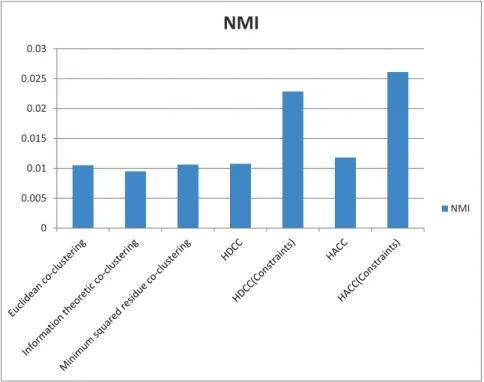
2.8 NMI of various clustering methods. HDCC(constraints) represents HDCC with 10 artist constraints. HACC(constraints) represents HACC with 10 artist constraints. . . 32
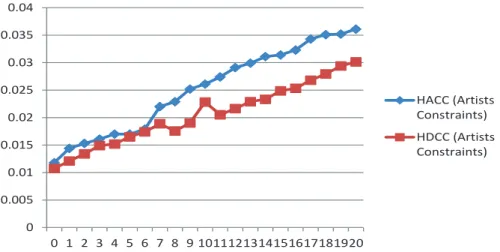
2.9 NMI on HACC with artists constraints range from 0 - 20. . . 33
2.10 NMI on HACC with tags constraints range from 0 - 20. . . 33
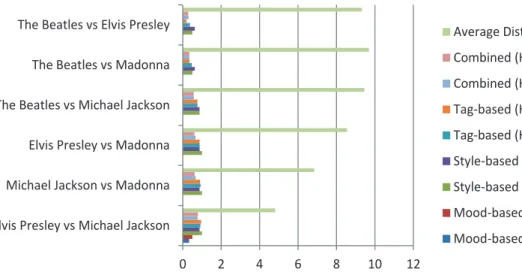
2.11 Results of the case study. . . 37
3.1 Left: ROUGE-2 for MSSF(Sentence Similarity) using scaling factor 0.1-0.7; Right: ROUGE-2 on threshold ranging from 2-5 for MSSF(Term Coverage) using scaling factor 0.1-0.9. . . 59
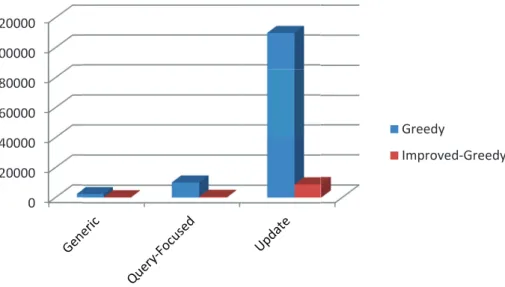
3.2 Average running time (in milliseconds) of two algorithms on three summarization tasks. . . 65
4.1 A sample storyline for event query – Egypt Revolution. . . 69
4.2 An illustration of the storyline generation. . . 79
4.3 An example of the streaming algorithm. . . 85
4.4 The comparison results. . . 93
4.5 A sample new event – Marijuana. . . 98
4.6 A sample anomalous event – Advert. . . 98
4.7 Detected events for three topics. . . 100
4.9 Tweets distribution on Sentiment and Topic labels. . . 103 4.10 The comparison results of classification. . . 104 5.1 The average number of topic adoptions over the time on our Twitter
data set. . . 109 5.2 The example of Temporal Influence Network construction. . . 118 5.3 Number of Hashtags/URLs utilized by users in Twitter. . . 125 5.4 The average topic similarity of top 10,000 users and bottom 10,000
users from 9 user influence rank lists. D denotes Degree, P de-notes Pagerank, Rt dede-notes Retweet, Rp dede-notes Reply, M dede-notes Mention, TWDS is Time-Window Diffusion Size, and TC means Temporal Closeness. . . 127 5.5 The correlation between top ranked 10,000 influential users based on
different influence metrics and 10,000 users with the lowest latency. D denotes Degree, P denotes Pagerank, Rt denotes Retweet, Rp denotes Reply, M denotes Mention, TWDS is Time-Window Dif-fusion Size, and TC means Temporal Closeness. . . 128 5.6 The comparison results of top 10,000 users from 10 influence rank lists
against top 10,000 inventing ability users and top 10,000 spreading ability users. Notice that D denotes Degree, P denotes Pagerank, Rt denotes Retweet, Rp denotes Reply, M denotes Mention, TWDS is Time-Window Diffusion Size, INV is Inventing Ability metric, and TC is Temporal Closeness. . . 130 5.7 The comparison between the predicted spreading size of top ranked 5
users (left side) and randomly picked 5 users (right side) by IDM-CTMP and baseline against the ground truth. . . 137
CHAPTER 1
INTRODUCTION AND MOTIVATION
The social network is a social structure of a set of individuals and the ties be-tween them. Because of the social and informative property of the social network, the social network analysis, as a research topic, has attracted much attention from different domains, including economics, anthropology, biology, social psychology, physics, information science, etc. The analysis techniques of the social network are mainly coming from sociology, statistics, and mathematics [WF94], and they highly rely on the data in their own domain. It is worth noticing that, before the advent of the online social network (OSN) websites, collecting the social net-work data is believed to be difficult for most researchers due to the limitation of resources.
Recently, social network data collection is becoming easier because of the rapid development of the Online Social Network platform (e.g., Facebook, Twitter, and Google+). These platforms can be defined as social softwares, which help people interact/communicate with each other, or engage in the interaction. Consider-ing the convenient accessibility of OSN through different digital appliances, e.g., smartphone, tablet, laptop, etc., OSN has become the news and updates sharing platform in addition to serving interactions. It is thus also named as social media. Due to its roles as both a communication channel and a media, social network data is everywhere. For example, there is data about friendship, affiliation, email, co-author, call, movie and music networks, etc. Meanwhile, the data collection is becoming trivial via the API and webpages provided by those OSN services.
Having addressed the research data set problem, the analysis over those data sets is turning out to be non-trivial, since on the one hand, they are usually large-scale and the traditional analytics methods cannot be applied on them directly; on the other hand, some analytics methods are borrowed from the other domains instead of social network, thus cannot accurately consider the properties of OSN.
In order to design prominent techniques to preprocess and analyze the large-scale OSN data, computer science is brought to the front, especially data mining and information retrieval. Notice that the strength of data mining is to build descriptive and predictive models for the data, while the advantage of information retrieval is to obtain the relevant information from a large collection of information resources. Thus, this research is going to employ data mining and information retrieval techniques to mine the OSN data.
There have already been different branches of research on the OSN data using data mining and information retrieval, including information diffusion and cas-cading [KKT03, KKT05, LMF+07], link prediction [LNK07, CMN08], experts and
prominent actors identification [STLS06, DYB+07, CNN+10], search [AA05], trust
and distrust on social network [GKRT04, DHP07], community detection [New06, GN02], etc.
1.1 Motivation to Conduct Research on Users and Contents
On the one hand, it can be observed from different branches of the research on the OSN data that all of these research works are surrounding the users and user-generated contents in OSN. For example, some researchers have studied the properties of the users in the online social network, and proposed methods to rank the influential users in OSN [CHBG10, RGAH10, WLJH10]. While some other work focuses on the study of information diffusion through the social network, the information can be in the form of blogs, posts, tweets, comments, tags, images, and URLs [GGLNT04, RMK11, YC10].
Notice that users are individuals who have registered on the social media ser-vices, and are generating and propagating the updates and news through the services. Meanwhile, users themselves have different types of social ties, such as parents, friends, classmates, comrades, couples, and so on. Thus, we conclude that users of the social media form OSN, and they are exchanging and propagating
ev-erything, which can be called social contents (posts, blogs, tweets, reviews, images, URLs, tags, etc.) through OSN. As a result, users and the contents flowing in the social network are two core components of OSN.
Researchers believe that through the studies of social media users and con-tents, (1) sociologists can have a better understanding of how people behave on OSN, evaluate and analyze the research results before the advent of OSN, and identify the difference between online social network and the social network in the real world; (2) economists can develop new economical models based on the OSN data; (3) biologists are aware of the connection between the epidemics and social network; (4) physicists can have insights about the phenomenons in the social net-work; (5) mathematicians and statisticians are going to develop or extend more mathematical models due to the motivation of generalizing the OSN analysis meth-ods; (6) computer scientists and information scientists are going to design more interesting and practical algorithms in response to the analytical requirements of the OSN data.
On the other hand, at the same time when the academic research is on-going, the industry poses new requirements in studying the users and contents in the social media. (1) Marketing users seek tips and suggestions from the OSN data to increase the user engagement; (2) Big Internet companies are eager for tools to organize the information of users and contents in the social media; (3) Information providers cannot wait for providing their users with the appropriate personalized contents.
In a word, the research of social media users and contents is important for both academia and industry, and many researchers have taken the very first step. How-ever, (1) most of the existing work over the social network users mining focuses on their own empirical purposes, and does not attempt to analyze users under different circumstances. In other words, it is hard to extend those works for users in different OSNs, for different purposes; (2) the existing works over the social
network contents are still immature, in terms of the inability to provide appropri-ate, accurappropri-ate, concise, and meaningful summaries to serve different requirements of the audience; (3) few existing works explicitly organize the users and contents based on abundant relationships between different users, different contents, the user and the content; in addition, few of them attempt to improve the mining procedure of one type of data by incorporating the other type of data.
In order to address the above issues, this dissertation designs and provides a large-scale social network analytics framework, which aims at the further study of the user and content in OSN based on the existing research work. It bridges the gap between the user and content aspects of the OSN research via data mining and information retrieval techniques, and sheds light on deep understanding of the user and content, as well as the relationship between them. Moreover, this research improves the state of the art methods for mining the user and content in OSN by addressing the issues inherent to them.
Notice that this research will not cover every single existing research area men-tioned before for the user and content in OSN. Rather, considering the large-scale property of the OSN data, the main aim of this research is two-fold: (1) identifying the most important and relevant information, in other words, finding out users and contents pertaining people’s requirements, so that people do not have to go over every user or every piece of content in the OSN; (2) organizing both users and user-generated contents simultaneously into a data structure based on their in-trinsic relationships, so that the future information retrieval and recommendation requirements can be fulfilled.
1.2 Research Problem Statement
As introduced before, the users and contents in the social media have attracted much research attention. However, due to the large-scale property of the data, people cannot go through every user and every piece of content to fulfill their information needs. Moreover, even though fully visiting of the users and contents is possible for some particular data sets, it is still highly time/effort consuming and not necessary, since usually a small key set of users and contents have the capability of representing the whole data set, and the efforts only need to be devoted to the small set. In other words, methods, which can tailor to the huge volume of social network data per different requirements and identify the most representative/significant information from the data are important.
This research will follow this direction to provide a comprehensive and ver-satile framework to mine and analyze the large-scale social network users and contents. In particular, this framework focuses on identifying “influential” users and summarizing contents in OSN by considering the existing methods as the basis, and proposing new models and algorithms to address a more general OSN “influential” users identification problem and a more meaningful OSN contents summarization problem. Furthermore, on top of dealing with the two problems related to the users and contents, respectively, this research is dedicated to uti-lize the relationship between the users and the contents in the social network to organize the OSN data, and explore the possibility of enriching the mining pro-cedure of one particular type of data (users/contents) via the other type of data (contents/users).
To facilitate the understanding of capabilities of the proposed framework, sev-eral interesting questions, which are going to be answered by this framework in this research are listed below:
1. Given the specific requirement posed by people, who are the “influential” users in an OSN? Will they be influential in the future? Why?
2. How does one summarize the contents in OSN while not compromising with too much information loss or reducing the readability, so that users can quickly capture and begin to enjoy reading the general ideas about their interested topics?
3. What is the relationship between users and contents in the social network? How does one utilize these relationships to organize those involved users and contents?
1.3 Research Purpose and Significance
The ultimate goal of this dissertation is that with its assistance, everyone, no matter whether he/she is a researcher, a political leader, a CEO in the company, or an ordinary individual, he/she can mine the data, then identify the important users/contents from his/her perspective, summarize the contents by issuing any topical queries, or capture the overall picture of the relationship between the involved users and contents, and finally have a deep understanding about those mining results.
Therefore, different from most of the traditional work, which targets the sin-gle aspect of the OSN data (either the user, the content, or the other aspect), this dissertation aims at designing a comprehensive and versatile framework to mine the given OSN data, and covering different aspects of the data, i.e., finding out “influential” users, summarizing the important and trending contents, and uncovering the relationship between the users and contents.
The benefits provided by this framework are significant due to the massive requirements from real-world applications. Let us have a look at some example applications. First, people may have to identify “important” users based on differ-ent standards. For example, people, who have some domain specific (e.g., machine learning) questions may want to seek help from experts in OSN, because those ex-perts are “important” to them; marketers would like to target users, who can
help promote their brands’ products in OSN, thus, those users are “important” in their eyes. Second, no one could read every piece of the content in OSN within limited time. Instead, most people would prefer receiving the general summarized updates from OSN, while keeping a close eye on his/her interesting topics. Third, some people may be curious about who posts a hot message in OSN, or what an “influential” user said in the OSN today. For example, when an individual receives a retweet from Twitter, stating that an earthquake is shaking Japan, he/she may wonder who posted this tweet at the very first, where is he/she? For another example, when an individual wants to acquire the opinion about the current job market, he/she may go to the Twitter system to “follow” Barack Obama to see his thoughts. Behind these examples, people may wonder what is the real force pulling specific users and contents together.
Besides the benefits for real world applications, this dissertation is significant because of its capability of improving the existing methods for mining the OSN data. Specifically, for influential user identification, this dissertation will not only find out who is important currently, but also predict who will be important in the future dynamically and continuously. For summarizing the contents, this disser-tation is one of a few pioneers, which modifies and applies the traditional summa-rization techniques for the social network documents, e.g., posts, blogs, reviews, etc., and proposes a new summarization method — storyline generation to pro-vide more meaningful summaries for the time-sensitive social network documents, such as Tweets. After that, people could save time by reading the summaries of the news and updates on the OSN. In addition, two other methods, including an event detection framework and a multi-task multi-label classification method, are used to summarize the Time-Sensitive OSN contents. For organizing the user and content, this dissertation explores two directions: first, it aims at organizing the user and content of the OSN into a tree structure; second, it considers incorporat-ing one type of object into the analysis of the other type of object to reveal the
influence of one to the other. For example, the instance-level constraints of one type of object (e.g., two objects must/cannot be placed together in the same node of the resulting tree) can be incorporated into the re-organization of the other type of object.
1.4 Contributions
This dissertation addresses three aforementioned research problems related to users and user-generated contents in OSN, using data mining and information retrieval techniques. It attempts to discover interesting patterns, summarize the historical records, and predict futures of the online social network.
1.4.1 Organization of Users and Contents
This dissertation presents a new way to organize the users and user-generated contents on the social network [LL10, LLO10, LSLO12]. Specifically, a Hierar-chical Co-Clustering algorithm is introduced to organize the users and contents into a tree structure. This resulting tree can help with user/content retrieval and recommendation in the future. This algorithm can be applied to various types of OSN data sets, e.g., users and topics mentioned by those users, artists and textual labels assigned to those artists, etc. Based on the tree structure derived from our clustering algorithm, some pre-defined instance-level constraints can be incorpo-rated into our method, and lead to better clustering performance, or organization performance.
1.4.2 Summarization of Contents
Aiming at delivering succinct summaries of the social network contents to the online audience, this part of dissertation presents a multi-purpose summarization framework [LLL11, LLL12a] as well as a novel summarization method – storyline generation [LLL+12b]. Furthermore, two nontraditional methods, including an
event detection framework and a multi-task multi-label classification method, are proposed as alternatives.
The multi-purpose summarization framework is based on various Submodular Functions, which are adopted from a set function in Mathematics. This summa-rization framework performs four summasumma-rization tasks, including Generic Sum-marization (summarize a given set of documents), Query-Focused SumSum-marization (given a query, summarize the contents related to the query), Update Summariza-tion (given an existing summary regarding a topic, summarize the latest updates of this topic), and Comparative Summarization (given a query, summarize two to-be-compared document sets over multiple aspects of the query).
The storyline generation provides a new way to understand the time-sensitive textual contents from the social network. Different from the traditional summa-rization methods, which only try to extract core pieces of information, and then use them to form a summary without considering the chronological order of the events described by those information, the storyline generation pays special atten-tion to the chronological order. It makes sense since (1) OSN is usually considered to be a novel type of media for news acquisition, and the time is quite impor-tant in this case; and (2) for a story described by the social network contents, “one” single cause might be followed by “multiple” effects, and the chronological order of events in the story can reveal the big picture of those “causes-effects” relationships.
Besides the traditional summarization methods, two alternatives are proposed to address some OSN audience’s requirements. First of all, an event detection framework is designed to capture the “events” happening in the social network. This is especially useful for the audience, who are only interested in receiving the news/updates in a timely fashion without too much descriptions of them. Sec-ond, a multi-task multi-label classification method is introduced to help audience quickly classify a new coming OSN message into a topic and a sentiment.
1.4.3 Identifying Influential Users
This dissertation presents three important dimensions of social influence, in-cluding (1) Monomorphism vs. Polymorphism; (2) High Latency vs. Low Latency; and (3) Information Inventor vs. Information Spreader. They help with under-standing the characteristics of “influential users” obtained from various different methods. The work about these three dimensions sheds light on the selection of appropriate methods for identifying influential users under specific circumstances. It has been accepted by the journal — Expert System With Applications.
In addition to the three dimensions of social influence, this dissertation pro-poses a novel dynamic influence model based on Continuous-Time Markov process to identify influential users according to the number of adopters (who follows the influential user candidate) [LPLS13]. This model can dynamically predict the influence of users. Here, “dynamically” means that given any time point in the future, this influence model can predict the user’s influence at that specific time point.
1.5 Chapter Organization
The remainder of the dissertation is organized as follows. Chapter 2 introduces the new method for organizing users and contents in the social network. Chapter 3 and 4 describes the multi-purpose summarization framework for the social network textual contents, the storyline generation method, the event detection framework, as well as the multi-task multi-label classification method for the time-sensitive social network contents, e.g., Tweets from Twitter1. Chapter 5 presents three
“di-mensions” of the influence, and the novel dynamic influence model for identifying influential users in the social network. Finally Chap 6 concludes the dissertation.
CHAPTER 2
ORGANIZATION OF USERS AND CONTENTS
In the social network information retrieval, an important research topic, which has attracted much attention recently, is the utilization of user-generated contents, such as the topics, tags, keywords, and other textual labels, which can be extracted from the online social network web sites, e.g., Facebook 1, Twitter 2, Flickr 3,
Last.fm 4, Youtube 5. A fundamental research problem in the area is how to
understand the relationships among users (in the OSN) and these different pieces of information, and then utilize the relationships to organize these two types of data together so that the future retrieval can benefit from the organization results. Clustering algorithms provide clusters of data points, and it can be considered as a way to organize the data. Co-clustering is the problem of simultaneously clus-tering two types of data (e.g., documents and words, and webpages and urls). We can naturally bring this idea to the situation at hand and consider clustering users and topics together, users and tags together, or users and keywords together.Once such co-clustering has been successfully completed, one can identify co-existing clusters of users and topics, tags, or keywords 6.
When dealing with tags, it is worth noticing that some contents are more specific versions of others. This naturally suggests that the contents could be organized in hierarchical clusters. Such hierarchical organizations exist for topics and keywords, so we will consider hierarchical co-clustering of uses and contents.
1https://www.facebook.com/ 2https://twitter.com/
3https://www.flickr.com/ 4http://www.last.fm/ 5http://www.youtube.com/
6Topics, tags, and keywords are all textual contents. For simplicity, we use contents
to refer to topics, tags, or keywords for the rest of the dissertation when the organization of users and topics, tags, or keywords is being discussed.
In this dissertation, we systematically study the application of Hierarchical
Co-Clustering (HCC) methods for organizing the social network data. There are two standard strategies for hierarchical clustering. One is the divisive strategy, in which we attempt to divide the input data set into smaller groups recursively, and the other is the agglomerative strategy, in which we attempt to combine initially individually separated data points into larger groups by finding the most closely related pair at each iteration. We will compare these two strategies against each other. We apply a previously known divisive hierarchical co-clustering method and a novel agglomerative hierarchical co-clustering. In addition, we demonstrate that these two methods have the capability of incorporating instance-level constraints to achieve better performance. We perform experiments to show that these two hierarchical co-clustering methods can be effectively deployed for organizing the music social network data and they present reasonable clustering performance comparing with the other clustering methods. A case study is also conducted to show that HCC can be applied for more other applications, such as quantify the similarity between social network users.
2.1 Overview
The traditional social network information retrieval research is mainly con-cerned with the users in the social network. Specifically, users and user-user re-lationship together are considered as a graph structure, and the graph algorithms are utilized to retrieve the users.
More recently, the user-generated information is brought to this research area. This information can help (1) summarize the profile of users; (2) recommend specific information to the particular group of users.
What has made such research possible is the increase of social-networking web sites in which users are permitted to post their current status, blogs, tweets, music, videos, pictures, etc., leave comments about the contents they read, listened to,
or watched in the form of short comments, and read comments of other users. In the comments, a wide variety of categorical information about contents and users are available to help users to make quick selection of contents to read, listen to, or watch. Let us raise the music social network as an example. Artists and listeners in the music social-networking websites might communicate with each other in the form of comments about music tracks, and the music tag, style, or mood related to the comments shows the categorical information of music tracks.
We are particularly interested in these additional categorical information since (1) they are commonly available in nearly all of social network web sites in the form of topics, tags, or keywords; (2) they are reasonable features to compute the similarity between posts (i.e., blogs, tweets, music, images, videos). By sampling representative posts of an author/user, one is able to gather topics, tags, and keywords of this author/user.
An important characteristic of these contents 7 is that some contents are more general while some others are more specific. For the example of music social network, e.g., “Soft Metal” is a more specific style (style is a kind of keywords in the music social network) than“Metal”, “Dance Pop” is more specific than “Pop”, “Extremely Provocative” is a more specific tag than “Provocative”, and “Agony” is a more specific mood label (mood is another kind of keywords in the music social network) than “Sadness”.
Since there is no limit in the length of any of the contents of data, a topic, a tag or a keyword can be an extension of another topic, tag or keyword accordingly, which is an extension of yet another topic, tag or keyword. This suggests that the contents cannot only be clustered into a one-level clustering structure but also a hierarchical clustering structure.
Hierarchical clustering is the problem of organizing data in a tree-like structure in which the input set of data points is recursively divided into smaller subgroups,
7It may be somewhat redundant to call them “tag labels” but for simplicity we view
usually until the subgroups become individual data points. Hierarchical cluster-ing offers natural facilitation of data navigation and browscluster-ing [CKPT92], it has been studied quite extensively in bioinformatics [GLD00, ESBB98], in image anal-ysis [Pha01, BF01], and document analanal-ysis [XLG03, ZKF05, FWE03]. There are two standard strategies for hierarchical clustering. One is the divisive strategy, in which we attempt to divide the input data set into smaller groups recursively, and the other is the agglomerative strategy, in which we attempt to combine ini-tially individually separated data points into larger groups by finding the most closely related pair at each iteration. Co-clustering is the problem of developing organizations of two or more types of data. Much less research has been done on co-clustering than on hierarchial clustering [CL04]. While both hierarchical clustering and co-clustering have their own advantages, few algorithms exist that execute both simultaneously [Ber06].
We assume that, given a set of representative features, hierarchically organizing user individually or contents can be effectively accomplished by computation. So we question whether attempting to cluster two data types together will lead to better organizations, which we will study in the dissertation.
In this dissertation, we systematically study the application of hierarchical co-clustering (HCC) methods for organizing users and contents (textual labels of topics, tags, or keywords). We first examine the hierarchical divisive co-clustering algorithms [XM06]. This algorithm has already been incorporated into the frame-work for quantifying artist similarity and is capable of generating reasonable double-hierarchies [SLO08].
After experimenting with a recently proposed hierarchical divisive co-clustering method, HDCC (Hierarchial Divisive Co-Clustering), we present a novel method, HACC (Hierarchical Agglomerative Co-Clustering). The divisive HDCC combines Singular Value Composition (SVD) and K-means using a top-down iterative pro-cess. The agglomerative HACC starts with singleton clusters and then repeatedly
merging two nearest clusters into one until all the points are merged into one cluster. These two methods share a special characteristic: grouping points from both data types. In the case of HDCC, this means that during each “divisive” step, the users are split into different clusters, while at the same time the content labels are split into corresponding clusters containing appropriate users. In the case of HACC, this means that at each step of the merging process, HACC can merge a subset of the users with a subset of the content labels based on their internal heterogeneity. In practice, when our goal is to build double-hierarchies for users and contents, one can often observe that a group of users and a group of content labels are exclusively correlated with each other (i.e., not correlated with any other users or contents). HACC aims at, in such a situation, merging them into a single group at the earliest possible stage [LLO10, EO93, MAH95].
Our hope is that such clusters with two data types will be used for (1) better retrieval when both types of data are specified in a query, e.g., given a query including a user and one of his/her topic labels, one can probably retrieve them together from a user-topic hierarchy, while with the query composed of a user and a tag, one can retrieve them simultaneously from a user-tag hierarchy; (2) the recommendation application when one wishes to find out if a content label is suitable for a user and this user has never commented or been commented with the that content label. E.g., given a query including a user and a topic label this user has not mentioned before, one can retrieve them together from a user-topic hierarchy. If they can be found in the same cluster, this user-topic label will be recommended to the user.
Figure 2.1 shows a sample output dendrogram of a traditional hierarchical clustering method and Figure 2.2 shows a sample output dendrogram of HCC. In this dissertation, we show that such mixed-data-type hierarchical clusters can be generated by HCC and empirically better clusters generated by concurrent use of two data types. We also show that HCC can be extended to incorporate
instance-$UWLVW $ $,5 $ 1LQH ,QFK 1DLOV $ 1LQH,QFK1DLOV $ 5DGLRKHDG $ 0HWDOOLFD $ /HG=HSSHOLQ $ 1LUYDQD $ 3LQN)OR\G $ 6RXQGJDUGHQ $ 0DVVLYH$WWDFN $ 7KH%HDWOHV A1 A2 A3 A4 A5 A6 A7 A8 A9 A10 Artist A1 Air
A2 Nine Inch Nails A3 Radiohead A4 Metallica A5 Led Zeppelin A6 Nirvana A7 Pink Floyd A8 Soundgarden A9 Massive Attack A10 The Beatles
Figure 2.1: Part of the dendrogram generated by SLHC.
level constraints that specify certain content labels must be or must not be together or certain users must be or must not be together for better organization.
Our contributions in this part of the dissertation are three-fold: 1) we develop a novel hierarchical co-clustering method to organize the social network data and facilitate the retrieval given a query including two types of data; 2) we incorporate the instance-level constraints into HCC method and show that such constraints-incorporated HCC could provide better clustering performance; 3) we perform a case study to show that HCC methods have the capability of providing reasonable user similarity quantification measures.
2.2 Related Work
Hierarchical Clusteringis the generation of tree-like cluster structures with-out user supervision. Hierarchical clustering algorithms organize input data ei-ther bottom-up (agglomerative) or top-down (divisive) [TSK+06]. In general hi-erarchical agglomerative clustering is more frequently used than hihi-erarchical
divi-A3 A1 A4 A2 B1 B2 B3 B4 A2 B1 A4 B2 A1 B3 A2 B1 B4 A3 A4 B2 A3 A4 A2 B2 B1 B4 Index Tags B1 Alternative B2 Classic4Rock B3 Industrial B4 Rock Index Artists A1 Nine4Inch4Nails A2 Radiohead A3 Queen A4 The4Beatles
Figure 2.2: Part of HCC dendrogram. Rectangles represent artists and ellipses represent tags assigned to these artists. The nodes containing both rectangles and ellipses are clusters containing both artists and tags.
sive clustering. Co-clustering refers to clustering of more than one data type. Dhillon [Dhi01] proposes bipartite spectral graph partitioning approaches to co-cluster words and documents. Long et al. [LWZY06] propose a general principled model, called Relation Summary Network, for co-clustering heterogeneous data presented as a k-partite graph.
While hierarchical clustering deals with only one type of data and co-clustering produces only one level of data organization, hierarchical co-clustering aims at simultaneously constructing hierarchical structures for two or more data types, that is, it attempts to achieve the function of both hierarchial clustering and co-clustering. Because of this unique nature hierarchical co-clustering is receiving special attention from researchers [HA07, IPM09]. Xu et al. proposed a hier-archical divisive co-clustering algorithm [XM06] to simultaneously find out document clusters and the associated word clusters. Shao et al. [SLO08] incorpo-rated this hierarchical divisive co-clustering algorithm into a novel artist similarity
quantifying framework for the purpose of assisting artist similarity quantification by utilizing the style and mood clusters information. In their framework, the artist similarity is based on style similarity and mood similarity. Even though this hierarchical divisive co-clustering method is given, to our best knowledge, few re-searchers have studied the hierarchical agglomerative co-clustering methods (e.g., Li et al. [LL10] made the initial attempt to study a hierarchical agglomerative co-clustering method).
In recent years much work has been done onconstrained clustering — inte-grating various forms of background knowledge in the clustering process. Existing constrained clustering methods have been focused on the use of background in-formation in the form of instance level “must-link” and “cannot-link” constraints, which, as the naming suggests, assert that, for a pair of data instances, they must be in the same cluster and they should be in distinct clusters, respectively. Most of constrained clustering algorithms in the literature are designed for partitional clustering methods (e.g, constrained K-means clustering, constrained spectral clus-tering, and constrained clustering using non-negative matrix factorizations, see a survey [BDW08]) and little has been done on utilizing constraints for hierarchi-cal clustering. Recently, there do exist a few works on incorporating constraints into hierarchical clustering (e.g., by extending the partial known hierarchy with the constraints to a full hierarchy or by modifying the order of cluster merging process) [BN08, GD11, DR09, ZL11]. However, these constrained hierarchical clustering methods cannot be applied to our hierarchical co-clustering problem. In our settings, the effects of constraints over one type of data can be transferred to the other type of data, so that both types of clustering would benefit from them.
2.3 Hierarchical Co-Clustering Methods
We begin this section by describing the details of our application of the hi-erarchical divisive co-clustering algorithm (HDCC) by Xu et al. [XM06] to the problem of co-clustering user-content. The procedure is similar with that in Shao et al. [SLO08]. We then present a novel hierarchical agglomerative co-clustering algorithm called HACC, which could also be utilized to cluster user-content.We will compare this agglomerative method with the previous divisive method based on their clustering performance.
2.3.1 Problem Formulation
Suppose we are given a set ofmusersA={a1, a2, . . . , am}, and a set ofnunique
contents that are assigned to these users, T={t1, t2, . . . , tn}. Suppose we are also
given an m ×n user-content relationship matrix X = (xij) ∈ Rm×n, such that xij represents the relationship between the i-th user inAand the j-th content in T (e.g., xij can be the frequency of the assignments of the j-th content to i-th
user). Our goal is to simultaneously generate a hierarchical clustering of A and of T based on matrix X so that each user and content can be in the appropriate cluster and show the hierarchical relationships of these clusters.
2.3.2 Hierarchical Divisive Co-Clustering
We first directly apply the hierarchical divisive co-clustering [XM06] to gener-ate a user-content hierarchy.
In this application, the user and content together is represented as an user– content matrix X. As we mentioned before, content can be any of the aspects of social network users, i.e., topics, tag labels, keyword labels, and etc. The key idea behind the method is to combine Singular Value Decomposition (SVD) (gives us the partitioning of users as well as the partitioning of contents at the same time)
and K-means (provides us the optimal bipartitioning of users and contents) using a top-down iterative process [XM06]. The procedure is described as follows:
1. Given an m×n user–content matrix, X, perform SVD decomposition onX
to obtain Xn:
D1 =diag([1]1×mX), D2 =diag(X[1]n×1) Xn=D−11/2×X×D2−1/2
Xn=U×Λ×VT
2. Let λ1 > λ2 > . . . > λm be the largest m singular values. Then the number of
clusters is kwhere:
k= argmax(m>i>1)(λi−1−λi)/λi−1
3. Find k singular vectors of Xn: u1, u2, . . . , uk and v1, v2, . . . , vk, and then form a
matrixZ by: Z = D−11/2[u1, ..., uk] D2−1/2[v1, ..., vk]
4. Apply K-means clustering algorithm to cluster Z intok clusters. Note that the first mlabels belong to users, while the rest n belong to contents.
5. For each cluster which contains both users and contents, we check the number of users in it. If the number is higher than a given threshold (in our experiment, we set the threshold = 3), construct a new user–content matrix formed by the user and contents in that cluster, and continue to the first step.
Figure 2.3 is a sample cluster obtained from the artist-style (both artists and style labels are extracted from music social network web sites) dendrogram. In this cluster, we observe that the pair of Country-Rock and Progressive Country, and the triple of Americana, Alternative Country and Neo-Traditional Folk are probably the most similar (They can be grouped together in the top layer) in style description, and the similarity betweenCountry-PopandUrban Cowboy is greater than the similarity between Country-Pop and Cajun as well as the similarity
|! Subclass1:MusicalComedy
|! Subclass2:Rockabilly
|! Subclass3:Americana=AlternativeCountry=Neo!TraditionalFolk
|! Subclass4:Country
|! Subclass5:Novelty
|! Subclass6:
|! Subclass1:
|! Subclass1:
|! Subclass1:Country!Pop=CCM
|! Subclass2:UrbanCowboy=Zydeco
|! Subclass2:Cajun
|! Subclass2:ContemporaryCountry
|! Subclass7:Country!Rock=ProgressiveCountry
Figure 2.3: A sample cluster content from user-keyword (artist-style) hierarchy. (=means the most similar).
|! Subclass1:
|! Subclass1:Aggressive=Visceral
|! Subclass2:Volatile=Unsettling
|! Subclass2:Cathartic
Figure 2.4: Another sample cluster content from user-keyword (artist-mood) hi-erarchy. (=means the most similar).
|
!
Subclass
1:
|
!
Subclass
1:
Classical
Rock
|
!
Subclass
2:
Rock
Figure 2.5: A sample cluster content from user-tag (artist-tag) hierarchy. (=means the most similar).
between Urban Cowboy and Cajun. Figure 2.4 is a sample cluster obtained from the artist-mood (both artists and mood labels are extracted from music social network web sites) dendrogram following the same construction rule. Similarly, Figure 2.5 is a sample cluster obtained from the artist-tag (both artists and tag labels are extracted from music social network web sites) dendrogram.
Based on this hierarchical divisive co-clustering algorithm, we can also obtain the tag-based artist clusters, style-based artist clusters as well as mood-based artist clusters. They have the similar well-balanced cluster member distributions.
2.3.3 Hierarchical Agglomerative Co-Clustering
Here we present our novel hierarchical agglomerative co-clustering (HACC) algorithm. Like the traditional agglomerative hierarchical clustering algorithms, HACC starts with singleton clusters and then successively merges the two nearest clusters until only one cluster is left. However, unlike traditional algorithms, it may unify classes from two different data types. This means that the cluster left at the end consists of all the rows and columns and so if there are m rows and n
columns exist, HACC executes m+n−1 rounds. The output of HACC is thus a single tree where the leaves are the rows and the columns of the input matrix, where nodes having both rows and columns as descendants may appear at any non-leaf level. Figure 2.2 illustrates a dendrogram example generated by HACC.
The algorithm of HACC is presented in Algorithm 1. The central part in the design of Algorithm 1 is the method PickUpTwoNodes, which is for selecting two nodes (corresponding to two clusters) to merge. For the purpose of creating groups consisting of two different data types, we use cluster heterogeneity measurement, denoted by CH. Given a group C consisting of r rows, P, and s columns, Q, we define CH(C) as CH(C) = 1 rs X i∈P,j∈Q (xij −µ)2, (2.1)
Algorithm 1 HACC Algorithm Description
GivenA – the set of the first type of data points (e.g., artists) and B – the set of the second type of data points (e.g., T/S/Ms).
Create an empty hierarchy H
List←Objects in A+Objects in B N ←size[A] +size[B]
AddListto H as the bottom layer
for i= 0 to N −1 do
p, q = PickUpTwoNodes(List)
o = Merge(p, q)
Remove p, q from Listand add o toList
Add Listto H as the next layer
end for
whereµis the average of entries over rowsP and columnsQ; i.e.,µ= rs1 P
i∈P,j∈Qxij.
CH measures the local proximity of the cluster. It is worth noticing thatCH indi-cates how “close” the users and the contents involved in the cluster are, specifically speaking, the lower CH means the users and the contents are closer. The goal of choosing two nodes to merge is to let the users and the contents within the resulted cluster as close as possible. As a result, for a merger, we choose two nodes whose merging would result in the least increase in the total cluster heterogeneity [EO93]. Similarly as before, we can also obtain the user/content clusters from the user-content dendrogram generated by HACC.
2.4 Incorporating Instance-level Constraints for HCC
In practice, one may observe pairs of users that should be clustered into the same cluster. Similarly, one may observe pairs of contents that must be always in the same content cluster. These observations are represented as the afore-mentioned “must-link” and “cannot-link” constraints. We design hierarchical co-clustering (HCC, including HACC and HDCC) to incorporate such constraints.
There are two issues in incorporating these constraints. One is how to use them for grouping data points of the same type; i.e., how to use user constraints for grouping users and content constraints for grouping contents. The other is how
to transfer constraints on one data type to the other data type. To address the first issue, we use Dunn’s Index to determine the best layer for cutting the HCC-generated dendrogram and then apply the constrained K-means to incorporate the constraints of the same data type. To address the second issue, we use an alternating exchange algorithm.
2.4.1 Best Layer
Since HCC produces a list of clustering results and each clustering corresponds to one layer of the dendrogram, we use Dunn’s Validity Index [Dun73] to measure and compare these clusterings. This validity measure is based on the idea that good clustering produces well-separated compact clusters. Given a clustering layer consisting of r clusters c1, . . . , cr, Dunn’s Index is given by:
D= min1≤i<j≤rd(ci, cj)
max1≤k≤rd0k
, (2.2)
where d(ci, cj) is the inter-cluster distance between the i-th and the j-th clusters
andd0kis the intra-cluster distance of thek-th cluster. Generally, the larger Dunn’s Index, the better the clustering.
After determining the best layer to cut the dendrogram, we can easily make use of the constraints of the same data type. In particular, we perform constrained K-means on the best layer with the parameterK set to the number of clusters in that layer. For this purpose, we use the MPCK-Means algorithm in [BBM04]. In gen-eral, MPCK-Means incorporates both metric learning and the pairwise constraints effectively into semi-supervised clustering. It adopts EM framework to perform cluster assignment in the E-step, and centroid estimation and metric learning in the M-step. Notice that the constrained K-means is applied on a single data type, afterwards, the constraints can be transferred to the other data types to improve their clusterings.
2.4.2 Alternating Exchange
Here we show how to transfer the constraints between different data types. Specifically, at the best layer of the dendrogram generated by HCC, if some user (or content) data points of certain node are being re-assigned to another node at the same layer after using the instance-level constraints, we can use an alternating exchange algorithm [GS96] to improve T/S/M (or artist) clustering.
The objective function of clustering can be written as [GS96]:
Z = r X k=1 m X l=1 X i∈Ak X j∈Tl (xij −wkl)2, (2.3) with wkl = 1 aktl X i∈Ak X j∈Tl xij. (2.4)
Hereris the number of typeA(represents users) clusters,mis the number of type
T (represents contents) clusters, Ak is the k-th cluster containing data points of
typeA,Tlis thel-th cluster containing data points of typeT,akandtlrespectively
denote data points of type A and T. As before, xij is the value representing the
relationship between the i-th type-A data point and the j-th type-T data point. To transfer constraints from contents to users, we do the following: Suppose we have just obtained a clustering of users, CA, and a clustering of contents, CT, by
cutting the HCC dendrogram using Dunn’s index, as described before. We first incorporate into these clusterings the content constraints using the techniques described in Section 2.4.1 thereby obtain an improved content clustering, CT0 . Then we execute the greedy algorithm shown in Algorithm 2 to make changes on user class assignments. The greedy algorithm is aimed at minimizing the quantity
Z in (2.3) and in each round one user is moved from the current cluster to another if that move decreases the value of Z. Transferring constraints backward (i.e., from artists to T/S/Ms) could be done by simply switching the role of contents and users. In our implementation, we transfer only from contents to users.
Algorithm 2 Alternating Exchange Algorithm Input: clusterings CA and CT0 , and normalized A-T
matrix X, whereCT0 is obtained by using the
MPCK-Means on the output of HCC with respect to Content constraints.
while There is an user whose relocation from the current cluster to another decreases the value ofZ do
pick an user-destination pair that maximizes the decrease and relocate the user to the destination
end while
Output the resulting user clustering CA0
2.5 Experiment
Here we present results of our experiment. For the sake of presentation, we will only show a part of results on the user-content hierarchy. From the representative part shown here, one can imagine the overall picture of the resulted hierarchy.
To further show the advantages of our HCC method, we will use the music social network data to make a case study of artist similarity quantification to compare the hierarchy generated using our method and the hierarchy generated using timbral features along with wavelet coefficient histograms.
2.5.1 Data Set
Music social network web sites enable the users to assign tags, style keywords, and mood keywords to their interested music tracks. Due to the fact that music tracks are closely related to the artists (they create those works) and the listeners (they listen to, “favorite”, or share those works), it is natural to treat the related tags, style keywords, and mood keywords as an important kind of contents for those artists and users in the music social network service. Thus, artist/user and tag/style/mood8 can be considered as a typical example of “user and content” in
the music social network.
We use the music social network data set in [WWS+09] consisting of 403 artists.
For each artist, contents, including tags and styles are collected from Last.fm (http://www.last.fm). There are 8,529 unique tags and 358 unique style keywords. Concerning about the mood information, we collect all the mood keywords for the 403 artists from All music guide (http://www.allmusic.com). Note that an artist may receive the same tag more than once, while is assigned the same style/mood only once. By counting the number of assignments by the same tag, each artist is represented by a 8,529-dimensional integer vector. We scale these tag vectors so that the total of the 8,529 entries is equal to a fixed constant. We will use X to denote the artist-tag frequency matrix thus generated.
As to the style keywords, each artist belongs to at least one style and each style contains at least one artist. We generate an artist-style incident matrix from the data, so that the entry at coordinate (i, j) is 1 if the i-th artist has the j-th style label and 0 otherwise. Similarly, we generate an artist-mood incident matrix from the data.
For the following experiments, we focus on hierarchical co-clustering of artist and tag data, while the empirical studies for the artist and style/mood are omitted because they show similar results.
2.5.2 Hierarchies Generated from HDCC
We use HDCC to generate dendrograms of the artists and tags, artists and style keywords and artists and mood keywords. For the case of artist-T/S/M dendrogram, originally, all the artists and T/S/Ms are within the same cluster. As HDCC running, the artists and T/S/Ms are iteratively separated into different clusters from the higher layer to the lower layer until the number of artists within each cluster of the lower layer is not larger than the given threshold. A sample part of the dendrogram generated by HDCC is presented in Figure 2.6.
Nine Inch Nails Radiohead Queen The Beatles Alternative Classic Rock Industrial Rock
Nine Inch Nails Radiohead Alternative Industrial Rock Queen The Beatles Classic Rock
Figure 2.6: Part of HDCC dendrogram. It shares the same artists and tags as Figure 2.2.
2.5.3 Hierarchies Generated from HACC
We use unconstrained HACC (no instance level constraints are given in this experiment) to generate dendrogram of the artists and the T/S/Ms. Figure 2.2 is part of the dendrogram generated by HACC in our experiment. In the den-drogram, each leaf represents one artist or one tag, each internal node contains a subset of artists and tags, and the top layer is the cluster that contains all artists and tags. Because many people assign a tag “Industrial” to artistNine Inch Nails, “Industrial” and Nine Inch Nails are clustered together. The novelty here is that artists and tags are jointly organized into a hierarchical structure. Once such a hierarchical organization has been generated, an artist can be described by the tags that appear in its cluster. The more representative are the tags for certain artists, the larger possibility for them to be clustered together.
2.5.4 Clusterings Comparison
Hierarchical Clustering Performance Comparison
We compare the HDCC-generated and HACC-generated dendrograms with one generated by single linkage hierarchical clustering (SLHC). It is worth noticing that both HACC and HDCC algorithms used for hierarchical clustering performance comparison do not consider must-link or cannot-link constraints. SLHC is the standard hierarchical clustering method and thus serves as our baseline. Since SLHC can cluster only one type of data, we provide SLHC with the normalized artist-tag matrix by viewing each row as the feature vector of the correspond-ing artist and produce hierarchical clustercorrespond-ing of artists. The artist dendrogram generated by SLHC is shown in Figure 2.1.
To evaluate and compare these three artist dendrograms, we utilize CoPhenetic Correlation Coefficient (CPCC) [SR62] as evaluation measure. Intuitively CPCC measures how faithfully a dendrogram preserves the pairwise distances between the original data points. CoPhenetic Correlation Coefficient (CPCC) is given as:
CP CC = P i<j(d(i, j)−d)(t(i, j)−t) q (P i<j(d(i, j)−d)2)( P i<j(t(i, j)−t)2) (2.5)
Here d(i, j) and t(i, j) are respectively the ordinary Euclidean distance and the dendrogrammatic distance between thei-th and thej-th data points (e.g., artists), and d and t are their respective averages. The comparison results based on CPCC are shown in Figure 2.7, and so we conclude that HDCC cannot gener-ate a “good” enough dendrogram comparing with SLHC while our HACC method generates the most faithful dendrogram in terms of hierarchical clustering perfor-mance. Through the coupled dendrogram generated either by HDCC or HACC, one can observe the relationship between artists and T/S/Ms, also make use of the T/S/Ms within the same cluster as some artists to explain why these artists are clustered together.
0.325 0.33 0.335 0.34 0.345 0.35 0.355 0.36 0.365 0.37 0.375 HDCC HACC SLHC
CPCC
CPCCFigure 2.7: CPCC of HDCC, HACC and SLHC.
Flat Clustering Performance Comparisons
We also evaluate the artist clustering performance of HACC and HDCC, by comparing it with three co-clustering algorithms including Information-Theoretic Co-clustering (ITCC) [DMM03], Euclidean Co-clustering (ECC), and Minimum Residue Co-clustering (MRC) [CDGS04] on the artist-tag dataset.
Since the styles are assigned by some professional experts, we believe that some of the styles can be treated as the oracle class labels of the given artists.
We first cluster the styles using K-means clustering based on the artist-style matrix (that is, clustering of the columns, where each column is the 403-dimensional 0/1 vector that shows assignments of the style corresponding to the 403 artists). We then treat each cluster as a label and assign to each artist one label in the following manner:
• If all the styles assigned to an artist a belongs to a single cluster, we use that cluster as the label ofa. Otherwise, choose the cluster with the largest number of styles assigned toa. If there is a tie, choose the one with the larger total number of styles, and if that doesn’t break the tie, break it arbitrarily. We use these labels as our ground truth class labels in the clustering performance measurements presented below.
Flat Clustering Evaluation Measures
We use Accuracy, Normalized Mutual information (NMI), Purity, and Adjusted Rand Index (ARI) as performance measures. These measures have been widely used in clustering evaluation and we hope they would provide insights on the performance of the HCC methods. For all these measures, the higher the value, the better the clustering.
Suppose we are given clustersC1, . . . , Ck of sizec1, . . . , ck, respectively and we
are comparing this clustering against the ground-truth clustering E1, . . . , Ek of
size e1, . . . , ek. Let n be the total number of data points and for all i and j, let µij denote the number of data points in both Ci and Ej.
Accuracymeasures the extent to which each cluster contains the entities from corresponding class and is given by:
Accuracy = max
π
P
i,π(i)µiπ(i)
n , (2.6)
whereπ ranges all permutations of 1, . . . , k. Puritymeasures the extent to which a cluster contains entities of a single class and is given by:
Purity = 1 n k X i=1 µiρ(i), (2.7)
where ρ(i) is the j that maximizes µij. Adjusted Rand Indexis the
corrected-for-chance version of Rand Index, and measures the similarity between two clus-terings [MC86]. It is given by:
ARI = a− 2bc n(n−1) b+c 2 − 2bc n(n−1) . (2.8) Here a=P i,j µij(µij−1) 2 , b= P i ci(ci−1) 2 , and c= P j ej(ej−1)
2 . NMI is the
normal-ized version of mutual information and measures how much information the two clusterings share [SG03] and is given by:
NMI = P i,jµijlog( nµij ciej) q (P icilog ci n)( P jejlog ej n) . (2.9)
0 0.005 0.01 0.015 0.02 0.025 0.03
NMI
NMIFigure 2.8: NMI of various clustering methods. HDCC(constraints) represents HDCC with 10 artist constraints. HACC(constraints) represents HACC with 10 artist constraints.
Flat Clustering Experimental Results
As we mentioned in Section 2.4.1, Dunn’s Index can be used to find the best layer of the dendrograms generated by HDCC and HACC. After computing Dunn’s Index on the clustering of each layer, we can find out the best layers of the two den-drograms generated by HACC and HDCC separately. Since we have already ob-tained the best layer, the clustering of this layer is compared against Co-clustering algorithms. This clustering is based on artist data points, we applied co-clustering algorithms for clustering artists.
Figure 2.8 shows the experiment results on the clustering methods using NMI as the performance measure. The results in the figures demonstrate that the HCC methods outperforms the co-clustering methods. Similar behaviors can be ob-served when using Accuracy, Purity, and ARI measures. Due to space limitation, we do not include the figures for Accuracy, Purity, or ARI. Figure 2.8 also shows that using the artist constraints improves the clustering performance.