Comparison of Soil Test Methods for measuring pH and
electrical conductivity (EC)
Internal Report. Not for publication. Copyright UNH April 25 2005.
By Paul R. Fisher and Amy C. Douglas. University of New Hampshire, Durham, NH 03824.
[email protected]
, tel 603 862 4525, fax 603 862 4757.
Table of Contents
Pages
Executive Summary ...1
Introduction...2
Research Methods... 2-4
Results ... 4-6
Executive summary
Several soil testing methods are used for onsite testing of media-pH and media electrical conductivity (EC) in container growing media. In this report, we compared the pHSME and ECSME results from a saturated medium extract (SME) test to pH
and EC values obtained from other methods [1 soil:2 water (“1:2”), Pour-Through leachate test, plug extraction (“Squeeze”), and probes that directly measure in the growing medium
(“Direct Probe”)].
For media-pH measurements, the SME, Pour-Through, and Squeeze methods resulted in similar test levels, and the 1:2 method was consistently about 0.3 pH units less than the SME. The Direct Probe was variable, and underestimated pH compared with the SME when pHSME levels were below 7.
For media-EC measurements, the 1:2 methods had the most consistent relationship compared with the SME, followed by the plug squeeze method. All three of these methods had consistent and precise pH readings. Direct sensors have the advantage of rapid measurements directly in the growing medium, but showed the greatest variation between samples and between trials.
The following conversion table for media-electrical conductivity (mS/cm) was generated based on our results, and work published by Cavins et al. (2004) for the Pour-Through and Scoggins et al. (2002) for the Squeeze:
SME 0 0.5 1 1.5 2 2.5 3 3.5 4 4.5 5
1:2 0.0 0.1 0.3 0.5 0.7 0.9 1.2 1.4 1.6 1.8 2.0 probe 2/3 0.3 0.6 0.9 1.1 1.4 1.7 2.0 2.3 2.5 2.8 3.1
squeeze 0.0 0.6 1.3 2.0 2.7 3.4 4.1 4.8 5.6 6.3 7.0 pour-thru 0.1 0.8 1.5 2.1 2.8 3.5 4.2 4.9 5.5 6.2 6.9
Introduction
Several soil testing methods are used to quantify pH and electrical conductivity (EC) in the growing medium. These include:
• Saturated medium extract (SME) (Warncke, 1995)
• 1 soil:2 water by volume (1:2) test (Whipker et al., 2002)
• Pour-Through method to test leachate (Cavins et al., 2004; Nelson, 2003)
• Commercially-available sensors that directly measure pH or EC in the growing medium (Spectrum Technologies Inc., Plainfield, Ill.)
• “Press extraction” or “plug squeeze” testing method (Scoggins et al., 2002; Whipker et al., 2002).
Our objective was to quantify the relationship between pH and electrical conductivity (EC) soil testing methods for pots and liners using the SME method as a comparison.
Research Methods
A Corning Scholar 425 pH meter with a “High-Performance” pH probe was used for objective 1, and an Orion model 520A pH meter (Orion Technologies, Beverly, Mass.) with a gel-filled SensoreX S200C pH probe (SensoreX, Garden Grove, Cal.) were used for these experiments. An Orion model 130 electroconductivity meter was used for all EC measurements. Soil tests were taken as close as possible to one hour after the last irrigation of the growing medium using the following protocols: Saturated medium extract (“SME”) 150mL of medium from the bottom 2/3 of the pot (or the whole cell for liners and plugs) was placed in a plastic sandwich bag. The medium was mixed thoroughly, saturated with distilled water, and let sit for 1 hour. pH of the sample was tested by inserting the pH probe into the saturated media. The saturated medium was then spooned into a paper filter and the solution was squeezed from the filter into a collection vial. EC was measured in the extracted solution.
1 soil:2 water by volume (“1:2”) 75mL of medium from the bottom 2/3 of the pot (or the whole cell for liners and plugs) was placed in a 250mL beaker and mixed thoroughly. 150mL of distilled water was added to the media sample. The mixture was stirred and let sit for 1 hour. pH and EC were tested by inserting the meter probes into the solution. Pour-Through leachate test (“Pour-Through”) 4-inch (10-cm) pots were placed in six-inch (15-cm) plastic saucers. 100mL
of distilled water was poured onto the media surface. Leachate was collected in the saucer. pH and EC were tested in the leachate. We did not use the Pour-Through method for plugs or liners.
Direct sensor measurement (“Direct Probe”)pH and EC were tested directly in the media with direct sensor probes (IQ 150 pH meter, Spectrum Technologies Inc. Plainfield, Ill.; Field Scout Soil & Water EC Meter, Spectrum Technologies, Inc. Plainfield, Ill.). Measurements were taken with the probes inserted 2/3 down the growing medium profile.
Media press extraction method (“Squeeze”) Solution was forced out of the bottom of the pot by pressing on the media surface. pH and EC were tested in the extracted solution.
Several experiments were run to collect data on a range in pH and EC levels. Experiments included both with and without plants, and with pH and EC levels created with different methods to cover a range of possible scenarios. Trials included: A) pH range in impatiens plug trays
Size-105 plugs of impatiens ‘Super Elfin Red’ were grown at five different lime rates (0, 0.6, 1.2, 1.8, and 2.4 g/L) of dolomitic hydrated lime (97% Ca(OH)2•MgO, National Lime and Stone, Findlay, Ohio) in which 92% of the lime passed
through a 45-µm screen. The medium was 70%/30% peat/perlite by volume and Aquagro 2000 wetting agent (Aquatrols, Pennsaulken, N.J.) was incorporated at 0.2L/m3. At mixing, 0.6 kg·m-3 of a commercial 6N-3P-7K-10Ca-1Mg pre-plant nutrient charge (composed of commercial-fertilizer grade KNO3, Ca(NO3)2, gypsum, triple superphosphate, and MgSO4
(GreenCare, Chicago, Ill.)). Plants were top-watered with PetersTM 20-10-20 (Scotts Co., Marysville, Ohio) at 200 ppm N with each irrigation before and after transplanting at four weeks into 4-inch-diameter pots with corresponding lime rate media and grown for an additional 4 weeks with 200 ppm N of 20-10-20. Three replicate samples were tested with each method. B) pH range in four-inch (10-cm) impatiens
Plugs were transplanted from experiment (A) into four-inch azalea pots on Nov. 21 2004 and grown for an additional four weeks. The growing medium included five different lime rates (0, 0.6, 1.2, 1.8, and 2.4 g/L) of dolomitic hydrated lime (97% Ca(OH)2•MgO,
National Lime and Stone, Findlay, Ohio) in which 92% of the lime passed through a 45-µm screen. The medium was 70%/30% peat/perlite by volume and Aquagro 2000 wetting agent (Aquatrols, Pennsaulken, N.J.) was incorporated at 0.2L/m3. At mixing, we incorporated 0.6 kg·m-3 of a commercial 6N-3P-7K-10Ca-1Mg pre-plant nutrient charge (composed of commercial-fertilizer grade KNO3, Ca(NO3)2, gypsum, triple superphosphate, and MgSO4
(GreenCare, Chicago, Ill.)). Plants were fertigated with each irrigation at 200 ppm N of 20-10-20. Three replicate samples were tested with each method.
C) pH range in liner trays with osteospermum
Five 105-size trays of osteospermum ‘Soprano Light Purple’ rooted liners in a peat/perlite growing medium (Fafard, Agawam, Mass.) were received from Pleasant View Gardens (Loudon, N.H.) on Jan. 4, 2005. The trays were cut to produce three sections each holding 35 plugs. Fertilizer treatments were applied to the tray sections on Jan. 4:
1. ferrous sulfate 7.2g/L 2. ferrous sulfate 3.6g/L 3. clear water
4. potassium bicarbonate 7.2g/L 5. potassium bicarbonate 3.6g/L
To apply the solutions, each partial plug tray was placed in a clean dish pan. 0.8L of the appropriate solution was poured evenly over the plugs. The tray was then left to soak in the excess solution for 10 minutes.
The trays were then held without further watering until Jan 7. On the morning of Jan 7 the trays were moistened with clear water and tested 1 hour later. Plugs were tested using the SME (3 x 3 plug replicates, 10mL water), 1:2 (3 x 3 plug replicates, 90mL water), Squeeze (3 x 3 plug replicates), and Direct Probe (3 x 1 plug replicates)
D) EC range in four-inch (10-cm) pots (no plants)
Four-inch (10-cm) diameter azalea pots were filled with commercial GreenwayTM (Blackmore Co., Belleville, Mich.) peat/perlite/vermiculite growing medium on Oct.28. No plants were used in this experiment. During the first week, the medium was fertilized 3 times. In the following 4 weeks, the growing medium was fertilized once per week. One tray of plugs and 25 pots were irrigated at each of the following PetersTM 20-10-20 (Scotts Co., Marysville, Ohio) fertilizer levels: 0ppm (clear water), 100, 200, 400, or 1000 ppm N. Five replicate pots were tested with each method. Soil tests were performed one hour after the last fertigation.
E) EC range in four-inch geranium
12-week-old pots of Americana Red zonal geraniums that had been grown with 17-5-17 at 200 ppm were leached four times and foliage was cut back on May 26 2005. A 20-5-10 slow release fertilizer (Doggett Corporation, Lebanon, N.J.) was applied to the surface of each container at 0, 2, 4, 6, or 8 grams/pot, with 25 pots/treatment (5 soil test methods, and 5 replicate pots/method). Plants were irrigated with clear water, and two weeks after fertilizer treatments were began, on June 9 2005, media pH and EC were tested on five replicates per fertilizer/soil test combination.
F) EC range in liner trays with brachycome
Five trays of size-84 brachycome ‘Toucan Tango’ rooted liners were received from Pleasant View Gardens (Loudon, N.H.) on 11 March, 2005 in a 70%/30% peat/perlite (Fafard, Agawam, Mass.) growing medium. Plants were grown with five fertilizer treatments (1 per tray): clear water, 100, 200, 400, or 800 ppm N from PetersTM 20-10-20 (Scotts Co., Marysville, Ohio).
Trays were top-watered daily for 7 days. On March 18, 2005, 1-2 hours after an irrigation, trays from each fertilizer level were tested with 4 methods and 8 replicates per method, as described for experiment (A).
G) EC range in plugs without plants trials a and b
Size-105 EllepotTM (Ellegaard, Satellite Beach, Fl.) plugs filled with commercial GreenwayTM (Blackmore Co., Belleville, Mich.) peat/perlite/vermiculite growing medium were used in this trial, which did not include plants. Plugs (three partial trays per fertilizer level) were fertilized three times per week for two weeks with Peters 20-10-20 fertilizer levels: 0ppm (clear water), 100, 200, 400, or 1000 ppm N. Three samples each consisting of 3 plugs were tested with each method. The trial was run twice in October 2004 and May 2005, and the Direct Probe method was only used in the second trial (b).
Results
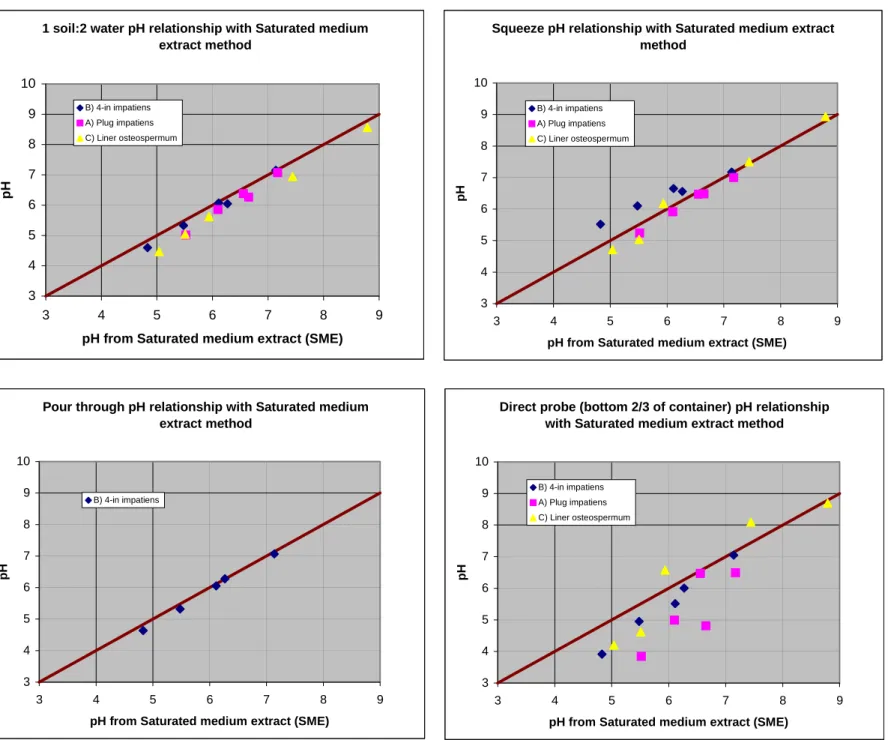
pH levels ranged from 4.8 to 8.8 using the SME method. In this range, pH levels of the 1:2, Pour-Through, and Squeeze methods were similar to the SME results (Figure 1). pH tests from the 1:2 averaged 0.3 pH units lower than the SME. The Direct Probe method had greater variability in pH levels compared with the SME, both within and between experiments (Figure 1). pH levels were lower using the Direct Probe than any other method, by up to 2 pH units.
Because of the consistency in pH measurements between methods, the same target pH range could be used for the 1:2, Pour-Through, Squeeze, and SME methods. These and other trials show, however, that differences in protocols can result in up to 0.5 pH unit differences within a soil test method, depending on the exact protocol followed (e.g. vacuum versus passive filtering).
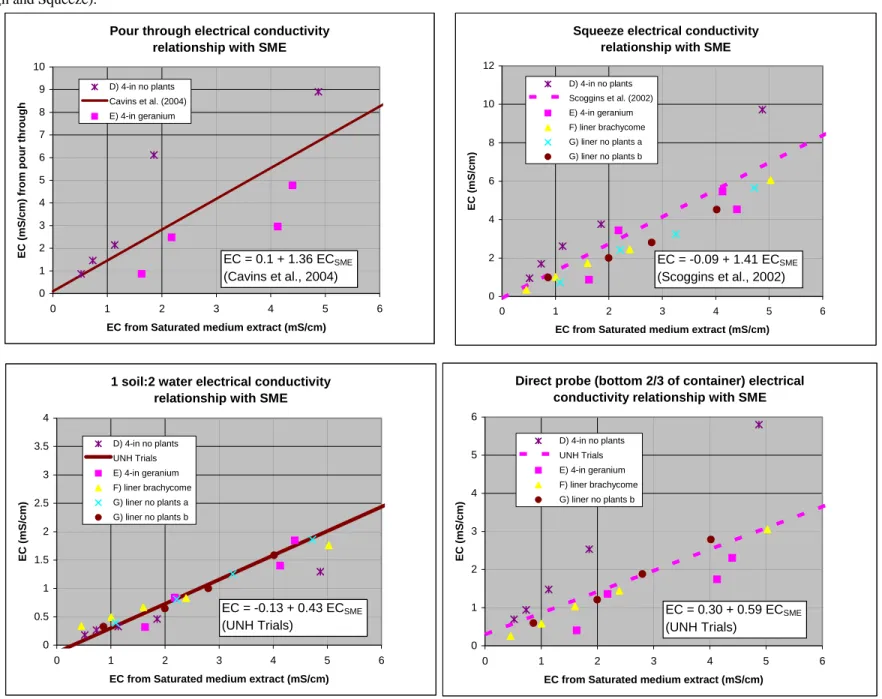
Media-EC has a straight-line (linear) relationship with nutrient concentration, and is therefore very sensitive to dilution in the soil testing method. The 1:2 test dilutes the sample more than the SME, and resulted in lower EC levels (Figure 2). The 1:2 method had less variability compared with the SME than other methods (Figure 2).
In contrast, the relationship between the Pour-Through, Squeeze, and Direct Probe results and the SME results was variable between experiments (Figure 2). We measured as close as possible to 1 hour after an irrigation, and none of the trials were run during dry, warm weather. However, there may have been differences in water content between samples particularly with the four-inch pots.
Trial (D) tended to have higher Pour-Through, Squeeze, and Direct Probe results than other trials at a given SME test level. The Squeeze measurements were slightly lower than the results from Scoggins et al., (2002), except for trial (D). For liners, the EC results from the Direct Probe was consistent between trials (G) (a) and (b).
Literature cited
Cavins, T.J., B.E. Whipker, and W.C. Fonteno. 2004. Establishment of calibration curves for comparing pour-through and saturated media extract nutrient values. HortScience 38(7):1635-1639.
Nelson, Paul V. 2003. Greenhouse Operation and Management, 6th Ed. Prentice Hall, Upper Saddle River, N.J.
Scoggins, H.L., D.A. Bailey, and P.V. Nelson. 2002. Efficacy of the press extraction method for bedding plant plug nutrient monitoring. HortScience 37(1):108-112.
Warncke, D. 1995. Recommended Test Procedures for Greenhouse Growth Media. Ch. 11, pp 76-83. In: Recommended Soil Testing Procedures for the Northeastern United States, 2nd Ed. University of Delaware Agricultural Experiment Station Bulletin #493.
Whipker, B. E., J. Dole, T. Cavins, J. Gibson, W. Fonteno, P. Nelson, D. Pitchay, and D. Bailey. Plant Root Zone Management. North Carolina State University.
1 soil:2 water pH relationship with Saturated medium extract method 3 4 5 6 7 8 9 10 3 4 5 6 7 8 9
pH from Saturated medium extract (SME)
pH
B) 4-in impatiens A) Plug impatiens C) Liner osteospermum
Pour through pH relationship with Saturated medium extract method 3 4 5 6 7 8 9 10 3 4 5 6 7 8 9
pH from Saturated medium extract (SME)
pH
B) 4-in impatiens
Squeeze pH relationship with Saturated medium extract method 3 4 5 6 7 8 9 10 3 4 5 6 7 8 9
pH from Saturated medium extract (SME)
pH
B) 4-in impatiens A) Plug impatiens C) Liner osteospermum
Direct probe (bottom 2/3 of container) pH relationship with Saturated medium extract method
3 4 5 6 7 8 9 10 3 4 5 6 7 8 9
pH from Saturated medium extract (SME)
pH
B) 4-in impatiens A) Plug impatiens C) Liner osteospermum
Figure 1. pH test results for the 1 soil:2 water (1:2), Pour-Through, Squeeze, and Direct Probe methods compared with the saturated medium extract (SME) method. Symbols represent the means of between 3 and 8 replicates depending on the experiment (see Research Methods section). Brown solid lines represent a 1:1 relationship.
Figure 2. Electrical conductivity (EC) test results for the 1 soil:2 water, Pour-Through, Squeeze, and Direct Probe methods compared with the saturated medium extract (SME) method. Symbols represent the means of between 3 and 8 replicates depending on the experiment (see Research Methods section). Brown solid lines show regression analysis from either the UNH trials (1:2 and Direct Probe measurement) or published research by North Carolina State Univ. (Pour-Through and Squeeze).
-0.12643 0.427336 Pour through electrical conductivity
relationship with SME
0 1 2 3 4 5 6 7 8 9 10 0 1 2 3 4 5 6
EC from Saturated medium extract (mS/cm)
E C ( m S /c m ) fr om p o u r th ro ug h D) 4-in no plants Cavins et al. (2004) E) 4-in geranium
1 soil:2 water electrical conductivity relationship with SME
0 0.5 1 1.5 2 2.5 3 3.5 4 0 1 2 3 4 5 6
EC from Saturated medium extract (mS/cm)
EC (mS/c m ) D) 4-in no plants UNH Trials E) 4-in geranium F) liner brachycome G) liner no plants a G) liner no plants b EC = -0.13 + 0.43 ECSME (UNH Trials)
Squeeze electrical conductivity relationship with SME
0 2 4 6 8 10 12 0 1 2 3 4 5 6
EC from Saturated medium extract (mS/cm)
EC ( m S/ c m ) D) 4-in no plants Scoggins et al. (2002) E) 4-in geranium F) liner brachycome G) liner no plants a G) liner no plants b EC = -0.09 + 1.41 ECSME (Scoggins et al., 2002)
Direct probe (bottom 2/3 of container) electrical conductivity relationship with SME
0 1 2 3 4 5 6 0 1 2 3 4 5 6
EC from Saturated medium extract (mS/cm)
EC ( m S/c m ) D) 4-in no plants UNH Trials E) 4-in geranium F) liner brachycome G) liner no plants b EC = 0.30 + 0.59 ECSME (UNH Trials) EC = 0.1 + 1.36 ECSME (Cavins et al., 2004)