IMPROVING SERVICE QUALITY AT AUTOMOTIVE DEALERSHIPS
V.A. LEKHELEBANA
208007797
A treatise submitted towards partial fulfilment of the requirements for the degree
Masters in Business Administration
in the
Faculty of Business and Economic Sciences
of the
Nelson Mandela Metropolitan University
Supervisor: Mr B.K. Heather
i
DECLARATION
DEPARTMENT OF ACADEMIC ADMINISTRATION EXAMINATION SECTION
SUMMERSTARND NORTH CAMPUS
PO Box 77000
Nelson Mandela Metropolitan University Port Elizabeth
6013
Enquiries: Postgraduate Examination Officer
DECLARATION BY CANDIDATE
NAME: VUYOKAZI ANNELINE LEKHELEBANA STUDENT NUMBER: 208007797
QUALIFICATION: MASTERS IN BUSINESS ADMINISTRATION
TITLE OF PROJECT: IMPROVING SERVICE QUALITY AT AUTOMOTIVE DEALERSHIPS.
DECLARATION:
In accordance with Rule G4.6.3, I hereby declare that the above-mentioned treatise/ dissertation/ thesis is my own work and that it has not previously been submitted for assessment to another University or for another qualification.
SIGNATURE: ________________________________________________________
ii
ABSTRACT
The highly competitive landscape of the automotive industry places increasing pressure on automotive dealerships to continually improve the quality of services rendered to customers. Understanding customer expectations and customer perceptions is key to making improvements in areas that matter most to the customer. It is against this background that this study was conducted. The aim of this research was to measure service quality at automotive dealerships.
The literature review focused on the gaps model which resulted in the SERVQUAL measuring tool. The SERVQUAL instrument is supported by literature as the optimal instrument for measuring service quality. The 22-item questionnaire was adapted and used to solicit feedback from customers on their expectations and perceptions of the service rendered by dealerships across the five SERVQUAL dimensions; namely, tangibles, reliability, responsiveness, empathy and assurance. Gaps between customer expectations and perceptions were calculated as an indication of areas where customer expectations were met, unmet or exceeded. In order to identify priorities for improvement, each of the SERVQUAL dimensions was ranked in order of importance by the customer.
Convenience sampling was used as a sampling technique. A total of 142 Volkswagen owners who had their vehicles serviced or repaired at a franchised dealership were surveyed. The reliability of the SERVQUAL questionnaire was tested by calculating the Cronbach’s Alpha coefficient for each of the five dimensions. The calculation yielded an average coefficient of 0.83, indicating a high reliability of the measuring instrument and the data collected.
The overall gap score of -0.7 indicates that customer expectations exceeded customer perceptions. The lowest customer perceptions and the largest gaps were reported in the reliability and responsiveness dimensions. These two dimensions were also rated as the most important dimensions customers use for evaluating service quality. This
iii
formed the basis for recommending that dealership employees and management focus most of their efforts on improving the reliability and responsiveness dimensions.
Key terms: Dealership, Service quality, Customer perceptions, Customer Expectations, SERVQUAL.
iv
ACKNOWLEDGEMENTS
I would like to express my sincere gratitude to everyone who played a role in the successful completion of this research project. Specifically, I would like to thank the following people:-
To the almighty God, for giving me the wisdom and strength to complete this research project.
To my research promoter, Mr. Bux Heather, for his patience, guidance and support during the course of this research.
My husband, Letlatsa for encouraging me to embark on this journey and for his endless support throughout.
To my parents, your love and support is beyond measure, I couldn’t have achieved this without you.
To my children Siphesihle, Thato and Tumelo, for their patience and understanding.
To my siblings for their encouragement and abundant support. To every respondent who took the time to participate in this study.
v TABLE OF CONTENTS DECLARATION ... i ABSTRACT ... i ACKNOWLEDGEMENTS ...iv LIST OF TABLES ...x LIST OF FIGURES………...……….. xi CHAPTER ONE... 1
INTRODUCTION, PROBLEM STATEMENT AND SCOPE OF THE STUDY... 1
1.1 INTRODUCTION... 1
1.2 MAIN PROBLEM STATEMENT ... 3
1.3 SUB-PROBLEMS... 3
1.4 DELIMITATION OF THE STUDY... 3
1.4.1 The organisation to be researched ... 4
1.4.2 Geographical delimitations ... 4
1.5 DEFINITION OF KEY CONCEPTS... 4
1.5.1 Motor vehicle manufacturer ... 4
1.5.2 Dealership ... 5
1.5.3 Service quality ... 5
1.6 SIGNIFICANCE OF THE STUDY... 5
1.7 RESEARCH METHODOLOGY... 6
1.7.1 Literature review ... 6
1.7.2 Empirical study ... 6
1.7.3 Data analysis ... 7
1.7.4 Development of conclusions ... 7
vi
1.9 SUMMARY ... 8
CHAPTER TWO ... 9
AN OVERVIEW OF THE SOUTH AFRICAN AUTOMOTIVE INDUSTRY ... 9
2.1 INTRODUCTION ... 9
2.2 THE SOUTH AFRICAN AUTOMOTIVE INDUSTRY ... 9
2.2.1 The role of the automotive industry in the South African economy... 9
2.2.2 South African based vehicle manufacturers ... 11
2.3 AN OVERVIEW OF THE DEALER NETWORK ... 13
2.4 SERVICE PERFOMANCE AT AUTOMOTIVE DEALERSHIPS... 17
2.5 CONCLUSION ... 20
CHAPTER THREE ... 21
SERVICE QUALITY MODELS AND MEASUREMENT ... 21
3.1 INTRODUCTION ... 21
3.2 SERVICE QUALITY ... 21
3.2.1 Definition of service and its characteristics ... 21
3.2.2 Definition of quality... 23
3.2.3 Definition of service quality ... 23
3.3 CUSTOMER SATISFACTION AND SERVICE QUALITY... 24
3.3.1 Definition of customer satisfaction... 24
3.3.2 The Relationship between Customer Satisfaction and Service Quality ... 25
3.4 SERVICE QUALITY MODELS... 27
3.4.1 Grönroos' Perceived Service Quality Model ... 28
3.4.2 The GAPs model of service quality ... 32
3.4.3 The SERVQUAL model of service quality ... 37
vii CHAPTER FOUR ... 41 RESEARCH METHODOLOGY... 41 4.1 INTRODUCTION... 41 4.2 RESEARCH PARADIGMS ... 41 4.2.1 Phenomenological Paradigm ... 42 4.2.2 Positivistic Paradigm ... 43
4.2.3 Comparison between positivistic and phenomenological paradigms ... 44
4.2.4 A justification for adopted research paradigm ... 46
4.3 SERVQUAL - The Measuring Instrument... 47
4.4 DATA COLLECTION ... 48 4.5 SAMPLING... 50 4.6 ETHICAL CONSIDERATIONS ... 50 4.7 DATA ANALYSIS ... 51 4.7.1 Reliability ... 51 4.7.2 Validity ... 52 4.8 CONCLUSION... 54 CHAPTER FIVE ... 55
DATA ANALYSIS AND DISCUSSION OF EMPIRICAL FINDINGS ... 55
5.1 INTRODUCTION... 55
5.2 ANALYSIS OF RESULTS OF THE QUESTIONNAIRE ... 55
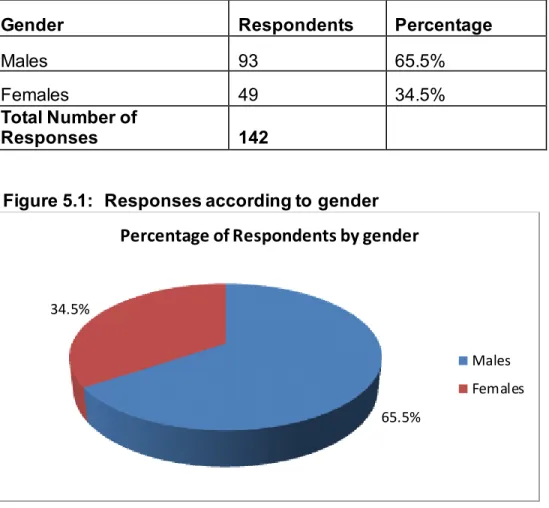
5.3 DEMOGRAPHIC INFORMATION ... 56
5.3.1 Responses to Question 1 ... 56
5.3.2 Responses to Question 2 ... 56
5.3.3 Responses to Question 3 ... 58
viii
5.4 WEIGHTING OF SERVICE QUALITY DIMENSIONS ... 61
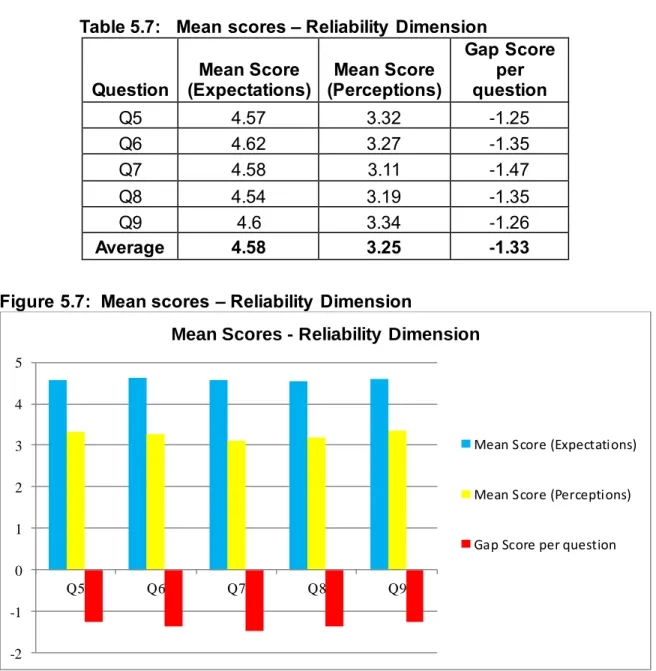
5.5 ANALYSIS OF FINDINGS ... 63 5.5.1 Tangibles Dimension ... 64 5.5.2 Reliability Dimension ... 66 5.5.3 Responsiveness Dimension ... 69 5.5.4 Assurance Dimension... 71 5.5.5 Empathy Dimension... 74
5.6 COMPARISON OF MEAN SCORES PER DIMENSION ... 77
5.7 RESPONDENTS’ SUGGESTIONS ON IMPROVEMENT AREAS ... 79
5.8 RESULTS OF THE RELIABILITY TEST ... 81
5.9 CONCLUSION ... 81
CHAPTER SIX ... 83
SUMMARY, CONCLUSION AND RECOMMENDATIONS ... 83
6.1 INTRODUCTION... 83
6.2 DISCUSSION AND INTERPRETATION OF FINDINGS ... 83
6.2.1 Customer expectations ... 84
6.2.2 Customer perceptions ... 84
6.2.3 Service gaps ... 85
6.2.4 Relative importance of service quality dimensions ... 87
6.2.5 Customer suggestions for business process improvements ... 88
6.2.6 Summary of the findings of the study ... 88
6.3 RECOMMENDATIONS BASED ON FINDINGS ... 89
6.4 LIMITATIONS OF THE STUDY ... 90
6.5 RECOMMENDATIONS FOR FUTURE RESEARCH ... 90
ix
LIST OF SOURCES... 92 ANNEXURE A ... 97
x
LIST OF TABLES
Table 2.1 Global Vehicle Production Ranking by Country 10
Table 4.1 Comparison of positivistic and phenomenological paradigms 45
Table 4.2 SERVQUAL dimensions and respective questions 49
Table 5.1 Responses according to gender 57
Table 5.2 Race of respondents 58
Table 5.3 Age distribution of respondents 59
Table 5.4 Respondents’ education level 60
Table 5.5 Average weighting per dimension 62
Table 5.6 Mean Scores – Tangibles Dimension 65
Table 5.7 Mean scores – Reliability Dimension 67
Table 5.8 Mean scores – Responsiveness dimension 69
Table 5.9 Mean scores – Assurance dimension 72
Table 5.10 Mean scores – Empathy dimension 75
Table 5.11 Summary of mean scores per dimension 77
xi
LIST OF FIGURES
Figure 2.1 Motor Vehicle Production Plants in South Africa 11
Figure 2.2 Passenger vehicle market share for 2011 12
Figure 2.3 Generic organisational structure of a dealership 14
Figure 2.4 CCSI Ranking for Service Index (Passenger Vehicles) 19
Figure 3.1 Grönroos' Perceived Service Quality model 29
Figure 3.2 The GAPs model of service quality 32
Figure 5.1 Responses according to gender 57
Figure 5.2 Race distribution of respondents 58
Figure 5.3 Age distribution of respondents 59
Figure 5.4 Respondents’ education level 61
Figure 5.5 Average weighting per dimension 63
Figure 5.6 Mean scores – Tangibles Dimension 65
Figure 5.7 Mean scores – Reliability Dimension 67
Figure 5.8 Mean scores – Responsiveness dimension 70
Figure 5.9 Mean Scores – Assurance Dimension 73
Figure 5.10 Mean Scores - Empathy Dimension 75
Figure 5.11 Mean scores per dimension 78
Figure 6.1 Lowest perception scores 85
Figure 6.2 Significant gap scores 86
1
CHAPTER ONE
INTRODUCTION, PROBLEM STATEMENT AND SCOPE OF THE STUDY
1.1 INTRODUCTION
The automotive industry has become increasingly competitive. The emergence of new entrants such as Chinese and Indian vehicle makers increases competition and threatens the sustainability of existing automotive manufacturers and retailers in South Africa. The competitive conditions facing the automotive industry have resulted in organisations having to shift their perspective from being suppliers of vehicles and related services to being customer driven organisations with customer centric processes in place. One manner in which automotive players in South Africa set themselves apart from competitors is through meeting and exceeding customer expectations. Automotive dealerships recognise the need to foster a customer centric culture and continuously implement various initiatives aimed at improving service levels.
Saxena (2009:98) suggests that as product differentiation reduces, the factor that enables companies to gain competitive edge is a focus on customer experience. All interactions that customers need to have should be examined meticulously and the experience be made pleasant and memorable. Raab, Riad, Vidyaranya and Goddard (2008:8) add that customer orientation is one of the most important factors of success needed to survive in an environment characterised by enormous competition. The goal of customer orientation is always customer satisfaction. Satisfied customers are more likely to choose the product again, passively or actively to recommend it, and to react with less price sensitivity. Goodman (2009: 256) suggests that the success of any organisation depends on high-quality customer service. He adds that for companies that strategically align customer service with their overall corporate strategy, it can transcend typical good business to become a profitable word-of-mouth machine that will transform the bottom line.
2
Today’s customer is better informed, more demanding and has high service level expectations. This makes it vital for any business to exceed customer needs and expectations at every encounter to achieve sustained success. A Customer Satisfaction Survey conducted by Accenture in 2007 (cited in Raab et al, 2008:56) found that 52 percent of respondents said their expectations for customer service were higher than in the period five years before. The survey also found that the number of consumers who left a company because of poor service was significantly higher than the number who left because they found a lower price elsewhere. Raab et al. (2008:63) argue that today’s customers are becoming harder to please; they are smarter, more demanding and less forgiving. More competitors with equal or better offers approach them, therefore the real challenges are not to produce satisfied customers, which several competitors can also do, but it is to produce delighted and loyal customers. Otherwise companies suffer from high customer churn; that is, high customer defection.
Parasuraman, Zeithaml and Berry (1985:42) suggest that knowing what customers expect is probably the most critical step in delivering good quality service. Ferrell and Hartline (2008:79) agree that understanding customer’s expectations is the basis for improving service levels. The delivery of superior customer service begins with understanding customer expectations. They argue that customer expectations are forever changing, therefore recommend staying in touch with customers by conducting frequent research to better identify their needs and expectations. Furthermore, these expectations need to be translated into quality standards. If customers want better ingredients, friendlier employees or faster delivery, then an organisation’s standards and processes should be set to match these expectations.
Against this background, automotive dealerships need to consistently seek to understand the ever changing customer expectations, assess their current service offering, identify gaps and implement changes that address these gaps with the aim of meeting and exceeding customer expectations.
3
1.2 MAIN PROBLEM STATEMENT
The main research question that the study seeks to address is:
How can service quality be improved at Volkswagen dealerships? 1.3 SUB-PROBLEMS
In order to address the main problem, the following sub-problems were identified:-
What are customers’ expectations of service from Volkswagen dealerships when servicing and repairing their vehicles?
What are customers’ perceptions of the service rendered by Volkswagen dealerships when servicing and repairing their vehicles?
What service gaps exist between customer expectations and customer perceptions in their experience of servicing and repairing their vehicles at Volkswagen dealerships?
Which factors are most important and have the most influence on customers’ perceptions of service quality?
Which business processes need improvement at dealerships in order to improve service quality.
1.4 DELIMITATION OF THE STUDY
Delimiting the study allows the researcher to set the parameters within which the study will be conducted. This is necessary to ensure that the study is not too broad and is clearly defined.
4
1.4.1 The organisation to be researched
For the purpose of this study it is necessary to draw the distinction between Volkswagen Group South Africa and Volkswagen dealerships. Volkswagen Group South Africa is the motor manufacturer responsible for the assembly of vehicles. Volkswagen dealerships are responsible for selling, maintaining and repairing vehicles. Dealerships act as vehicle distribution and maintenance centers and as such are at the forefront of customer interaction.
The research will be confined to Volkswagen passenger dealerships, with focus on the servicing and repair department of the dealerships. Only customers who own Volkswagen passenger vehicles and have had their vehicle serviced or repaired at Volkswagen dealerships will form part of the study.
1.4.2 Geographical delimitations
The study will be limited to customers who repair or service their vehicles at one of the Volkswagen dealerships located in the Eastern Cape.
1.5 DEFINITION OF KEY CONCEPTS
A definition of key terms used within the context of the study is offered below.
1.5.1 Motor vehicle manufacturer
A motor vehicle manufacturer, also known as an automotive Original Equipment Manufacturer (OEM), is a company that designs and manufactures motor vehicles. For the purpose of this study, Volkswagen Group South Africa is the selected motor vehicle manufacturer.
5
1.5.2 Dealership
An automotive dealership, also known as a franchised dealership, is a business authorised to sell, service and repair vehicles on behalf of the automotive manufacturer. The relationship between the automotive manufacturer and the dealership is usually governed by a franchise agreement.
1.5.3 Service quality
Service quality refers to a focused evaluation of how well a delivered service conforms to customer expectations. Parasuraman et al. (1985:41) defined service quality as the discrepancy between customer expectations and perceptions.
1.6 SIGNIFICANCE OF THE STUDY
Against the backdrop of a highly competitive environment, changing customer needs and high customer expectations, service quality is a business imperative for any organisation that wishes to survive in the long term. The vehicle sales process is equally as important; however, service after the sale is what sustains dealerships and retains customers in the long run. Failure to meet customer demands and exceed customer expectations could lead to loss of customers which translates to loss of revenue. This can have a negative impact on the organisation’s profitability and threatens the existence and sustainability of the organisation.
There is a wide body of work on the subject of service quality, customer service and customer satisfaction. However, the current body of work is limited with regard to what customers expect as good quality customer service when servicing or repairing a vehicle. In addition, given the dynamic nature of customer expectations, it is necessary to have them measured regularly. Identifying these customer expectations and the gaps that exist between the service rendered and customer expectations is critical. This will also uncover what customers perceive as important and assist the organisation in aligning its service offering to what matters most to the customer.
6
In highlighting the importance of excellent service quality, Saxena (2009:91) states that as the cost of acquiring a new customer is five times more than retaining an existing customer, encouraging brand loyalty is an ultimate goal for any business. Saxena (2009:80) emphasises the importance of service excellence and doing things right the first time and every time, He further states that bad service delivery not only creates a dissatisfied customer but also severely impacts the brand equity. This view is supported by Hill, Roche and Allen (2007:38) who suggest that satisfaction is the main driver of brand loyalty, but ‘mere satisfaction’ is not enough, customers have to be highly satisfied
This study will have a positive impact on customers, automotive dealerships and will positively influence how the Volkswagen brand is perceived.
1.7 RESEARCH METHODOLOGY
The broad research methodology pursued in this study to address the main and sub-problems is described below.
1.7.1 Literature review
An extensive literature review will form the basis of the research. The aim of the literature review is two-fold, firstly to discuss the concept of service quality and the theoretical framework for measuring service quality. The second aim of the literature study is provide an overview of the automotive industry and to outline service quality in the context of automotive dealerships.
1.7.2 Empirical study
The SERVQUAL instrument will be used to address the research questions as it is a widely accepted instrument for measuring service quality. The questionnaire will be customised to the automotive industry to elicit responses that will provide answers to the research questions. The questionnaire has been chosen to gather data from
7
respondents because it is self-administered and provides a simple way of collecting data. A pilot study will be undertaken to ensure that the questionnaire is clear and easy to understand.
1.7.3 Data analysis
Quantitative data collected from the completed questionnaires will be captured on Microsoft Excel and analysed by making use of the STATISTICA version 10 computer programme. The qualitative feedback will be summarised and categorised into themes.
1.7.4 Development of conclusions
The findings from the empirical study will be integrated with the theoretical perspective gained from the literature review. This will form the basis for drawing conclusions and providing recommendations on how to improve service quality at dealerships.
1.8 OUTLINE OF THE STUDY
The study will consist of the following six chapters:-
Chapter One - outlines the problem statement, the objectives of the study, the research methodology and the scope of the study.
Chapter Two – the South African automotive industry will be discussed and the concept of service quality in the context of automotive dealerships outlined.
Chapter Three - a literature review on the concept of service quality will be conducted and a theoretical framework for measuring service quality outlined.
8
Chapter Four - the research methodology that will be followed in the study will be discussed and the aspects that impact on the reliability and validity of the study explained.
Chapter Five – will comprise of the analysis of biographical data of the respondents, interpretation of empirical results and a summary of the results.
Chapter Six - will offer recommendations and conclusions of the study.
1.9 SUMMARY
This chapter introduced the research topic and discussed the purpose of the study. The main problem and the sub-problems were outlined. The delimitations of the study and the significance of the research were explained. Furthermore, a brief explanation of the research methodology followed in conducting the study was offered. An outline of the envisaged research study concludes this chapter.
Chapter Two will provide an overview of the automotive industry and discuss service quality in the context of the automotive industry.
9
CHAPTER TWO
AN OVERVIEW OF THE SOUTH AFRICAN AUTOMOTIVE INDUSTRY 2.1 INTRODUCTION
Chapter one introduced the research topic and discussed the purpose of the study. The main and the sub-problems were also outlined. Chapter two will set the scene for understanding the automotive industry. The relationship between vehicle manufacturer and the retail dealerships will be discussed. Furthermore, service quality in the context of automotive dealerships will be discussed.
2.2 THE SOUTH AFRICAN AUTOMOTIVE INDUSTRY
This section discusses the South African economy and the role of the automotive industry in the country.
2.2.1 The role of the automotive industry in the South African economy
South Africa is the economic powerhouse of Africa, leading the continent in industrial output and mineral production and generating a large proportion of Africa's electricity. South Africa is not only an important emerging economy; it is also the gateway to other African markets. Its well-developed road and rail links provide the platform and infrastructure for ground transportation deep into Africa (South Africa Economic Overview, 2011).
The automotive industry is the leading manufacturing sector in the South African economy. It is the largest contributor to the national GDP after the mining and financial sectors (South Africa Economic Overview, 2011). The South African motor industry incorporates the manufacture, distribution, servicing and maintenance of motor vehicles and plays a vital role in South Africa’s economy. South Africa’s automotive industry is the country’s largest manufacturing sector, contributing between 6 percent and 7 percent of gross domestic product. This contribution takes into account vehicle and
10
component production, as well as vehicle retail, distribution and servicing activities (South Africa Economic Overview, 2011).
The global world production in 2011 amounted to over 8 million vehicles. South Africa produced 533 000 units for the same year, accounting for only 0.66 percent of the world’s vehicle production (NAAMSA, 2011). Table 2.1 below shows volume produced per country and ranks the various countries accordingly.
Table 2.1: Global Vehicle Production Ranking by Country
Rank Country Production in thousands ('000) % of Global Production 1 China 18419 22.87% 2 USA 8654 10.74% 3 Japan 8399 10.43% 4 Germany 6304 7.83% 5 South Korea 4657 5.78% 6 India 3936 4.89% 7 Brazil 3406 4.23% 8 Mexico 2680 3.33% 9 Spain 2354 2.92% 10 France 2295 2.85% 11 Canada 2135 2.65% 12 Russia 1988 2.47% 13 Iran 1649 2.05% 14 Thailand 1478 1.83% 15 United Kingdom 1464 1.82% 16 Czech Republic 1200 1.49% 17 Turkey 1189 1.48% 18 Indonesia 838 1.04% 19 Poland 837 1.04% 20 Argentina 829 1.03% 21 Italy 790 0.98% 22 Slovakia 640 0.79% 23 Belgium 562 0.70% 24 Malaysia 540 0.67% 25 South Africa 533 0.66% Source: NAAMSA (2011)
11
Table 2.1 above depicts that South Africa ranks at position 25 and is therefore a small player in the global automotive arena. Locally however, the automotive sector is a significant sector, employing around 36 000 people (NAAMSA, 2011).
2.2.2 South African based vehicle manufacturers
South Africa’s vehicle manufacturing industry is concentrated in three of the country’s nine provinces, namely Gauteng, the Eastern Cape and KwaZulu-Natal, and in close proximity to its suppliers (Automotive Export Manual SA, 2011). Figure 2.1 below shows vehicle manufacturers with production plants in South Africa and their respective locations.
Figure 2.1: Motor Vehicle Production Plants in South Africa
12
Figure 2.1 shows that most of the major vehicle makers are represented in South Africa. The South African automotive market is highly competitive with 60 brands and over 1100 models available to the consumer. Local vehicle manufacturers compete with each other for market share as well as with importers who are keen to make inroads into the South African market (NAAMSA, 2011). Figure 2.2 shows the market share of the manufacturers represented in the South African passenger market for 2011.
Figure 2.2: Passenger vehicle market share for 2011
Source: NAAMSA (2011)
Figure 2.2 shows that the Volkswagen Group, consisting of Volkswagen and Audi brands, were market leaders with a total market share of 22.5 percent in 2011 The Hyundai Group, inclusive of Hyundai, KIA and Daihatsu brands, achieved second position with 17.9 percent market share. This was followed by the Toyota Group consisting of the Toyota and Lexus brands at 13.2 percent market share.
13
2.3 AN OVERVIEW OF THE DEALER NETWORK
An automotive dealership acts as a local vehicle distribution and maintenance centre on behalf of the manufacturer. Dealerships serve as the link between the assembly line and the customer, thus act as an extension of the manufacturer. They support the manufacturers’ efforts by providing a vast distribution channel that allows for efficient flow of product to the public (NADA, 2012). Dealerships typically offer the following services to customers:-
Sell new vehicles, parts and accessories; Arrange financing and insurance services; Perform vehicle service and repairs; Fulfil manufacturer warranty obligations; Handle product safety recalls;
Facilitate the exchange of used vehicles. (NADA, 2012)
A typical dealership is based in a large establishment with ample parking space outside and a building large enough to accommodate both vehicles and office space, The layout of a dealerships consists of a showroom for displaying new cars, an outside parking lot for stocking used cars, offices for personnel, as well as a separate entrance to the Service Department where parts are stored and vehicles serviced and repaired. Dealerships also have wash bay facilities for washing customers’ vehicles.
14
Figure 2.3: Generic organisational structure of a dealership
Source: NADA (2012)
The typical role played by each incumbent on the organogram is outlined below.
Dealer Principal (DP) – the DP the most senior person at the dealership. The main responsibility of the DP is the strategic planning and execution for the business. The DP’s role includes ensuring the dealership meets its sales targets and is profitable, and guaranteeing optimum customer satisfaction. Negotiating deals with customers also forms a significant part of the job (NADA, 2012).
Finance and Insurance Manager (F&I Manager) – the primary tasks of the F&I Manager are completing all the legal paperwork involved in the purchase of a
15
vehicle, arranging credit for customers who need it, and then helping those customers protect their investments by presenting them with option packages. The F&I Department offer services far beyond credit and insurance. They also offer vehicle protection contracts and aftermarket products designed to protect the customer’s investment, such as alarm systems and products that protect vehicle finish and interior fabric. The Finance Department’s services focus attention on the benefits of financial arrangements and protection for both customers and their new vehicles (NADA, 2012).
Sales Manager – the Sales Manager is responsible for managing sales personnel and keeping abreast of market trends and forecasts. Sales Managers are required to maintain the profitability of their department while controlling expenses and maintaining acceptable levels of customer satisfaction (NADA, 2012).
Service Manager – the Service Manager is responsible for managing the service operations of the dealership’s workshop and service department and the personnel of the Service Department. Financial management and reporting, maintaining acceptable levels of customer satisfaction and ensuring the department is profitable are some of the key performance areas of a Service Manager (NADA, 2012).
Parts Manager – the Parts Manager works with the Service Manager to ensure a timely turnaround of parts needed for repair and mechanical jobs. The Parts Manager is responsible for maintaining a balanced inventory consistent with the requirements of the Service Department and ad hoc DIY parts purchases (NADA, 2012).
Sales Executive – A Sales Executive is the first point of contact for customers wishing to purchase a vehicle from the dealership. The main purpose of the job is to match customer requirements with available products and services. Sales Executives are required to meet sales targets for the sale of vehicles,
16
accessories and associated warranty, finance and insurance products whilst securing profits acceptable to the dealership’s business (NADA, 2012).
Service Advisor – the Service Advisor is responsible for receiving customers bringing their cars in for service or repairs, documenting all customer concerns, selling needed service and repairs, handling factory and extended warranties, arranging alternative transportation for the customer, providing estimates, keeping the customer informed as to the progress of repairs and explaining the finalised repair order to the customer. Service Advisors translate the customer's concerns and the actual reality of a repair problem into the standard language of a repair order (NADA, 2012).
Service Technician (also known as a Mechanic) – Service Technicians are considered the lifeblood of the Service Department as they are the ones who physically fix vehicles. They have advanced training in a particular area of automotive repair or on a certain make of vehicle. Training for service technicians is an ongoing process as new vehicles go into production every year. With these new vehicles come the latest technologies that must be learned, in addition to advancements in repair procedures for the older models. Technicians advise service advisors when problems exist that may require additional parts or services (NADA, 2012).
Cashier – the cashier is responsible for collecting money and processing payments due (NADA, 2012).
Booking Clerk – a Booking Clerk is responsible for booking in vehicles and scheduling service and repair date on the dealerships systems. A Booking Clerk is also responsible for advising customers on duration of repairs and gai ning authority for any additional work that may need carrying out (NADA:2012).
Driver – the Driver is responsible for the dealership’s shuttle service, which involves transporting customers from the dealership to their destinations. Drivers also deliver customer’s vehicles on request (NADA, 2012).
17
Cleaner – is responsible for keeping the shop floor and all internal areas of the dealership clean (NADA, 2012).
Wash Bay Attendant – is responsible for cleaning the interior and exterior of customer vehicles (NADA, 2012).
Administrative Personnel – administrative personnel are responsible for all administrative functions within the Finance and Insurance department of the dealership. Duties include paying all creditors, issuing invoices to debtors, bookkeeping and payroll administration (NADA, 2012).
Picker and Packer – A Picker and Packer is responsible for arranging and controlling receipt and dispatch of goods and keeping records. . The role also involves picking and packing goods to be transported, Carrying goods to be loaded on or unloaded from vans and trucks, carrying and stacking goods in the warehouses and sorting parts (NADA, 2012).
Service Greeter (also known as “Meeter and Greeter”) – Service Greeters are mostly employed at larger high-volume dealerships. Greeters function as "traffic police" to help guide the high flow of customers into the appropriate area. Typical job duties for a greeter include setting service appointments, verifying appointments, providing follow-up calls and informing the appropriate service advisor of your arrival. They also provide customers with a friendly face and a beverage upon arrival at the dealership (NADA, 2012).
2.4 SERVICE PERFORMANCE AT AUTOMOTIVE DEALERSHIPS
Nyadzayo and Roberts-Lombard (2010:160) suggest that the competitiveness of the South African motor industry places pressure on vehicle retailers to focus on customer retention. They emphasise the need for automotive retailers to be customer centric in their approach if customer retention is their goal.
Customer service performance in the automotive dealership setting is measured by the Customer Satisfaction Index (CSI). An independent market research company called
18
Ipsos measures the customer service performance of dealerships on the sales and the service and repair experience as perceived by customers. The results are then ranked by manufacturer performance and used as an indicator of dealership performance in the service aspect. The ranked results are known as Competitor Customer Satisfaction Index (CCSI) (Synovate, 2011). The CCSI questions are standard for all competitor manufacturers, thus all the customers of different manufacturers get to answer the exact same questions. The CCSI includes the Sales measurements for customers who have purchased a vehicle; and a Service measurement used to measure customer satisfaction when servicing or repairing a vehicle. The results are grouped into Passenger Vehicles and Light Commercial Vehicles to allow for direct comparisons to be made (Synovate, 2011).
For the purpose of this study, only passenger vehicle scores will be considered. In addition, only the Service measurement will be considered relevant to the study. Figure 2.4 below illustrates CCSI scores from January 2008 to December 2011 and ranks service performance scores of competitors in the passenger vehicle market.
19
Figure 2.4: CCSI Ranking for Service Index (Passenger Vehicles)
Source: Synovate (2011)
Figure 2.4 above shows that from January 2011 to December 2011 Chevrolet achieved a benchmark score in the service CCSI. Lexus and Volkswagen achieved second and third positions respectively. Also interesting to note is the increase in benchmark scores from 2008 to 2012. In 2008 Nissan achieved a benchmark score of 85.5 percent. The benchmark score increased to 89.8 percent in 2009, achieved by Lexus. The score increased further in 2010 and 2011 with Mitsubishi and Chevrolet attaining leading position with scores of 87.7 percent and 88.0 percent respectively. The continuous improvement of benchmark scores points to increased competition amongst automotive dealers to continuously improve service levels (Synovate, 2011).
20
2.5 CONCLUSION
This chapter provided an overview of the South African automotive industry and its role in the country’s economy. The relationship between vehicle manufacturers and their respective dealerships was detailed. Customer service in the automotive dealer network was discussed. Chapter three will review literature relating to service quality and the framework for measuring service quality.
21
CHAPTER THREE
SERVICE QUALITY MODELS AND MEASUREMENT
3.1 INTRODUCTION
Chapter two provided an overview of the South African automotive industry and outlined service quality in the industry. The aim of Chapter three is to provide a theoretical framework for the study being conducted. This section of the study seeks to define service quality and customer service and the relationship between the two concepts. A literature review of conceptual service quality models as researched by academics in the field will be conducted. These models seek to answer the question of what really determines service quality as perceived by customers. SERVQUAL, a service quality framework will also be discussed.
3.2 SERVICE QUALITY
The concepts of “service” and “quality” will be defined separately before exploring the concept of service quality
3.2.1 Definition of service and its characteristics
Grönroos (2007:27) defines a service as an activity or series of activities of a more or less intangible nature that normally, but not necessarily, takes place in interactions between the customer and service employees and/or systems of the service provider, which are provided as solutions to customer problems. According to Lakhe and Mohanty (1994:40) a service is a type of economic activity that is intangible, is not stored and does not result in ownership. A service is consumed at the point of sale. Services are one of the two key components of economics, the other being goods. Examples of services include the transfer of goods, such as the postal service delivering mail, and the use of expertise or experience, such as a person visiting a doctor. According to this approach, services are different from goods because they are intangible and heterogeneous and are simultaneously produced and consumed.
22
Kotler, Hayes and Bloom (2002:61) discuss the distinctive characteristics of a service that set it apart from physical goods, as intangibility, inseparability, variability (heterogeneity), and perishability. These characteristics are discussed below:-
Intangibility - Most services are not physical and cannot be touched, seen, heard, smelt or tasted by customers. New service concepts can therefore easily be copied by competitors (Kotler et al., 2002).
Inseparability - The production and consumption of a service occurs simultaneously. The customer is thus involved in the production of the service (Kotler et al., 2002). According to Zeithaml and Bitner (2003:22) the quality of service and consumer satisfaction is highly dependent on what happens in “real time,” including actions of employees and the interactions between employees and customers.
Variability (Heterogeneity) – Kotler et al. (2002:13) argue that due to the variability of the nature of service, the service provider is not able to standardise the quality thereof, thus making it possible for it to change over time. Zeithaml and Bitner (2003:22) add that because the performance of services always involves a human element even if only on the part of the user, they cannot be standardised in the same way that goods can. Services are subject to some variation in performance and developing realistic standards of performance is extremely difficult.
Perishability – Kotler et al. (2002:13) stated that perishability of services means that they cannot be stored for later sale or use. They add that this characteristic of the service delivery process can cause severe problems if the demand for services is not uniformly distributed over time. They point out that service providers can overcome the fluctuation in the demand for services by careful planning.
23
3.2.2 Definition of quality
Kotler (2000:23) cites the following definitions of quality from existing literature:-
Quality is fitness for use (Juran, 1988); the core of a total quality approach is to identify and meet the requirements of both internal and external customers (Oakland, 1989); Quality means conformance to requirements (Crosby, 1997); Quality is to satisfy customers’ requirements continually (Kanji, 1990). Kotler (2000:23) pointed out that though quality has various definitions, literature agrees that quality is about meeting customer requirements and satisfying customer needs. According to Parasuraman et al. (1985:41) quality is an elusive and indistinct construct. Quality and its requirements are not easily articulated by consumers, therefore also difficult to measure. However, its importance to firms and consumers is unequivocal. Furthermore Parasuraman et al. (1985:41) emphasised that in a service business, the four Ps of marketing – Product, Place, Promotion and Price – have no use without a Q (quality).
3.2.3 Definition of service quality
Parasuraman et al. (1985:43) define service quality as the global evaluation or attitude of overall excellence of services. Thus, service quality is the difference between customers’ expectation and perceptions of service delivered by service firms. Parasuraman et al. (1985:44) view quality as the degree and direction of discrepancy between customers’ service perception and expectations. Lehtinen and Lehtinen (1982:81) defined service quality in terms of physical quality, interactive quality and corporate (image) quality. Physical quality relates to the tangible aspects of the service. Interactive quality involves the interactive nature of services and refers to the two-way flow that occurs between the customer and the service provider, or his/her representative, including both automated and animated interactions. Corporate quality refers to the image attributed to a service provider by its current and potential customers, as well as other publics. They also suggest that when compared with the other two quality dimensions, corporate quality tended to be more stable over time. According to Lewis and Booms (1983) cited in Raab et al. (2008:12) service quality is a
24
measure of how well the service level delivered matches customer expectations. Delivering quality service means conforming to customer expectations on a consistent basis.
In emphasising the importance of quality, Raab et al. (2008:14) stated that quality does it all. It sells, it satisfies; therefore how an organisation manages quality in service is the pivotal issue in today’s service economy. Raab et al. (2008:14) agree that service quality is one of the most influencing factors in a consumer’s purchase decision process. An empirical study conducted by Buzzell and Bradley (1987), cited in Kotler (2000:25) showed a positive relationship between service quality and organisational performance. Buzzell and Bradley concluded that the most critical factor affecting a business unit’s performance is the service quality of its products and services as perceived by the market relative to the perception about its competitors.
3.3 CUSTOMER SATISFACTION AND SERVICE QUALITY
Previous scholars have studied the relationship between customer satisfaction and service quality. A definition of service quality has been offered in 3.2.3 above. A definition of customer satisfaction is offered below followed by a discussion of the relationship between the two concepts as viewed by different scholars.
3.3.1 Definition of customer satisfaction
Kotler (2000:18) defined customer satisfaction as the level of a person’s felt state resulting from comparing a product’s perceived performance or outcome in comparison to his own expectations. He further stated that customer satisfaction is a highly personal assessment that is greatly affected by customer expectations. According to Padilla (1996:12) customer satisfaction is based on the customer’s experience of both contact with the organisation (the moment of truth) and personal outcomes. Customer satisfaction can be experienced in a variety of situations and connected to both goods and services. Padilla (1996:39) further states that customer satisfaction differs
25
depending on the situation and the product or service. A customer may be satisfied with a product or service, an experience, a purchase decision, a salesperson, store, service provider, or an attribute or any of these.
Based on the literature, it can be inferred that customer satisfaction is a measure of how a product and/or service provided by an organisation meets or exceeds customer expectations. It can also be inferred that customer service is about individual expectations and that dissatisfaction is a result of these expectations not being met fully. Thus, the level of customer satisfaction is determined by the customer’s evaluation of the service experience as compared to their expectations.
3.3.2 The Relationship between Customer Satisfaction and Service Quality
Sureshchandar (2002:22) argues that service quality and customer satisfaction are inarguably the two core concept that are the crux of marketing. He also states that in today’s world of intense competition, the key to sustainable competitive advantage lies in delivering high quality service that will in turn result in satisfied customers. Sureshchandar (2002:23) further states that there are two opposing views with regard to the relationship between service quality and customer satisfaction. In contrasting the two concepts, he cites work from various scholars. Bolton and Drew (1991) cited in Sureshchandar (2002:25) believe that customer satisfaction is an antecedent of service quality, while service quality is viewed as a global perception. Sureshchandar (2002:25), on the other hand, maintain that service quality is the cause of customer satisfaction. Gottlieb, Grewal and Brown (1994:44) emphasise the need to focus on service quality and customer satisfaction, stating that service quality is a predecessor of the broader concept of customer satisfaction and the relationship between service quality and loyalty is mediated by satisfaction. They further state that customer satisfaction is a prerequisite for customer retention and loyalty, and helps in realising economic goals such as profitability, market share and return on investment. Tjiptono (1997) cited in Sureshchandar (2002:15) agrees that the creation of customer satisfaction can provide
26
several benefits, including harmonious relationships between companies and consumers, providing a good basis for the purchase and re-creation of customer loyalty, and form a recommendation by word of mouth that can benefit the company.
According to Sureshchandar (2002:16), the relationship between service quality and customer satisfaction has received considerable academic attention in the past few years. Research results have shown that the two constructs are indeed independent, but are closely related, implying that an increase in one is likely to lead to an increase in the other. Padilla (1996:49) agrees that the relationship between service quality and customer satisfaction has received considerable attention in the marketing literature. He further points out that numerous empirical studies have reported the positive relationship between customer satisfaction and service quality and suggest that service quality is a component of satisfaction. Firms that provide superior service quality also have a more satisfied customer base.
In contrasting the two concepts, Zeithaml and Bitner (2003:85) argue that service quality is a focused evaluation that reflects the customer's perception of specific dimensions of service: reliability, responsiveness, assurance, empathy, and tangibles. Customer satisfaction, on other hand, is more inclusive: it is influenced by perceptions of service quality, product quality, and price as well as situational factors and personal factors. According to Zeithaml and Bitner, customer satisfaction and service quality are fundamentally different in terms of their underlying causes and outcomes. Although they have certain things in common, satisfaction is generally viewed as a broader concept, whereas service quality assessment focuses specifically on dimensions of service. Service quality can be viewed as a component of customer satisfaction.
In a study conducted by Sureshchandar (2002:47) to establish the relationship between service quality and customer satisfaction, he sought to answer the following two questions:-
27 If so, are they correlated or not?
The study found that there exists a great dependency between service quality and customer satisfaction, and that an increase in one is likely to lead to an increase in another. The investigation also showed that although there is a strong correlation between service quality and customer satisfaction, the two constructs are indeed different. It therefore becomes imperative for an organisation to view the two constructs separately.
Sureshchandar (2002:48) recommends that quality improvements by management should not merely focus on improving customer satisfaction but also target an improvement in customer perception of overall service quality. The service providers should attempt to continuously improve both service quality and customer satisfaction, as customer satisfaction alone may not be sufficient. The veritable gains of a quality revolution come only from customer delight, which to a great extent depends on a customer’s perception of the overall service quality.
3.4 SERVICE QUALITY MODELS
A number of models attempt to capture and define the concept of service quality. According to Salazar, Costa and Rita (2007:47) each of these models have their strengths and weaknesses. However, in the end the core definition is simple and consistent: service quality is customers thinking they are getting better service than expected. They point out that an organisation might think they deliver better service than competitors; however, if the customer perceives your service to be worse than that of your competitors, then that is all that matters. This is often referred to as the perception gap; that is, the gap between what the customer expects and what they think they received. The perception gap is difficult to measure, difficult to manage and is likely to change with time and experience, nevertheless it is vital to business success.
Salazar et al. (2007:48) conclude that the definition of service quality clearly indicates that what consumers assess through their own measurement criteria based on their
28
expectations and perceptions of a service experience is service quality. He further states that service organisations have to manage the concept from the customer’s point of view. Organisations need to understand what consumers are really looking for and what and how they evaluate the product or service.
The following models will be outlined and discussed in detail.
Grönroos' Perceived Service Quality model considers what actually creates expectations and perceptions.
The GAP model looks at what corporate processes are involved in managing and changing the perception gap and what strategic changes an organisation must make to improve service quality.
SERVQUAL (also known as the RATER model) outlines key criteria that customers use to measure service quality.
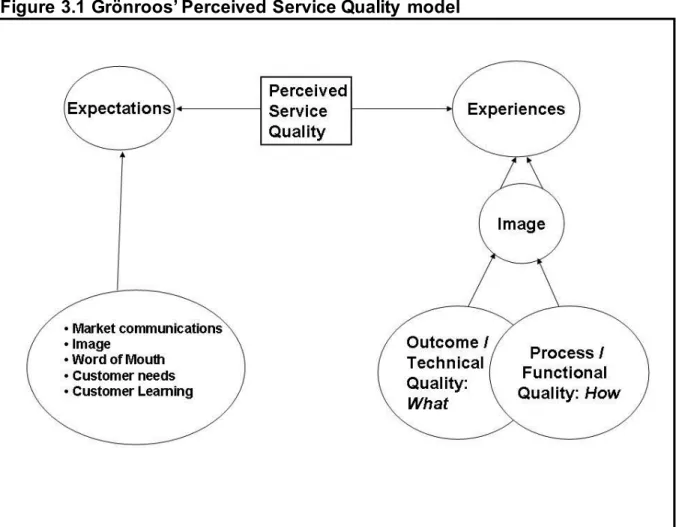
3.4.1 Grönroos' Perceived Service Quality Model
Grönroos (1984:19) states that the service quality experienced by a customer has two dimensions; namely technical quality and functional quality. Functional quality describes how the service is delivered and technical quality describes what the customer received during a service delivery.
29
Figure 3.1 Grönroos’ Perceived Service Quality model
Source: Adapted from Rao (2007:149)
Figure 3.1 depicts Grönroos' Perceived Service Quality model which illustrates that expectations are a function of market communications, image, word of mouth, and consumer needs and learning, whereas experience is a product of a technical (what/outcome) and functional quality (how / process), which is filtered through the image (who). Grönroos (1984:22) suggests that the customer experience is a product of the image of supplier quality and that of marketing as well as process, and technical quality has an effect on the perception gap
Grönroos (1990:81) identified a list of six determinants and divided these into three criteria – outcome-related, process-related and image-related criteria. These are discussed below.
30
Outcome-related criteria
Professionalism and skills – customers realise that the service provider, the employees, operational systems and physical resources have the knowledge and skills required to solve their problems in a professional way (Grönroos, 2007).
Process-related criteria
Attitudes and behaviour – Customers feel that the service employees are concerned about them and interested in solving their problems in a friendly and spontaneous way (Grönroos, 2007).
Accessibility and flexibility – customers feel that the service provider, the location, operating hours, employees and operational systems are designed and operate so that it is easy to gain access to the service, and that the services are adjusted to the demands and wishes of the customer in a flexible way (Grönroos, 2007). Reliability and trustworthiness – customers know that whatever takes place or
has been agreed upon, they can rely on the service provider, the employees and systems, to keep promises and perform with the best interest of the customers at heart (Grönroos, 2007).
Recovery – customers realise that whenever something goes wrong or something unpredictable happens, the service provider will immediately and actively take action to control the situation and find a new, acceptable solution (Grönroos, 2007).
Image-related criteria
Reputation and credibility – customers believe that the service provider’s business can be trusted and gives adequate value for money and that it stands for good performance and values which can be shared by customers and the service provider (Grönroos, 2007).
Rao supports Grönroos’ model of service quality. According to Rao (2007:150) every consumer makes an assessment of quality based upon the expectations that he has
31
developed of a service offering. In support of Grönroos’ theory, he discusses the following four factors that influence consumers while forming expectations:-
Market communication - market communication refers to the authentic source of information with an identified sponsor and, therefore plays a vital role in the formation of consumer expectation (Rao, 2007).
Image – the image of a service firm at both corporate and local level influences the expectation of the customers. An image of proven skills, consistency, innovativeness, care and concern, empathy, performance and handling problems well are some of the identities companies develop over a period of time. These identities mould customer perceptions (Rao, 2007).
Word-of-mouth communications – Rao (2007:151) says word-of-mouth communications are the most powerful, particularly in cases of services. He states that as services are intangible and variable, consumers often feel less confident about taking a purchase decision based upon communication from the service provider. They tend to look for advice and information support from others, whom they consider as having more knowledge and experience in that particular service, and who will give an honest opinion about the service.
Rao (2007:167) further states that the stakeholders that influence service quality are the management of the organisation;
the employees and the customers.
To emphasise the role of each stakeholder in service quality, he cites a service quality management framework as developed by Grönroos (1990). According to this framework, management of the organisation decide the quality specifications. This is communicated to employees through internal marketing and to consumers through external marketing. The internal marketing efforts result in employee perception of desired service quality. External marketing, which aims at communicating with the target market, develops quality expectations in them. Customers with quality perceptions will interact with employees of the firm who decides the service to be offered and executes
32
it. Customers who experience service quality will evaluate quality by comparing experienced quality with expected quality and come to a conclusion on the perceived quality.
3.4.2 The GAPs model of service quality
The GAPs model of perceived service quality was developed by Parasuraman, Zeithaml and Berry in 1985. Figure 3.2 below illustrates the conceptual framework of the GAPs model.
Figure 3.2: The GAPs model of service quality
33
The GAPs model of service quality is divided into two parts: one part relates to the internal process in a customer and the other part relates to the process involved between the service provider and the consumer. The model incorporates five gaps that an organisation should measure, manage and minimise. According to Rao (2007:167) each gap arises due to inconsistencies and deficiencies in the quality management process. The possible reasons for each gap arising and how each gap arises is discussed below.
3.4.2.1 Gap one - Customer Expectations – Management Perceptions Gap
This is the gap between management’s perceptions of consumer expectations and expected service; thus, the distance between what customers expect and what managers think they expect. Improper understanding or misunderstanding of consumer expectations is one of the root causes for not delivering services that satisfy consumer expectations. Rao (2007:167) lists the following as factors that lead to gap one:-
Insufficient market research;
Inaccurate information from marketing research; Poorly interpreted information about expectations; No demand analysis;
Research not focused on service quality;
Lack of interaction between management and customers; Insufficient upwards and downward internal communication; Lack of market segmentation;
Too many organisational layers between contact personnel and top management;
No relationship focus.
Parasuraman et al. (1988:54) recommend the following actions in order to close this gap.
Companies should carry out marketing research and managers must learn to turn research information and insights into action;
34
Managers should spend time on the line, interacting with customers and experiencing service delivery;
Improving upward communication from contact personnel to management, and
Eliminating levels of management allows managers to be closer to the customers and better understand their needs and expectations.
3.4.2.2 Gap two - Management Perceptions - Service Quality Specifications Gap This gap relates to the gap between management’s perception of consumers’ expectations and the translation of those perceptions into service quality specifications. According to Rao (2007:168) gap two may occur due to the following reasons:-
Mistakes in planning or insufficient planning procedures; Lack of customer-driven service standards;
Lack of formal process for setting service quality goals; Lack of management commitment;
Unclear service designs;
Unsystematic new service development process; Lack of support from top management.
Parasuraman et al. (1988:54) suggest the following actions steps for management to minimise the gap:-
Increase commitment to service quality, constantly and visibly express their commitments to the employees;
Be open to innovation, being receptive to different and possibly better ways of doing business;
Standardising routine transactions, and
35
3.4.2.3 Gap Three - Service Quality Specifications - Service Delivery Gap
This refers to the gap between translation of perceptions of service quality specification and service delivery. Rao (2007:168) states that formulation of clear guidelines for performing services may not assure quality service performance. The standards must be supported by adequate and appropriate resources such as people, systems and technology. Employee motivation and satisfaction play an important role in the process. He further identifies the following reasons the service delivery gap exists:-
Complicated and/or rigid process specifications;
Deficiencies in human resource policies such as role ambiguity, ineffective recruitment, role conflict etcetera;
Ineffective internal marketing;
Poor management of service operations; Failure to match demand and capacity;
Lack of proper customer education and training.
To reduce this gap, Parasuraman et al. (1988:55) suggest the following solutions:-
Employees need specific and frequent communication from supervisors and managers about what they are expected to do.
Employees need to know how well they are performing compared to the standards and expectations that management sets for them.
Employees need to feel confident and competent in their jobs; this can be achieved through training them and equipping them with the necessary skills to satisfy customers.
3.4.2.4 GAP Four – Service Delivery - External Communications Gap
The external communication gap refers to the gap between service delivery and external communications to consumers. This gap arises when promises do not match delivery; for example, the company is not able to provide what was advertised or communicated to customers (Rao, 2007:168). According to Rao, service companies
36
make promises through the external marketing process to current as well as potential customers. The promises made through communication media potentially raise customer expectations. These expectations serve as standards against which the customer evaluated the experienced quality of service. The discrepancy between actual service and the promised one may occur due to the following reasons:-
When a company fails to integrate marketing communication with service operations;
Over-promising in external communication campaigns; Failure to manage customer expectations, and
Failure to perform according to specifications.
Parasuraman et al. (1988:57) suggest that the problems leading to this gap can be counteracted by opening channels of communication between human resources, marketing and operations. In addition, companies must develop appropriate and effective communications with their customers.
3.4.2.5 GAP Five Expected Service - Perceived Service Gap (or the Service Performance Gap)
This is the gap between perceived service and expected service, thus the gap between the level of service consumers expect and actual service performance. According to Rao (2007:170), the reasons for this gap are difficult to analyse but organisations can reasonably expect some negative effects when such a gap arises. This gap may result in the following:-
Negatively confirmed quality; Bad reputation;
Lost customers;