by
Piet Jones
Thesis presented in partial fullment of the requirements for
the degree of Master of Science in the Science at Stellenbosch
University
Department of Mathematics, University of Stellenbosch,
Private Bag X1, Matieland 7602, South Africa.
Supervisors:
Dr. D. Jacobson Dr. P. Grobler
Declaration
By submitting this thesis electronically, I declare that the entirety of the work contained therein is my own, original work, that I am the sole author thereof (save to the extent explicitly otherwise stated), that reproduction and pub-lication thereof by Stellenbosch University will not infringe any third party rights and that I have not previously in its entirety or in part submitted it for obtaining any qualication.
Date: . . . .
Copyright © 2014 Stellenbosch University All rights reserved.
Abstract
Structure Learning of Gene Interaction Networks
P. Jones
Department of Mathematics, University of Stellenbosch,
Private Bag X1, Matieland 7602, South Africa.
Thesis: MSc (Mathematics) January 2014
There is an ever increasing wealth of information that is being generated re-garding biological systems, in particular information on the interactions and dependencies of genes and their regulatory process. It is thus important to be able to attach functional understanding to this wealth of information. Math-ematics can potentially provide the tools needed to generate the necessary abstractions to model the complex system of gene interaction.
Here the problem of uncovering gene interactions is cast in several contexts, namely uncovering gene interaction patterns using statistical dependence, co-occurrence as well as feature enrichment. Several techniques have been pro-posed in the past to solve these, with various levels of success. Techniques have ranged from supervised learning, clustering analysis, boolean networks to dynamical Bayesian models and complex system of dierential equations. These models attempt to navigate a high dimensional space with challenging degrees of freedom.
In this work a number of approaches are applied to hypothesize a gene interaction network structure. Three dierent models are applied to real bi-ological data to generate hypotheses on putative bibi-ological interactions. A cluster-based analysis combined with a feature enrichment detection is ini-tially applied to a Vitis vinifera dataset, in a targetted analysis. This model bridges a disjointed set of putatively co-expressed genes based on signicantly associated features, or experimental conditions. We then apply a cross-cluster Markov Blanket based model, on a Saccharomyces cerevisiae dataset. Here the disjointed clusters are bridged by estimating statistical dependence rela-tionship across clusters, in an un-targetted approach. The nal model applied to the same Saccharomyces cerevisiae dataset is a non-parametric Bayesian
method that detects probeset co-occurrence given a local background and in-ferring gene interaction based on the topological network structure resulting from gene co-occurance. In each case we gather evidence to support the biolog-ical relevance of these hypothesized interactions by investigating their relation to currently established biological knowledge.
The various methods applied here appear to capture dierent aspects of gene interaction, in the datasets we applied them to. The targetted approach appears to putatively infer gene interactions based on functional similari-ties. The cross-cluster-analysis-based methods, appear to capture interactions within pathways. The probabilistic-co-occurrence-based method appears to generate modules of functionally related genes that are connected to poten-tially explain the underlying experimental dynamics.
Uittreksel
Struktuur Leer van Interaksie Netwerke van Gene
(Structure Learning of Gene Interaction Networks)
P. Jones
Departement Wiskunde, Universiteit van Stellenbosch,
Privaatsak X1, Matieland 7602, Suid Afrika.
Tesis: MSc (Wiskunde) Januarie 2014
Daar is 'n toenemende rykdom van inligting wat gegenereer word met betrek-king tot biologiese stelsels, veral inligting oor die interaksies en afhanklikheids-verhoudinge van gene asook hul regulatoriese prosesse. Dit is dus belangrik om in staat te wees om funksionele begrip te kan heg aan hierdie rykdom van inlig-ting. Wiskunde kan moontlik die gereedskap verskaf en die nodige abstraksies bied om die komplekse sisteem van gene interaksies te modelleer.
Hier is die probleem met die beraming van die interaksies tussen gene benader uit verskeie kontekste uit, soos die ontdekking van patrone in gene interaksie met behulp van statistiese afhanklikheid , mede-voorkoms asook funksie verryking. Verskeie tegnieke is in die verlede voorgestel om hierdie probleem te benader, met verskillende vlakke van sukses. Tegnieke het gewissel van toesig leer , die groepering analise, boolean netwerke, dinamiese Bayesian modelle en 'n komplekse stelsel van dierensiaalvergelykings. Hierdie modelle poog om 'n hoë dimensionele ruimte te navigeer met uitdagende grade van vryheid.
In hierdie werk word 'n aantal benaderings toegepas om 'n genetiese inter-aksie netwerk struktuur voor te stel. Drie verskillende modelle word toegepas op werklike biologiese data met die doel om hipoteses oor vermeende biologiese interaksies te genereer. 'n Geteikende groeperings gebaseerde analise gekom-bineer met die opsporing van verrykte kenmerke is aanvanklik toegepas op 'n Vitis vinifera datastel. Hierdie model verbind disjunkte groepe van vermeende mede-uitgedrukte gene wat gebaseer is op beduidende verrykte kenmerke, hier eksperimentele toestande . Ons pas dan 'n tussen groepering Markov Kombers model toe, op 'n Saccharomyces cerevisiae datastel. Hier is die disjunkte groe-perings ge-oorbrug deur die beraming van statistiese afhanklikheid verhoudings
tussen die elemente in die afsondelike groeperings. Die nale model was ons toepas op dieselfde Saccharomyces cerevisiae datastel is 'n nie- parametriese Bayes metode wat probe stelle van mede-voorkommende gene ontdek, gegee 'n plaaslike agtergrond. Die gene interaksie is beraam op grond van die topologie van die netwerk struktuur veroorsaak deur die gesamentlike voorkoms gene. In elk van die voorgenome gevalle word ons hipotese vermoedelik ondersteun deur die beraamde gene interaksies in terme van huidige biologiese kennis na te vors.
Die verskillende metodes wat hier toegepas is, modelleer verskillende as-pekte van die interaksies tussen gene met betrekking tot die datastelle wat ons ondersoek het. In die geteikende benadering blyk dit asof ons vermeemde interaksies beraam gebaseer op die ooreenkoms van biologiese funksies. Waar die aeide gene interaksies moontlik gebaseer kan wees op funksionele oor-eenkomste tussen die verskeie gene. In die analise gebaseer op die tussen modelering van gene groepe, blyk dit asof die verhouding van gene in bekende biologiese substelsels gemodelleer word. Dit blyk of die model gebaseer op die gesamentlike voorkoms van gene die verband tussen groepe van funksionele verbonde gene modelleer om die onderliggende dinamiese eienskappe van die experiment te verduidelik.
Acknowledgements
I would like to acknowledge the support of my supervisor, Dan Jacobson, I am thankful that he still tolerates my idiosyncrasies and I have enjoyed our conversations immensely. I would then like to thank my co-supervisor Paul Grobler for his unending patience with me and the meaningful insights that he has given me. Then I would like to acknowledge the advice of one of my statistics lecturers, Sarel Steel, he has provided me with meaningful discussions and provides a rearming mirror for my ideas. Futhermore I would like to thank Kari du Plessis for her biological interpretation and eort applied to a portion of this work and the Computational Biology Group for listening to me rambling on about Bayes.
I would like to acknowledge the NRF for partial funding of this project.
Dedications
I would like to express my sincere gratitude to my family, my mother, father, sister, brother and friends, for without their support I would not be where I am today. I would also like to thank God for the insights and talents he has given me along with the inspiration to strive for new heights and the patience
and tolerance to deal with the bumps in the road.
Contents
Declaration i Abstract ii Opsomming iv Acknowledgements vi Dedications vii Contents viii List of Figures x List of Tables xi 1 Introduction 1 1.1 List of References . . . 3 2 Literature Review 5 2.1 List of References . . . 233 Targetted Co-Expression Analysis 35 3.1 Introduction . . . 35
3.2 Results and Discussion . . . 36
3.3 Methods and Materials . . . 43
3.4 Conclusion and Future Work . . . 47
3.5 List of References . . . 49
4 Cross Cluster Gene Interaction Detection 53 4.1 Introduction . . . 53
4.2 Results and Discussions . . . 54
4.3 Materials and Methods . . . 57
4.4 Conclusion and Future Work . . . 64
4.5 List of References . . . 65 viii
5 Local Non-Parametric Bayesian Clustering Driven
Commu-nity Detection 70
5.1 Introduction . . . 70
5.2 Results and Discussion . . . 71
5.3 Materials and Methods . . . 79
5.4 Conclusion and Future Work . . . 91
5.5 List of References . . . 92
List of Figures
2.1 Central Dogma . . . 6
2.2 Adjacency Matrix Example . . . 9
2.3 Dynamic Bayesian Network Example . . . 14
3.1 Tissue and Cultivar Specic Dominant Conditions . . . 39
3.2 Berry Developmental Stages Dominant Conditions . . . 41
3.3 Abiotic Stress Dominant Conditions . . . 42
3.4 Biotic Stress Dominant Conditions . . . 43
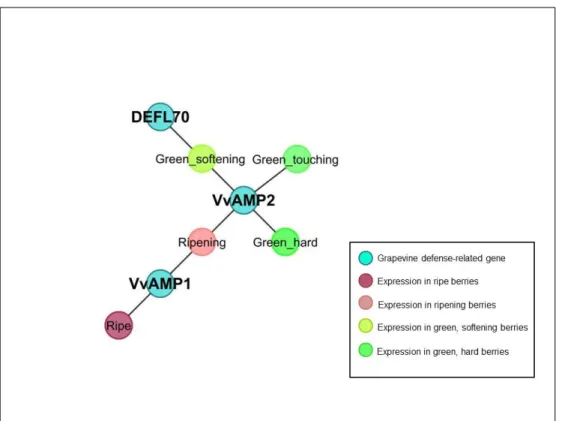
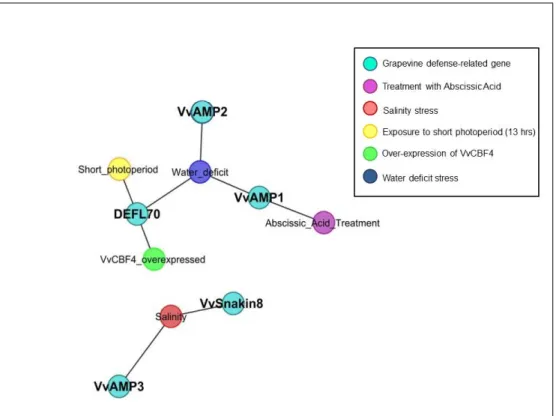
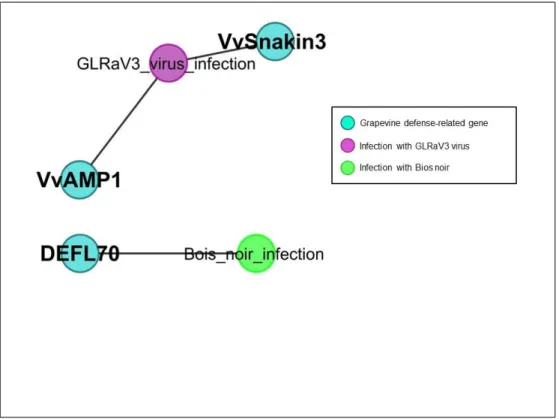
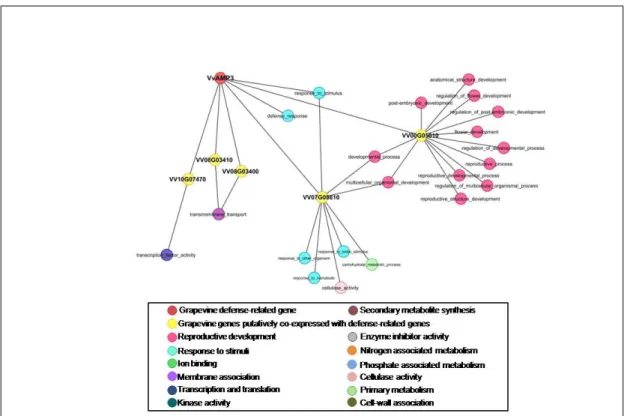
3.5 First Subnetwork of GO-term annotated Vv-AMP3. . . 44
3.6 Second Subnetwork of GO-term annotated Vv-AMP3. . . 45
3.7 Third and Final Subnetwork of GO-term annotated Vv-AMP3. . . . 46
4.1 Cross Cluster Gene Interaction Network . . . 55
4.2 Annotated Cross Cluster Gene Interaction Network . . . 56
4.3 Cliques Graph . . . 58
4.4 Probeset Ambiguity . . . 59
4.5 KEGG Metabolic Pathway Network . . . 63
5.1 Methodology . . . 72
5.2 Geweke Plots of Z-scores . . . 74
5.3 Trace Plot and Autocorrelation of MCMC: 10000 samples . . . 75
5.4 Run time of Algorithm . . . 76
5.5 Inferred Tree Structure: Probesets . . . 76
5.6 Inferred Tree Structure:Genes . . . 77
5.7 Stick Breaking Representation: Dirichlet Process . . . 81
5.8 Graphical Plate Model: Dirichlet Process Mixture Model . . . 83
5.9 Stick Breaking Representation: Indian Buet Process . . . 85
5.10 Graphical Plate Model: Indian Buet Process . . . 86
5.11 Graphical Plate Model: Combined Model . . . 87
List of Tables
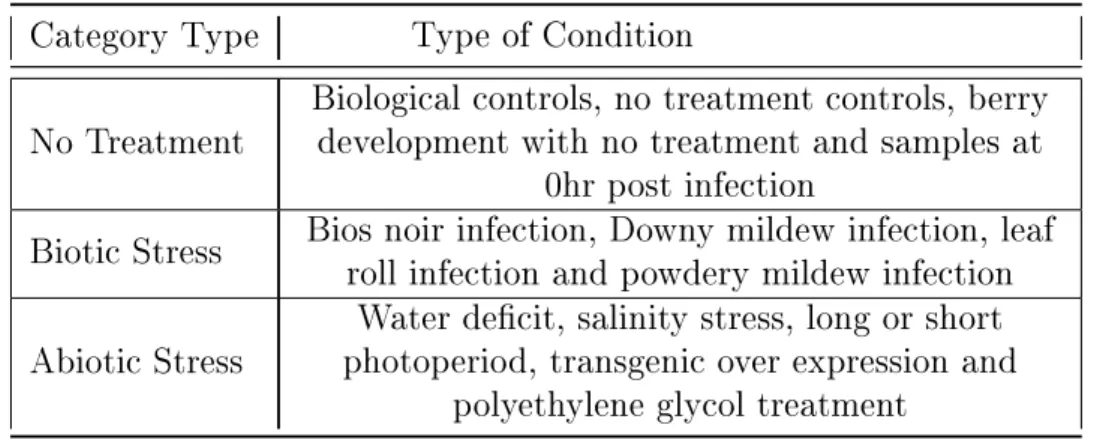
3.1 Summary of sub-categories, based on treatment, used to classify experimental conditions . . . 37 3.2 Experimental Categorization, with description used to classify by
treatment and tissue used to classify by source. . . 38 4.1 An example of a contingency table. Elements in the table are the
number of variables that have occurred in both the corresponding row and column labels. . . 63 5.1 Genes found in Communities . . . 78
Chapter 1
Introduction
There has been a general increase in the amount of data that is generated in the eld of genomics [6]. One of the drivers of this increase is the application of high-throughput technology, specically in the eld of sequencing [11]. This wealth of information has lead to an increased need for development in the eld of functional genomics [1, 9, 8]. This may lead to an improvement of our functional understanding of the fundamental processes that occur within a cell by delineating the interactions of its fundamental components: genes. Therefore, this work will attempt to model the interaction from an exploratory approach in order to develop hypotheses about gene interactions that can then be further investigated. These hypotheses may potentially broaden our ability to manipulate and control organisms at a cellular level.
At the very basis of functional genomics is understanding the interaction between genes and gene products [5]. There are several possible ways to dene what is meant by this interaction, and several ways to gain a conceptual under-standing of such an interaction. Methods and approaches have been adapted from various elds in an attempt to approach the problem from dierent per-spectives.
For the purposes of this thesis a more general denition of the concept of interaction is used. The interaction between genes is dened in terms of their relationship; this relationship can either be between their respective products, between their respective regulatory components or the genes themselves can have a regulatory relationship with each other. Given this context, we abstract the problem by visualizing it in terms of a network, or graph. Utilizing this context there are several possible ways to model the interaction between genes. These methods can involve the application of a dynamical approach that attempts to model the problem based on assuming some nature for the in-teraction of these genes. This may be in the form of a system of dierential equations, a set of binary interacting components or a network of interacting random variables [12, 13, 10]. Alternatively patterns prevalent in observed data can be uncovered, where the nature of these patterns may potentially indicate interactions. Patterns can be uncovered by modelling clusters of
ables based on some measure of association. This association may take the form of similar observed responses, functional characteristics or variable simi-larity [3, 2].
In this thesis we aim to apply dierent approaches in an attempt to uncover the patterns in expression data, each based on certain assumptions. With the expression data putatively capturing the observed activity of genes under a set of perturbations. And the patterns uncovered from this data may allow for hypotheses on potential associations between genes.
Our rst approach, a targetted analysis, aims to explore the relationship between a set of known variables. The association between a set of grapevine genes in the context of putative co-expression is investigated by taking into account dominant perturbations that may potentially drive the putative co-expression. The assumption underlying this approach is that co-expressed genes are assumed to have some common putative function.
We then aim to hypothesize relationships between putative metabolically related genes in an untargetted co-expression based approach. Here the as-sumption is made that sets of putatively co-expressed genes are inuenced by other sets of putatively co-expressed genes across time. The relationships between genes are explored based on the statistical dependence between the observed expression of these putative sets in the context of yeast.
Alternatively, we also model the interaction between genes based on the assumption that subsets of co-occurring clustered genes act together, thus producing the observed expression values. We aim to hypothesize alternative relationships between these putative metabolically related genes. This is done using a combined statistical model to generate a network topology that is then summarized and investigated.
These methods are applied in the context of exploratory analysis and hy-pothesis generation with putative evidence provided in support. This evidence is gathered from current known biological information. Each of the methods highlighted above represents a novel approach in the attempt to capture pu-tative gene interactions from patterns in gene expression data.
The thesis will rst discuss the current literature, providing necessary in-formation on the biological context and mathematical theory underlying the above methods, followed by a discussion on each respective exploratory method in the chapters that follow.
1.1 List of References
[1] Braga-Neto, U.M. and Marques Jr, E.T. (2006). From functional genomics to functional immunomics: new challenges, old problems, big rewards. PLoS computational biology, vol. 2, no. 7, p. e81.
[2] Collins, S.R., Miller, K.M., Maas, N.L., Roguev, A., Fillingham, J., Chu, C.S., Schuldiner, M., Gebbia, M., Recht, J., Shales, M., Ding, H., Xu, H., Han, J., Ingvarsdottir, K., Cheng, B., Andrews, B., Boone, C., Berger, S., Hieter, P., Zhang, Z., Brown, G., Ingles, J., Emili, A., Allis, C.D., Toczyksi, D.P., Weiss-man, J.S., Greenblatt, J. and Krogan, N. (2007). Functional dissection of pro-tein complexes involved in yeast chromosome biology using a genetic interaction map. Nature, vol. 446, no. 7137, pp. 806810.
[3] D'haeseleer, P., Liang, S. and Somogyi, R. (2000). Genetic network inference: from co-expression clustering to reverse engineering. Bioinformatics, vol. 16, no. 8, pp. 707726.
[4] Hall, R.D., Brouwer, I.D. and Fitzgerald, M.A. (2008). Plant metabolomics and its potential application for human nutrition. Physiologia plantarum, vol. 132, no. 2, pp. 162175.
[5] Hieter, P. and Boguski, M. (1997). Functional genomics: it's all how you read it. Science, vol. 278, no. 5338, pp. 601602.
[6] Howe, D., Costanzo, M., Fey, P., Gojobori, T., Hannick, L., Hide, W., Hill, D.P., Kania, R., Schaeer, M., St Pierre, S., Twigger, S., White, O. and Yon Rhee, S. (2008). Big data: The future of biocuration. Nature, vol. 455, no. 7209, pp. 4750.
[7] Lu, P.Y., Xie, F. and Woodle, M.C. (2005). In Vivo application of rna interfer-ence: From functional genomics to therapeutics. Advances in genetics, vol. 54, pp. 115142.
[8] Mardis, E.R. (2008). The impact of next-generation sequencing technology on genetics. Trends in genetics, vol. 24, no. 3, pp. 133141.
[9] Morozova, O. and Marra, M.A. (2008). Applications of next-generation se-quencing technologies in functional genomics. Genomics, vol. 92, no. 5, pp. 255264.
[10] Perrin, B.-E., Ralaivola, L., Mazurie, A., Bottani, S., Mallet, J. and d'AlcheBuc, F. (2003). Gene networks inference using dynamic bayesian networks. Bioin-formatics, vol. 19, no. suppl 2, pp. ii138ii148.
[11] Reis-Filho, J.S. (2009). Next-generation sequencing. Breast Cancer Res, vol. 11, no. Suppl 3, p. 12.
[12] Shmulevich, I., Dougherty, E.R., Kim, S. and Zhang, W. (2002). Probabilistic boolean networks: a rule-based uncertainty model for gene regulatory networks. Bioinformatics, vol. 18, no. 2, pp. 261274.
[13] Tegner, J., Yeung, M.S., Hasty, J. and Collins, J.J. (2003). Reverse engineer-ing gene networks: integratengineer-ing genetic perturbations with dynamical modelengineer-ing. Proceedings of the National Academy of Sciences, vol. 100, no. 10, pp. 5944 5949.
Chapter 2
Literature Review
To meaningfully discuss gene interaction networks and how to derive them, some preliminary information is needed, both in terms of biological back-ground, mathematical theory and a general understanding of the current and prior developments in this eld. The basic biology regarding gene interaction is discussed rst and then an outline of microarray experiments is described. These experiments serve as the primary sources of data in the hypothesis generation approaches. A discussion of some of the important mathematical concepts used in this thesis as well as their related application in the literature completes this chapter.
Biological Context
With the increase in the availability of biological data, the potential mean-ingful available information of these systems also increases [58]. Currently, at the time of writing, the Kyoto Encyclopedia of Genes and Genomes (KEGG) database consisted of 2,367 completed genomes and 9,592,536 genes [65]. The Gene Ontology contains 36,445 non-obsolete terms, used to annotate genes with their putative function and characterize them. The KEGG database has been in development since 1995, and is currently managed by Kanehisa Lab-oratories. It consists of the functional integrated information from genomic, systematic and chemical resources [65]. The Gene Ontology project consists of the description of gene products and it aims to provide a consistent de-scription of biological processes and molecular functions [10]. These represent a signicant proportion of the currently available knowledge regarding gene interaction. The network-based study of these biological systems have con-tributed signicantly to this knowledge base [108, 26, 140].
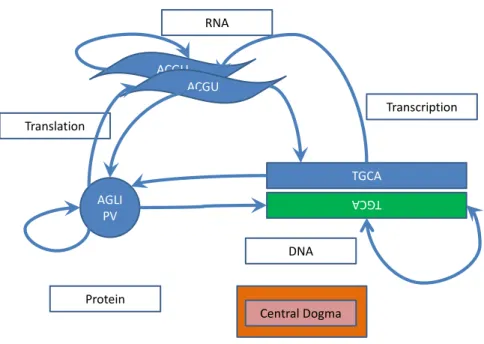
The central dogma outlined in Figure 2.1 provides a summary of our global understanding of the fundamental interaction driving cellular function and de-velopment. Deoxyribonucleic acid (DNA) is a fundamental component of a cell. It consists of two polymer strings with repeating molecules called nu-cleotides, supported on a sugar phosphate backbone [137]. These nucleotides
ACGU AGLI PV ACGU TGCA TG CA DNA Transcription RNA Translation Protein Central Dogma
Figure 2.1: Central Dogma
The Central Dogma of molecular biology which illustrates the ow of information.
are often abstracted as four letters: A (Adenine), C (Cytosine), G (Guanine) and T (Thymine). Together these form the building blocks for more complex structures in an organism. DNA is structured into chromosomes that both vary in number and size between species; as an example humans have 23 chro-mosomes that range in lengths from 51 million base pairs to 245 million base pairs. While on the other hand Saccharomyces cerevisiae, has only 16 chro-mosomes that vary in length between 230 000 and 1,530,000 base pairs. These chromosomes contain functional parts called genes, which encode the neces-sary information for cellular function. Genes are transcribed into ribonucleic acid (RNA), by the process of transcription, which is regulated by a protein called a transcription factor. These transcription factors are believed to bind to an upstream region of the gene, known as the promoter region.
Once a transcription factor binds to its binding region, RNA polymerase is then recruited. The DNA structure is then transcribed using the concept of complementary base pairing. This process is made more complex by many transcription factors potentially binding to the same or similar regions, and together they may activate or repress the transcription of a gene. The level of RNA produced by a specic gene is referred to as gene expression.
Here regulation refers to the interacting components that leads to the ac-tivation, repression or combination of both, of an individual or set of genes. A set of genes are said to have interacted if the products of these genes
inter-act, a subset of these genes are involved in the regulation of another subset of these genes or the set of genes regulate a set of genes outside this set. The information in messenger RNA (mRNA) that determines the protein sequence that will result from translation is encoded in sets of three contiguous nu-cleotides known as codons. These codons are then categorized into groups of amino acids which are the building block of proteins. Proteins as indicated in the depiction of central dogma, can, in turn, inuence DNA, potentially inuencing the transcriptional regulation of another protein or even proteins similar to itself, potentially repressing or activating transcription and eventu-ally translation. The afore mentioned process eectively describes the central dogma and the situation becomes more involved as there are several additional factors that could inuence this process. Essentially, gene regulation, which collectively refers to the various systems that impact gene expression, is a complex combinatorial dynamical system, which involves several interacting components [139, 107, 77, 121, 130].
Microarrays
One of the primary types of data that serves as a source for gene regulation studies in observing the expression of genes under various perturbations is mi-croarray data. Mimi-croarray data measures the expression of thousands of genes at a time given a particular perturbation, or a collection of perturbations. The process involves the extraction of mRNA from a particular target cell. The messenger RNA, mRNA, is then reverse transcribed into complementary RNA, cRNA. To be able to monitor the expression levels of these cRNA's, they are labelled with uorescent molecules. The cRNA is fragmented and then hy-bridized to a gene chip[110, 138]. With hybridization there is variable strength or regularity in the binding of nucleotide sequences to their complements. De-pending on, amongst other things, the composition of the nucleotide sequence and the condition of the medium they reside in, some nucleotide sequences may bind more readily to others.[95].
This is an important bias that could inate intensity values. Often the chip is also designed so that there are multiple probe sequences that match to a particular gene, thus probes are often referred to in terms of probesets. Gene chips consist of thousands of neatly organized spots and each spot has several probe sequences attached, where probes can be DNA or cDNA sequences. The chips are washed and then analysed using spectroscopy techniques to quantify the uorescent signal produced at each spot. The quantitative results from each chip are then processed, resulting in a matrix of values. This matrix, called a gene expression matrix, has rows that indicate probe sequences and columns that indicate the chip and thus the perturbation applied. Often these rows represent probesets, rather than individual probes. This matrix is also the result of an extensive analysis process that attempts to reduce the technical and experimental noise of the entire process.
There are a number of concerns regarding gene expression data. Apart from the technical and experimental noise that may still remain and be propagated throughout the experimentation process, there is a distinct lack of degrees of freedom to consider. This occurs as there is generally a large number of variables measured with a very small number of samples. The experiments are also generally repeated only a few times and in some cases not repeated at all [124]. The main driver of this data problem is that microarray experiments are costly and they are also prone to experimental complications, the result of a noisy process, though there does exist evidence to contradict this popular belief [71]. Regardless, microarrays remain a popular source of information and several techniques and methods have been proposed in order to improve the information content of these data sources [117, 66].
There is a considerable amount of pre-processing that is done to obtain an expression matrix from a microarray experiment. The pre-processing could potentially reduce the inuence that noise, both technical and biological, has on the data. Adjusting for systematic noise and bias may also allow for a more meaningful comparison of two dierent arrays. This process is referred to as normalization [111, 31]. One of the most popular methods for normalization of an Aymetrix GeneChip is Robust Multiarray Averaging (RMA) [61]. This process involves correcting for background noise, transforming the data by taking thelog2of the intensity values and then applying quantile normalization
[8].
It is important to note that this work is concerned with hypothesising gene interactions which is then depicted in a network structure. This means that the nodes of the network are genes, or as their respective proxies, probes or probesets. The concepts of nodes and networks will be explained further below. Graph Theory
Identifying how the various components of these networks interact may im-prove our understanding of an organisms development or how these organism's response to various stresses and perturbations. Networks, or graphs, provide an intuitive way in which these interactions can be described, visualized and better understood. Not only has graph theory been used as a visualization tool for these complex networks, but also as a means to uncover properties that may have biological signicance [51, 2].
The fundamental component in this work is a network, or graph, a concept formally explored by Euler in [34]. Here a graph,G is given by the sets{V, E}, withV a nite set referred to as the vertex set, also called a set of nodes, while Eis called an edge set such that(i, j)∈E, i∈V, j ∈V. Thus an edge, which is an element of the edge set, describes a connection between nodes. If the order of the connection is important, then the edge is called a directed edge, with the corresponding graph being referred to as a directed graph, alternatively both are referred to as undirected. In the case of an undirected graph, the elements
that constitute the edge are nodes, which are referred to as incident nodes to the edge. The number of edges that are incident to a node in an undirected graph is called the degree of the node. In a directed graph we have in-degree, the number of edges leading to the node, and out-degree, the number of edges leading from the node. The nodes that are connected by an edge are called adjacent to each other [14].
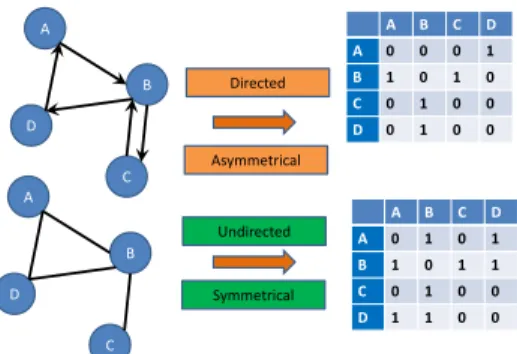
Together the all-against-all representation of adjacency can take the form of an adjacency matrix. Elements of this matrix can consist of binary values, where 1 indicates a relationship and 0 indicates the absence of one,
alterna-tively any other value that indicates a weighted connection between nodes can be used to indicate the relationship between nodes. Here it is important to clarify that an adjacency matrix is a square matrix with dimension described by the vertex set, with an element in the matrix indicating a connection be-tween the nodes corresponding to the respective row and column. This matrix is symmetrical when the graph is undirected and potentially asymmetric in the context of directed graphs. For clarity an example of an adjacency ma-trix for both the directed and undirected case is presented in Figure 2.2, the convention adopted here is that the source or parents of directed edges are indicated by the columns and the children or sink of a directed edge is given by the rows. Thus an edge from AtoB is indicted by a1in the B, A entry of the adjacency matrix, assuming the weight of the connection is irrelevant or absent [14, 136]. A D B C A D B C A B C D A 0 1 0 1 B 1 0 1 1 C 0 1 0 0 D 1 1 0 0 A B C D A 0 0 0 1 B 1 0 1 0 C 0 1 0 0 D 0 1 0 0 Undirected Directed Asymmetrical Symmetrical
Figure 2.2: Adjacency Matrix Example
The gure illustrates an example of a directed graph (top), an undirected graph (bottom) and their corresponding adjacency matrices. As an example of adjacency in the undirected case, in the bottom gure
nodes A and B are connected by an edge and are therefore adjacent, which corresponds to a1in the B,A
entry as well as a1in the A,B entry of the corresponding adjacency matrix. In the directed case there is
only a1in the B,A entry, indicating the edge goes from A to B.
In this thesis, gene interaction is at times investigated by considering the local structure of the network. This local structure is mathematically referred to as a subnetwork. With subnetworks dened in terms of networks as
Denition 2.1. (Subnetwork or Subgraph). A subnetwork, G ={V , E }is dened in terms of a graph G ={V, E}, with V∗ ⊆ V and E∗ ⊆E, such that E∗ ={(vi, vj)|∀(vi, vj)∈E, vi, vj ∈V∗}.
Thus putative gene interaction inference in terms of subgraphs is eectively a local structure learning problem. This problem can be approached in terms of inferring the relation between vertices in dierent clusters and/or vertices in the same cluster. The local inference of gene interaction can then be extracted for several subset of genes and combined to provide a putative approximation of the global gene interaction network.
Spanning trees are a particular type of subgraph. As a tree it contains no cycles and the spanning property ensures it contains all nodes of the original graph. Uncovering this particular subgraph from a graph structure is viewed as one of the rst problems in graph theory, originally investigated by Euler in [34]. This is also considered to be the rst formal published application of graph theory. If the edges in a graph have weights associated with them, then the problem of uncovering the spanning tree can be investigated in terms of nding a spanning tree of minimum weight. The history of approaches used to solve this problem is discussed in [53]. One of the rst known algorithms for determining a minimum spanning tree is the one proposed by Boruvka in [15]. This algorithm is based on searching from one vertex to another and iteratively adding the edge of lowest weight until a tree is constructed. A criticism of the algorithm is that it does not take into account the historical edges added. Current algorithms used are Prim's algorithm, originally introduced in [62] and Kruskal's given in [73]
Various aspects of the network topology can be used to generate hypotheses on the biological nature of gene interactions. For a review on some of the biologically relevant aspects of network structure see [12]. Among the various topological characteristics of a network the concept of cliques and communities have found considerable interest in the study of genes [18].
A clique,C, is dened with regards to a graph G, as a complete subgraph. A graph is called complete if it contains all possible edges for its node set. A clique is said to be maximal if there does not exist another clique, H, such that C is contained within H. The problem of identifying the set of maximal cliques for a graph is closely related to the concept of nding the maximum clique in a graph. This problem is known to be NP-complete, thus no e-cient time algorithm currently exists to solve it exactly, therefore approximate algorithms are generally applied [43]. In the application of clique detection the objective is often to identify dense structures or triangle type structures in a network. Depending on the node description these structures could have biological meaning. This concept has been applied to gene expression analy-sis, motif discovery, protein structure comparison and genetic variation disease studies related to single nucleotide polymorphisms [76, 11, 32, 75].
of communities. A community is dened as a set of nodes for which edges within the community are more dense than edges between communities. De-pending on the explicit denition used for a community, the problem is also NP-complete. Communities capture the intuition of highly interactive mod-ules. Several algorithms have been proposed and applied in a variety of elds, for a comprehensive review of these algorithms see [38]. In the eld of gene expression analysis, [126] argued for the application of networks in identifying gene co-expression modules to hypothesize functional relationships between sets of co-expressed genes by observing the resulting network topology. Re-cently, [129] applied community detection to a network of Escherichia coli putatively co-expressed genes. The application identied a robust, hierarchi-cal, functionally related community structure, where communities were each signicantly enriched in terms of Gene Ontology.
Functional Genomics
With the advent of high-throughput methods in the eld of genomics, there has been a wealth of information generated. The area of functional genomics is concerned with the dynamical interaction between genes and gene products that can be derived from this information [106, 49]. One of the approaches used to functionally link genes is to compare their respective gene sequences. This is often done in phylogenetics, where the sequences are compared and aligned to hypothesize an evolutionary history of association [52]. The assumption is that genes that have similar phylogenetic proles may be functionally related in some way [42, 104, 60].
Eciently comparing large sequences is therefore an important aspect of functional genomics. Several methods to approximately match strings have been proposed, and a review of several algorithms is given in [64]. A popular method to compare sequences of nucleotides or amino acids is the Basic Lo-cal Alignment Search Tool (BLAST) [6]. This heuristic algorithm attempts to approximate a globally optimal alignment by maximizing a measure of lo-cal similarity. Alternative implementations of BLAST have been proposed to adapt the algorithm to more specic topical areas. ScalaBLAST optimizes BLAST comparison for larger datasets [100]. There are also BLAST imple-mentations that are specically used to compare specic sequence types such as nucleotide sequences with BLASTn, a translated nucleotide sequence to a set of protein sequences using BLASTx, a decoded protein sequence to a set of nucleotide sequences using tBLASTn and comparing protein sequences using BLASTp [7, 145, 19].
Dynamical Models
There have been several techniques developed over the years to both study and generate these networks. These techniques are quite varied and each
have their respective strengths and weaknesses. A comprehensive review of all the available techniques in the literature falls beyond the scope of this thesis, thus the set of models and techniques chosen provide an outline of the state of scientic knowledge with regards to the dynamical modelling of gene interaction networks.
Gene regulation can be viewed in a very simplied fashion as an interac-tion of 'on' or 'o' switches. One of the earlier models implemented by [51] utilized a type of boolean network to analyse the structure and behaviour of biochemical control networks. Boolean networks were also proposed by [74] and [3] in the study of gene regulation. This was extended by [119], [120] and [67] by adding a stochastic framework resulting in Probabilistic Boolean Net-works, which incorporate certain elements of uncertainty. Boolean networks attempt to model the dynamics of gene interaction using rules in the form of boolean functions. In the model proposed by [67], nodes in the graph consist of genes, inputs and outputs, here each node takes on a binary value, edges indicate connection between the various processes and the states of the system evolve using Boolean Functions. These functions often take the form of logical operators such as AND, OR and XOR. The general limitation of these models is that they view expression of genes as binary, either 'on' or 'o' when it is known that gene regulation is more continuous. One of the benets of these approaches is that they can uncover dynamical behaviour of gene regulatory networks, such as the study done by [78], where a yeast network was found to be resistant to small perturbations and the conclusion drawn that certain gene regulatory networks are robust.
The stochastic binary model of boolean networks can be extended to a more general continuous framework. The paper by [119] indicated the connec-tion between the Probabilistic Boolean Networks and the Bayesian Network. The latter is another popular method for analysing gene regulatory networks. Bayesian Network models, in the study of gene regulation, have been proposed by, amongst others, [144], [40], [41] and [59]. These models are probabilistic in nature and benet from their natural ability to incorporate prior information into the model. This allows the model to cope well with some of the inher-ent restrictions of microarray data. A Bayesian Network model attempts to model the interaction between nodes in a network as a product of conditional probability distributions. The set of variables are modelled in terms of a joint probability distribution that is factorized using conditional probabilities. The nature of this factorization is based on the dependence relationship between these variables. Bayesian Networks assume that these dependence relation-ships are given by the network structure itself. Therefore nodes are viewed as random variables that collectively form a joint probability distribution. The edge structure describes conditional dependence, thus the joint distribution can be factored into a product of conditional probability distributions. The application of Bayesian Networks is two-fold. Firstly, the structure itself can be viewed in a Bayesian context, where the structure can be estimated from a
posterior probability, viz.
P(G|D)∝P(D|G)P(G),
here G is a random variable over graph structures with prior P(G), D is the observed data with P(D|G) the conditional probability of generating
the data given the graph structure. The normalization constant is left out of the equation, as generally Markov Chain Monte Carlo simulations are used to sample graph structures from the posterior P(G|D). Secondly, learning
the actual conditional probabilities that govern the interactions can also be accomplished using a Bayesian framework.
A review of the reconstruction accuracy of a few of these Bayesian Network models is provided in [135], where the performance is evaluated on both syn-thetic and real data. In these networks, nodes are generally considered to be genes or gene products and the directed edges indicate putative connections between these components. A major drawback of Bayesian Networks with re-gards to gene regulation is that the network is required to be acyclic. This limits the ability of the model to capture feedback loops and auto-regulation. Bayesian Networks also lead to equivalent classes, because there may be several network structures that can explain the same probability distribution. In the comparative work of [135] it was argued that networks that can uncouple these equivalent classes show an improved performance. This uncoupling was done by either including intervention data acquired by data collection, additional information or knowledge of the system itself or by using Dynamic Bayesian Networks.
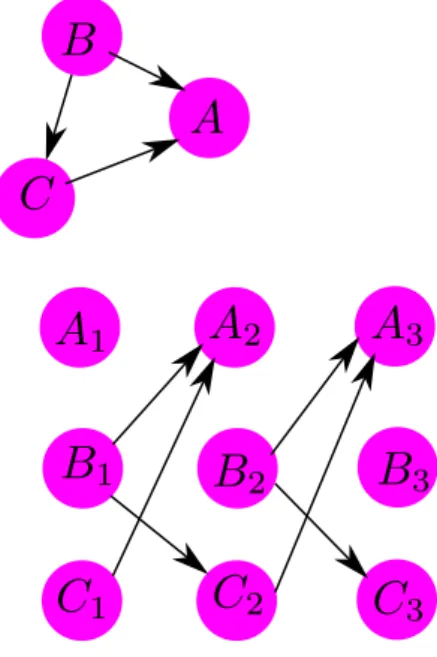
A Dynamic Bayesian Network (DBN) is a directed network that results from unrolling a Bayesian Network with respect to some dimension, often time. A toy example of this is given in Figure 2.3. These models have been applied to several systems, for example time series microarray data, in order to infer the edge structure of regulatory networks in Saccharomyces Cerevisae, [70]. They have also been applied as predictive models on a DNA repair network in Escherichia coli and [105], respectively. A further improved version of a DBN model was proposed by [149]. This model attempts to solve the computational burden of standard DBN models by using an initial variable selection phase. The results indicate an improvement in predictive accuracy of the gene regulatory network, with an improved overall run-time. Standard DBN models have considerably more variables than their Bayesian Network counterparts and the sample space of possible graph structure is thus much larger. This could potentially impact the eectiveness of structural inference, therefore there are often restrictions applied to the search space. The nature of these networks also allows for the modelling of feedback loops, which is an important known process in gene regulation.
The set of variables that have a statistical conditional dependence rela-tionship with a target variable is often referred as the Markov Blanket of the
Figure 2.3: Dynamic Bayesian Network Example
The gure shows a directed network (top) unrolled over some index into a Dynamic Bayesian Network. Given some starting set of parameters, the edge structure of the unrolled network maintains the dependency on the original network. The network can be unrolled for arbitrary many indices. It is assumed here that the interaction dened occurs across indices and not within.
target variable.The term Markov Blanket was originally coined by [103]. In the context of a network these blankets describe the immediate neighbourhood of these target variables. When modelling gene interaction by statistical depen-dence, such as in Bayesian Network and Dynamic Bayesian Network models, we can essentially estimate the Markov Blankets for the respective variables [83]. There have been a number of applications of Markov Blankets and several algorithms developed to estimate them from data. A target variable's Markov Blanket is often described as the minimum set of variables for which infor-mation is needed in order to perform inference on this target variable. This concept has lead to the application of Markov Blankets to feature selection and set generation. In order to improve the robustness, computational eciency and classication accuracy of genetic algorithms applied to gene expression data, [148] proposed the use of a Markov Blanket approach with comparative success. A review of the application of Markov Blankets to feature selection and inference of causal structure is given in [4]. In inferring network structure in the context of gene regulatory networks, [79] proposed the use of Markov Blanket detection combined with a set of ordinary dierential equations, using local dynamics to infer the network structure. It was argued that the success of this method may depend highly on the Markov Blanket detection algorithm used as well as the Euler approximation applied to the dierential equations
[99].
One of the most powerful methodologies that has been used to model the dynamics of these systems, and therefore to infer the nature of gene interac-tion, is a system of ordinary dierential equations. A basic dierential equation model was proposed by [22]. Their model was based on kinetic equations which incorporates degradation rates of mRNA and proteins. They also discussed two methods that could be used to infer the parameters of their model under dif-ferent assumptions, however, their model was not applied to real experimental data. This model was extended by [29] and applied to data from Bacillus sub-tilis, their approach involved using Akaike's Information Criterion to infer the sparsity of the network rather than assuming a particular form of sparsity as done in chen1999modeling. Here sparsity is in reference to the number of genes which putatively inuence the expression of a target gene, this number being relatively small. These models have several dierent forms, each attempting to model dierent aspects of gene interaction based on various assumptions. Two important limitations of these models are: they are often linear and therefore cannot fully capture the non-linear dynamics of the system and further, the models assume a static inuence across the time-course. The latter results in the inability of the model to capture switch-like behaviour, whereby under certain perturbations the system might utilize dierent biological regulatory pathways. Alternative models have also been suggested, such as the system of dierential equations proposed by [115], where parameters are estimated using genetic programming and least mean squares. Other examples of non-linear methods have also been proposed in [131], [133] and [45]. The latter model proposes the use of hill functions that are approximated using discrete step-wise functions and therefore applying a piecestep-wise linear model to investigate the dynamics of the system. Dierential equations are well studied and pro-vide a detailed description of the dynamics underlying a system. The model depends highly on knowledge of the underlying system, which often involves a number of assumptions. These models also require large reliable datasets to estimate the parameters of the model. This has lead to a number of papers and discussion on articial networks for benchmarking and parameter estimation. These articial networks are generated using a system of dierential equations or synthetic biological engineering, [118, 20]. It has also recently been shown that there exists a particular equivalence between the Euler approximation of a particular set of ordinary dierential equations and a Dynamic Bayesian model based on a Gaussian Distribution and regression [99].
Articial networks take the form of a hypothesized synthetic network, from which synthetic data is generated using the proposed system of dierential equations. Thus if a model is applied to the synthetically generated data, the resultant inferred network can then be compared to the original hypothesized network. These types of networks are based on an assumed dynamic that govern the underlying system. Therefore datasets constructed from these net-works, when utilized for exploratory analysis and hypothesis generation, may
be biased towards these assumed dynamics. The hypothesis proposed may sim-ply reect this dynamic instead of the real biological phenomena. Nevertheless these networks have been used extensively in algorithm development, provid-ing a framework to benchmark methods in a machine learnprovid-ing context and assess their respective predictive capacities. These networks are not applied in this thesis as the focus is on exploratory analysis and hypothesis generation. Metrics and Clustering
Apart from the models mentioned above, namely approaches that try to un-cover the network structure by modelling the dynamics of the system, there are also methods that have been used to generate modules of putative interacting genes based on various metric and pattern recognition approaches. In particu-lar, clustering along with a distance metric can give an indication of modules of genes that share some underlying characteristic. Modules of genes can refer to groups of genes that may have some regulatory relationship with respect to each other, may exhibit some common function in a cell or may even refer to genes that are part of the same biological pathway or process. The distance metric used may capture dierent perspectives of the relationship between genes and thus potentially uncover these putative relationships. These have been applied to identify groups of putatively co-expressed genes, under the assumption that these co-expressed genes have similar regulatory mechanisms or function [16, 17, 142]. In analysing gene expression matrices that are the results of microarray experiments, these approaches involve the application of various measures or metrics to vectors of intensity values. These then provide an indication of similarity of dissimilarity, which can then be used to cluster the respective vectors into meaningful sets. Measures that have been applied include Pearson Correlation, Spearman Correlation, Mutual Information and Euclidean Distance, amongst others [134, 96, 35, 146, 84].
For the analysis of gene expression data, Pearson correlation is one of the most widely used methods to model the gene expression patterns that are prevalent in the data. Rather than capturing the distance between gene expres-sion vectors, potentially modelling the bias associated with hybridization ki-netics, the shape of the vectors are compared. The variability of strength with which certain sequences hybridize compared to others may lead to compara-tively higher intensity values for certain probe sequences or sets, which may bias the analysis if the objective is to model expression. It is important to note that correlation does not imply causation. However, it has been extensively used to infer an approximate dependence relationship between variables. This is especially prevalent in studies of genotype-phenotype relationships [116].
Given a particular method to capture the distance or similarity between vectors of gene expression data, clustering can then be performed. Techniques or methods to cluster gene expression data range from fast simple k-means, in which the data is partitioned intok sets, to more involved stochastic methods
such as those using Dirichlet Processes. A brief review of the complexity of gene expression data and clustering algorithms applied to these datasets is given in [63, 68]. A similar discussion in terms of network inference, highlighting the application of clustering and a more advanced dynamic model is given in [33]. Clustering can also result from the application of mixture models, as dis-cussed in [86]. Mixture models are built on the fundamental assumption that the mixture or combination of multiple models, functions or distributions can be used to describe a particular phenomena. These models have been applied to gene expression (microarray data) with putatively meaningful results. In [87], expression data was successfully modelled by a mixture of Student-t Dis-tributions and estimation of the number of components was performed using an Expectation Maximization Algorithm, with the overall objective of estimating clusters in a high-dimensional space.
A stochastic extension of mixture modelling for clustering is a Dirichlet Process Mixture, also explained in Chapter 5 and originally discussed in [9]. These models are an extension of the non-parametric Bayesian Dirichlet Pro-cess model [37]. They benet from modelling an innite number of parameters, therefore not assuming a xed number of mixture components. The exibility of these models allows for the modelling of diverse phenomena. The param-eters of interest and clusters can be sampled from the posterior distribution with the aid of Markov Chain Monte Carlo methods [93]. Models that have been used to analyse gene expression data using Dirichlet Process Mixture have been proposed by [27, 30, 88] amongst others. These models dier in the sampling scheme used and how the results from the sampling scheme are used to indicate clusters.
Markov Chain Monte Carlo
The application of Bayesian models, such as the Bayesian Network and Dirich-let Process type models referred to earlier, often require the evaluation of complex functions. This complexity may simply make these evaluations com-putationally infeasible. This problem can be addressed using Monte Carlo methods or its extension, Markov Chain Monte Carlo. The concept of Monte Carlo methods was formally introduced by [92]. It involves the estimation of a quantity of interest related to the function by observing samples obtained from the particular function. The classical example is the calculation of the expectation of a function, sayg(x), that is related to some discrete probability
distribution, say π(x),
Eπ[g(x)] =
X
x∈ω
g(x)π(x), (2.0.1)
in the discrete case, this involves the sum over the sample space ω. With the probability distribution dened for some random variable X, where x is a observation of the random variable X. If the summation is computationally
infeasible, the Monte Carlo estimation involves obtaining a random sample x1, x2, x3, . . . xn from the probability distribution. Then the empirical mean calculated from the result of evaluating the function at the sample values, can be used as an estimate for the expected value,
¯ g = 1 n n X i=1 g(xi). (2.0.2)
This estimate can be justied by the Weak Law of Large Numbers, whereby the empirical mean of a sample approaches the true underlying mean as the sample size increases [69]. From this it can be shown that for all >0,
lim
n→∞P(|g¯−Eπ[g(x)]| ≥) = 0.
Depending on the functional form ofg(x), other quantities of interest can
be estimated. If, for example, the objective is to estimate probabilities from π(x)then the same procedure can be applied only withg(x) = 1s, which is the indicator function. The indicator function takes on a value of 1 when x = s, and 0 otherwise. The use of Monte Carlo methods are often limited, as the
fundamental assumption is that we can obtain a random sample from a target distribution π(x). Bayesian methods often lead to complex distributions, for
which direct sampling may be computationally intractable.
Markov Chain Monte Carlo methods, originally introduced in [91], can be applied to sample from complicated target distributions and involve sampling from a constructed Markov chain [50]. Let us dene a Markov Chain,
Denition 2.2. (Markov Chain). Given a discrete state space,s, and discrete time space, t. A Markov Chain is given by
{Xt =s;t= 0,1,2,3, . . . , s= 0,1,2,3, . . .}, (2.0.3) such that
P(Xt+1 =st+1|Xt=st, Xt−1 =st=1, . . . , X0 =s0) =P(Xt+1 =st+1|Xt=st) (2.0.4) where Pij =P(Xt+1 =j|Xt =i) denotes the transition probability from state
ito statej, where the transition probabilities given here are assumed to be the same for all time points. The matrix of all transition probabilities is therefore denoted as P.
The Markov Chain is constructed in such a way that the limit distribu-tion of the chain is the target distribudistribu-tion π(x). These chains are completely
dened by their respective transition probabilities, P, thus eectively the pro-cess involves determining appropriate transition probabilities to construct the chain. Transition probabilities dene the probability of transitioning from one
state to another, where a state is an element from the support of the target distribution. If the transition probabilities are invariant with respect to time, then the chain is homogeneous. The assumption here is that we have a discrete state space and discrete time space, this however can be generalized to their respective continuous counterparts where we then refer to transition kernels and Markov Processes. We further restrict our discussion to homogeneous Markov Chains.
There are a few essential properties that are required of the chain in order to ensure that the samples generated from the chain are from the target distri-bution [48]. Firstly, a sucient condition for some limiting distridistri-bution to be our target distribution. This is achieved if the chain satises general balance with respect to our probability vector π(x),
π(x)P =π(x). (2.0.5)
Here π(x) is called the stationary distribution for the transition
probabil-ities and indicates a row vector of probabilprobabil-ities concerned with the random variable X. Secondly, to ensure that the chain converges to a distribution, the chain must be ergodic. For a chain to be ergodic, it needs to be irreducible and aperiodic. For an irreducible chain we require that from any given state there is a positive probability of reaching any other state. An aperiodic chain implies there is no xed interval of time steps, greater than 1, for which the
chain always returns to its current state. With the ergodic property we en-sure that the chain converges to some distribution, the sucient condition for this distribution to be our target distribution is given by general balance. The property of general balance is hard to verify as it may require, in the discrete case, a summation over a complicated state space, where the general balance criteria above, implies
∀x∗ ∈S,X
x∈S
π(x)P(x→x∗) =π(x∗). (2.0.6) To overcome this we can require that our chain satises the more stringent property of detailed balance. This is given by,
∀x, x∗ ∈S;π(x)P(x→x∗) = π(x∗)P(x∗ →x), (2.0.7) where P(x→x∗) refers to the transition probability from state x to state x∗.
A means of constructing a transition probability matrix that satises the above criteria was provided by [55]. This is achieved by dening the o-diagonal transition probabilities by
P(x→x∗) =Q(x→x∗)A(x→x∗), (2.0.8) whereQis any transition probability matrix, also referred to as the proposal distribution and A is dened by,
A(x→x∗) = min{1,π(x
∗)Q(x→x∗)
π(x)Q(x∗ →x)} (2.0.9)
with the restriction that∀x, x∗ ∈S;A(x→x∗) = 0 if Q(x→x∗) = 0,Ais often also referred to as the acceptance probability of the proposed value. The diagonal elements are dened such that the respective row sums ofP are equal to one. Say, π(x), our target distribution, is known only upto some proportion,
π(x) = h(x)
c , (2.0.10)
where we knowh and cis some, often intractable, normalization constant. Then 2.0.9 becomes
A(x→x∗) =min{1,h(x
∗)Q(x→x∗)
h(x)Q(x∗ →x)}, (2.0.11)
where we have that the normalization constants cancel out. This construc-tion of transiconstruc-tion probabilities by using the above ensures that we have detailed balance. All that remains when constructing these chains is to ensure that our transition probabilities result in a chain that is ergodic. We can construct irreducible chains by combining transition probability matrices that are not irreducible but satisfy detailed balance. If a set of transition matrices satisfy detailed balance, {Pj;j = 1,2, . . . n}, then we have that
P =P1P2. . . Pn (2.0.12) and P = 1 n n X i=1 Pi (2.0.13)
also satisfy detailed balance. We can use 2.0.12, to construct a MCMC scheme that is dened for each random variable separately.
When sampling from a MCMC scheme it is important to consider the burn-in period, thburn-innburn-ing and convergence. The Markov Chaburn-in will asymptotically approach the target distribution, convergence is concerned with how long we need to iterate the chain for until we are assured that we are sampling from the target distribution. There is no explicit way to determine if a chain has converged, there are however heuristics that can be used to give an indication if the chain has not yet converged. These include visualization methods and test statistics. Visualization methods comprise the use of autocorrelation plots and trace plots. Trace plots that do not contain large shifts in the sampled value putatively indicate that we may have convergence. By the very nature of
Markov Chains, the samples produced are autocorrelated, plots that indicate an exponential decay in the autocorrelation for larger lag values are putatively indicative of convergence.
Test statistics such as Geweke [47], which produces a z-score involves cal-culating the dierence between the the mean of the rst ninitial proportion of sampled values and the mean of the last nf inal proportion of sampled val-ues, normalized by the asymptotic standard error. The normalized dierences asymptotically follow a standard normal distribution, thus producing a z-score. This approach is discussed in [25]. One of the major criticisms in the appli-cation of this test statistic is the unclear choice of ninitial and nf inal, though a value of ninitial = 0.1 and nf inal = 0.5 was originally suggested. Raftery and Lewis also discussed diagnostic strategy to determine the number of it-erations required to achieve a certain level of precision [112]. A diagnostic test developed by Gelman and Rubin, involves the comparison of two separate sample runs, thus producing separate chains. The variances between chains are compared to the variances within chains. A resulting ratio value far from one therefore provides evidence to suggest a lack of convergence [46].
Gene expression data, specically microarray data, remains one of the pri-mary data sources for the study of gene interaction, gene expression and reg-ulatory inference. New techniques and approaches are constantly being de-veloped from various elds of study. One of the potential reasons for the development of such a variety of techniques, apart from the fact that they may oer dierent perspectives or exploit dierent aspects of the system, is that validation of these techniques is problematic [118]. As mentioned, pre-viously, there are many techniques based on synthetic benchmarking. One of the major reasons for this is that the true underlying gene interaction network is mostly unknown, therefore biologically truthful validation is often compli-cated. Nevertheless, the complex dynamic of the biological system can often not be captured by hypothesized synthetic data, thus it is important to gener-ate putative biologically relevant hypotheses that can be tested and evalugener-ated using other experimental techniques.
The uncovering, learning or reverse engineering of the interaction between genes from available data has been, and still remains, a complicated problem. Viewing the problem from the point of view of a dynamical system and network reconstruction has lead to the development of several algorithms and methods. Each method seeks to model an aspect of the biological system, but the success of these methods are quite varied with no true benchmark currently available. With the increase in availability of data, so also the potential to uncover true interaction between genes increases. It is evident from the above that there has been, and still is, considerable eort committed to trying to understand the interaction between genes. Eort both from a computational mathemat-ical perspective and from an experimental biologmathemat-ical focus. The problem is further complicated by the combinatorial nature of gene interactions, the mul-tiple levels of regulation that can eect gene expression and that genes, along
with their products, are part of a larger complex system, with several unknown components. Still, the techniques that have been applied have enjoyed vari-ous degrees of success and each provide another step in the model generation procedure, thus improving the general understanding of the system. The rele-vance of understanding how genes interact with each other lies in the fact that genes are fundamental functional units that play an important role in the cell of an organism.
2.1 List of References
[1] Äijö, T. and Lähdesmäki, H. (2009). Learning gene regulatory networks from gene expression measurements using non-parametric molecular kinetics. Bioin-formatics, vol. 25, no. 22, pp. 29372944.
[2] Aittokallio, T. and Schwikowski, B. (2006). Graph-based methods for analysing networks in cell biology. Briengs in bioinformatics, vol. 7, no. 3, pp. 243255. [3] Akutsu, T., Miyano, S. and Kuhara, S. (1999). Identication of genetic net-works from a small number of gene expression patterns under the boolean network model. In: Pacic Symposium on Biocomputing, vol. 4, pp. 1728. World Scientic Maui, Hawaii.
[4] Aliferis, C.F., Statnikov, A., Tsamardinos, I., Mani, S. and Koutsoukos, X.D. (2010). Local causal and markov blanket induction for causal discovery and feature selection for classication part i: Algorithms and empirical evaluation. The Journal of Machine Learning Research, vol. 11, pp. 171234.
[5] Aliferis, C.F., Tsamardinos, I. and Statnikov, A. (2003). Hiton: a novel markov blanket algorithm for optimal variable selection. In: AMIA Annual Symposium Proceedings, vol. 2003, p. 21. American Medical Informatics Association. [6] Altschul, S.F., Gish, W., Miller, W., Myers, E.W. and Lipman, D.J. (1990).
Basic local alignment search tool. Journal of molecular biology, vol. 215, no. 3, pp. 403410.
[7] Altschul, S.F., Madden, T.L., Schäer, A.A., Zhang, J., Zhang, Z., Miller, W. and Lipman, D.J. (1997). Gapped blast and psi-blast: a new generation of protein database search programs. Nucleic Acids Research, vol. 25, no. 17, pp. 33893402.
[8] Amaratunga, D. and Cabrera, J. (2001). Analysis of data from viral dna microchips. Journal of the American Statistical Association, vol. 96, no. 456, pp. 11611170.
[9] Antoniak, C.E. (1974). Mixtures of dirichlet processes with applications to bayesian nonparametric problems. The Annals of Statistics, pp. 11521174. [10] Ashburner, M., Ball, C., Blake, J., Botstein, D., Butler, H., Cherry, J., Davis,
A., Dolinski, K., Dwight, S., Eppig, J.T. Harris, M.A., Hill, D.P., Issel-Tarver, L., Kasarskis, A., Lewis, S., Matese, J.C., Richardson, J.E., Ringwald, M., Rubin, G.M. and Sherlock, G. (2000). Gene ontology: tool for the unication of biology. Nature genetics, vol. 25, no. 1, p. 25.
[11] Baldwin, N.E., Collins, R.L., Langston, M.A., Symons, C.T., Leuze, M.R. and Voy, B.H. (2004). High performance computational tools for motif discovery. In: Parallel and Distributed Processing Symposium, 2004. Proceedings. 18th International, p. 192. IEEE.
[12] Barabási, A.-L. and Oltvai, Z.N. (2004). Network biology: understanding the cell's functional organization. Nature Reviews Genetics, vol. 5, no. 2, pp. 101 113.
[13] Ben-Dor, A., Shamir, R. and Yakhini, Z. (1999). Clustering gene expression patterns. Journal of Computational Biology, vol. 6, no. 3-4, pp. 281297. [14] Bondy, J.A. and Murty, U.S.R. (1976). Graph theory with applications, vol.
290. Macmillan London.
[15] Boruvka, O. (1926). O jistém problému minimálním [on a certain minimal problem].
[16] Brazma, A. and Vilo, J. (2000). Gene expression data analysis. FEBS letters, vol. 480, no. 1, pp. 1724.
[17] Brohée, S., Janky, R., Abdel-Sater, F., Vanderstocken, G., André, B. and van Helden, J. (2011). Unraveling networks of co-regulated genes on the sole basis of genome sequences. Nucleic acids research, vol. 39, no. 15, pp. 63406358. [18] Butenko, S. and Wilhelm, W.E. (2006). Clique-detection models in
computa-tional biochemistry and genomics. European Journal of Operacomputa-tional Research, vol. 173, no. 1, pp. 117.
[19] Camacho, C., Coulouris, G., Avagyan, V., Ma, N., Papadopoulos, J., Bealer, K. and Madden, T. (2009). Blast+: architecture and applications. BMC bioinformatics, vol. 10, no. 1, p. 421.
[20] Cantone, I., Marucci, L., Iorio, F., Ricci, M., Belcastro, V., Bansal, M., Santini, S., di Bernardo, M., di Bernardo, D. and Cosma, M. (2009). A yeast synthetic network for in vivo assessment of reverse-engineering and modeling approaches. Cell, vol. 137, no. 1, p. 172.
[21] Chaouiya, C. (2007). Petri net modelling of biological networks. Briengs In Bioinformatics, vol. 8, no. 4, pp. 210219.
[22] Chen, T., He, H. and Church, G. (1999). Modeling gene expression with dierential equations. In: Pacic symposium on biocomputing, vol. 4, p. 4. [23] Chickering, D. (1996). Learning bayesian networks is np-complete. Lecture
notes in statistics-New York-Springer Verlag-, pp. 121130.
[24] Covert, M., Schilling, C. and Palsson, B. (2001). Regulation of gene expression in ux balance models of metabolism. Journal of theoretical biology, vol. 213, no. 1, pp. 7388.
[25] Cowles, M.K. and Carlin, B.P. (1996). Markov chain monte carlo convergence diagnostics comparative review. Journal of American Statistical Association, vol. 91, pp. 883904.
[26] Csermely, P., Agoston, V. and Pongor, S. (2004). The eciency of multi-target drugs: the network approach might help drug design. arXiv preprint q-bio/0412045.
[27] Dahl, D. (2006). Model-based clustering for expression data via a dirichlet process mixture model. Bayesian inference for gene expression and proteomics, pp. 201218.
[28] Davidson, E., Rast, J., Oliveri, P., Ransick, A., Calestani, C., Yuh, C., Mi-nokawa, T., Amore, G., Hinman, V., Arenas-Mena, C., Otim, O., Brown, C.T., Livi, C.B., Lee, P.Y., Revilla, R., Rust, Alistair G. Pan, Z.j., Schilstra, M.J., Clarke, P.J., Arnone, M.I., Rowen, L., Cameron, R.A., McClay, D.R., Hood, L. and Bolouri, H. (2002). A genomic regulatory network for development. Science Signalling, vol. 295, no. 5560, p. 1669.
[29] De Hoon, M., Imoto, S., Kobayashi, K., Ogasawara, N. and Miyano, S. (2002). Inferring gene regulatory networks from time-ordered gene expression data of bacillus subtilis using dierential equations. In: Biocomputing 2003: Proc. Pacic Symposium, vol. 8, pp. 1728.
[30] Do, K.-A., Müller, P. and Tang, F. (2005). A bayesian mixture model for dierential gene expression. Journal of the Royal Statistical Society: Series C (Applied Statistics), vol. 54, no. 3, pp. 627644.
[31] Dudoit, S. and Yang, J.Y.H. (2003). Bioconductor r packages for exploratory analysis and normalization of cdna microarray data. In: The Analysis of Gene Expression Data, pp. 73101. Springer.
[32] Dukka, B., Akutsu, T., Tomita, E., Seki, T. and Fujiyama, A. (2002). Point matching under non-uniform distortions and protein side chain packing based on an ecient maximum clique algorithm. In: Genome informatics. Interna-tional Conference on Genome Informatics, vol. 13, p. 143.
[33] Dâhaeseleer, P., Liang, S. and Somogyi, R. (2000). Genetic network in-ference: from co-expression clustering to reverse engineering. Bioinformatics, vol. 16, no. 8, pp. 707726.
[34] Euler, L. (1736). Solutio problematis ad geometriam situs pertinentis. Com-mentarii academiae scientiarum Petropolitanae, vol. 8, pp. 128140.
[35] Ewing, R., Kahla, A., Poirot, O., Lopez, F., Audic, S. and Claverie, J. (1999). Large-scale statistical analyses of rice ests reveal correlated patterns of gene expression. Genome research, vol. 9, no. 10, pp. 950959.
[36] FANG-XIANG, W., Zhang, W. and ANTHONY, J. (2004). State-space model with time delays for gene regulatory networks. Journal of biological Systems, vol. 12, no. 04, pp. 483500.
[37] Ferguson, T.S. (1973). A bayesian analysis of some nonparametric problems. The Annals of Statistics, pp. 209230.