A Systems Approach to Understanding Mechanisms
of Drug Induced Mitochondrial Toxicity
Thesis Submitted for the Degree of Doctor of Philosophy (PhD)
By
Ashley John Broom B.Sc. (Hons)
(CID:00725856)
Supervision
Professor Alan R Boobis OBE - Imperial College London Professor Timothy W Gant - Public Health England Doctor Jonathan Lyon - GlaxoSmithKline
Imperial College London
Department of Medicine
ii
Declaration of OriginalityI (Ashley John Broom), hereby declare that the data and information contained within this thesis is, to the best of my knowledge, original and all work of others is adequately referenced.
Copyright Declaration
The copyright of this thesis rests with the author and is made available under a Creative Commons Attribution Non-Commercial No Derivatives licence. Researchers are free to copy, distribute or transmit the thesis on the condition that they attribute it, that they do not use it for
commercial purposes and that they do not alter, transform or build upon it. For any reuse or redistribution, researchers must make clear to others the licence terms of this work.
iii
Acknowledgements
I am truly indebted to a vast number of people for their help, support and motivation over the past four years. Please bear with me!
First of all I would like to thank my funding bodies (the Medical Research Council CASE award programme and GlaxoSmithKline) for providing the opportunity to complete this PhD project. Secondly, I would like to acknowledge the tremendous support I have received from my industrial manager, Jon Lyon and colleagues in GlaxoSmithKline’s Safety Assessment (SA) facility in Ware. Jon has had to calm me down, pick me up and coach me through, for which I will always remain very thankful and appreciative for his patience and his trust in me. A massive thank you must also go to the other SA “Mito-Team” (Gino, Jimbo, Dave and Angie) who were all such fantastic company and a pleasure to work with (often until the early-hours of the morning)! I especially thank Gino for his company on the infamous trip to Philadelphia where work had to be suspended due to Hurricane Sandy in October 2012. On the other side of the pond, I would also like to thank Jimmy Mangum, Catherine Hu and Kevin French for their support. I would also like to acknowledge other members of the Investigative Preclinical Toxicology group. The CPT team (Anita, Graeme and Chloe) for their guidance with cell culture and Dave Baker for drinking beer and playing snooker with me! Elsewhere at GlaxoSmithKline, I must thank Paul McGill and Ian Francis for their excellent electron microscopy support, the Laboratory Animal Sciences and Histopathology team for their diligent animal experimentation, Mitul Gandhi for his help with lactate/pyruvate analyses and the Drug-Metabolism and Pharmacokinetics groups for performing the drug-concentration toxicokinetic analyses.
I also owe a debt of gratitude to my academic supervisor Alan Boobis, whose intellect and unwavering support have been both admired and appreciated respectively. Furthermore, I would like to thank Tim Gant who originally gave me this opportunity and who was so welcoming and supportive during my 18 month stint in his laboratories in Oxfordshire. This project would not have been possible without you both.
Away from science, I would like to say a massive thank you to my Mum, Dad and sister, Kathryn for their love and encouragement. I am forever indebted to you for kindly letting me move home during the process of writing this thesis. The Channel Islands (Jersey) was certainly an atmosphere conducive to writing, despite the draw of Beauport Bay, The Watersplash Bar and El-Tico ribs! I would also like to apologise to my friends who I have somewhat neglected over the past four years… I hope I can make up for this soon.
Finally a big thank you to my girlfriend Laura for her love and support throughout thesis complications, gene-chip malfunctions, cell-culture contaminations etc... But most of all just for being there. I promise to be there for you too.
iv
Abstract
A Systems Approach to Understanding Mechanisms of Drug Induced
Mitochondrial Toxicity
Ashley J Broom, Imperial College London, Department of Medicine
Mitochondria are important to the pharmaceutical industry. Mitochondrial perturbation is central to the aetiology of many poorly treated human diseases (e.g. neurodegenerative diseases, diabetes and cancer) and hence mitochondria are increasingly becoming therapeutic targets. However, drug-induced mitochondrial toxicity (DIMT) has also gained recognition as a significant cause of safety related attrition (including multiple post-market withdrawals). The present work ultimately aimed to discern the mechanisms downstream of DIMT in vitro and in vivo with two tool compounds which act via inhibition of the mitochondrial electron transport chain (ETC) (GSK932121A) or via uncoupling of mitochondrial oxidative phosphorylation (GSK2617971A). The first objective was to compare mitochondrial functional responses between in vitro (treatment of mitochondria isolated from control animals or in vitro cell lines)and in vivo scenarios using oxygen consumption rate (OCR) and calcium retention capacity (CRC) assays. The direction of change in these assays was often different between the in vitro and in vivo situation. Whilst seemingly contradictory, these differences reflect an adapted state in vivo which results from the initial insult in combination with compensatory changes made by the tissue to maintain energy production. In contrast, only the initial, unconfounded, response to treatment is observable in vitro. Integration of both is key to the future risk assessment of mitochondrially-active drug candidates.
The second objective was to use a systems approach to build candidate adverse outcome pathways (AOP)/modes of action (MOA) for both tool compounds. AOP/MOAs were constructed based on key events observed in vivo. With both compounds, effect on body temperature, increased lactate/pyruvate ratio, gene expression changes indicative of a fasted state (induction of gluconeogenic genes) and mitochondrial ultrastructure effects were key events observed in the adverse outcome. Future work using additional compounds with mitochondrial activities would help validate the proposed AOP/MOAs.
The third objective was to highlight markers of underlying mitochondrial perturbation with utility for future pre-clinical monitoring in the absence of overt DIMT. A number of mitochondrial functional changes (e.g. effect on CRC) were observed prior to the onset of overt toxicity in vivo,
with both compounds and these endpoints have potential use in tailored future studies with mitochondrially-active drug candidates.
These findings add to the knowledgebase on DIMT, particularly with regard to the candidate AOP/MOAs which have been postulated. This will facilitate the selection of more sensitive and functional endpoints for use in future toxicology studies with drugs where mitochondrial impairment is suspected.
v
Table of Contents
Acknowledgements ... iii
List of Tables ... xi
List of Figures ... xiii
List of Abbreviations ... xvii
1.0. General Introduction ... 1
1.1. The Importance of Drug-Induced Mitochondrial Toxicity ... 2
1.2. Introduction to Mitochondria ... 3
1.3. Mitochondrial Structure and Genome ... 4
1.4. Mitochondrial Function ... 7
1.4.1. Mitochondria: Energy Production ... 7
1.4.2. Mitochondria: ROS ... 10
1.4.3. Mitochondria: Cell Death ... 11
1.5. Mechanisms of DIMT ... 12
1.5.1. Direct inhibitors of OXPHOS: ... 14
1.5.2. Inhibitors of mitochondrial substrate oxidation: ... 20
1.5.3. ROS generation: ... 21
1.5.4. Inducing mitochondrial permeability transition: ... 21
1.5.5. Oxidation and Mutations of mtDNA, or Inhibition of mtDNA Synthesis: ... 23
1.5.6. Multiple Mechanisms ... 24
1.6. Methods of Detecting DIMT ... 24
1.7. Challenges and Complexities ... 30
1.8. The use of a Systems Approach ... 33
1.9. Tool Compounds Studied ... 34
1.9.1. GSK932121A (Complex III Inhibitor) ... 35
1.9.2. GSK2617971A (OXPHOS Uncoupler) ... 37
vi
2.0. Materials and Methods ... 41
2.1. Animals ... 42
2.1.1. GSK932121A Studies – GlaxoSmithKline, Ware, Hertfordshire UK ... 42
2.1.2. GSK2617971A Study – GlaxoSmithKline, Upper Merion, Pennsylvania, USA ... 42
2.2. In Life Clinical Observations ... 43
2.3. Preparation of Dosing Solutions ... 43
2.3.1. GSK932121A Studies – GlaxoSmithKline, Ware, Hertfordshire UK ... 43
2.3.2. GSK2617971A Study – GlaxoSmithKline Upper Merion, PA, USA ... 43
2.3.3. Formulation of compounds for in vitro experiments ... 44
2.4. Measurement of Blood Gasses and Bicarbonate ... 44
2.5. Blood Sampling ... 45
2.5.1. Preparation of plasma from whole blood samples ... 45
2.6. Measurement of GSK932121A and GSK261971A Concentration in Plasma ... 46
2.7. Body Temperature Measurements ... 46
2.8. Isolated Mitochondrial Methods ... 47
2.8.1. Isolation of Mitochondria ... 47
2.8.2. Assessment of Protein Concentration ... 49
2.8.3. Assessment of Mitochondrial Bioenergetics using the Seahorse XF24 Analyser ... 49
2.8.4. Calcium Retention Capacity Assay ... 51
2.8.5. Mitochondrial Membrane Potential Assay ... 53
2.8.6. Complex III Activity Assay ... 53
2.9. Cell Culture Techniques ... 54
2.9.1. HepG2 Cell Culture and Media Composition ... 54
2.9.2. Assessment of Cytotoxicity... 56
2.9.3. Analysis of Whole Cell Bioenergetics in HepG2 Cells... 56
2.9.4. In vitro Compound Wash out Experiment ... 58
2.10. Imaging and Histology... 59
2.10.1. TEM Analysis of Isolated Mitochondrial Pellets ... 59
2.10.2. TEM Analysis of HepG2 Cells... 59
2.10.3. TEM Analysis of Liver... 60
vii
2.11. Western Blot ... 60
2.12. Reduced / Oxidised Glutathione Assay ... 61
2.13. Measurement of Lactate / Pyruvate in Plasma ... 62
2.14. Measurement of Lactate in Cell Culture Media ... 62
2.15. Total RNA Extraction ... 63
2.15.1. HepG2 Lysate Preparation ... 63
2.15.2. Rat Liver Tissue Homogenate Preparation ... 64
2.15.3. Total RNA Extraction ... 64
2.16. RNA Quantification and Assessment of Integrity ... 65
2.16.1. Quantification Using the NanoDrop Spectrophotometer ... 65
2.16.2. Assessment of RNA Integrity ... 65
2.17. Transcriptional Profiling using Affymetrix Genechip Microarrays ... 66
2.17.1. Generation of Sense Strand cDNA ... 66
2.17.2. Fragmentation and Labelling of cDNA Template ... 67
2.17.3. Hybridisation, Wash and Staining of Affymetrix Genechips ... 68
2.17.4. Scanning of Genechips and Statistical Analysis of Microarray Data ... 68
2.17.5. Pathway Analysis ... 69
2.17.6. Compound Connectivity Mapping ... 69
2.18. TaqMan RT-PCR Analysis from In vitro Samples ... 70
2.18.1. Gene Panel ... 71
2.18.2. First Strand cDNA Synthesis ... 72
2.18.3. TaqMan RT-PCR ... 72
2.18.4. RT-PCR Statistical Analysis ... 73
2.19. Global Metabolomics Profiling ... 73
3.0. Mechanisms of DIMT – GSK932121A Induced Complex III Inhibition ... 75
3.1. Introduction ... 76
3.1.1. Chapter Aims ... 76
3.2. Results ... 77
3.2.1. Confirmation of Respiratory Chain Inhibition ... 77
3.2.2. Acute Dose In Vivo Study (Non Mitochondrial Endpoints) ... 80
viii
3.2.4. Transcriptomics ... 90
3.3. Discussion ... 92
3.3.1. Summary ... 96
4.0. A Metabolomics Approach to Understanding Mechanisms of Drug-Inudced Respiratory Chain Inhibition ... 98
4.1. Introduction ... 99
4.1.1. Chapter Aims ... 100
4.1.2. Study Design ... 100
4.1.3. Metabolomics Data Visualisation ... 101
4.2. Results and Discussion ... 102
4.2.1. In Life Effects and Comparison of Endpoints to Chapter 3 Study ... 102
4.2.2. Effect of GSK932121A on Total Metabolites in the Liver and Plasma ... 105
4.2.3. Metabolomics: Complex III inhibition has a prominent impact on plasma TCA cycle intermediates ... 106
4.2.4. Metabolomics: Complex III Inhibition causes an increase in glycogenolysis and glycolysis ... 108
4.2.5. Metabolomics: Complex III inhibition has an effect on mitochondrial FA oxidation ………. ... 111
4.2.6. Metabolomics: Complex III Inhibition has an effect on amino acid catabolism ... 115
4.2.7. Metabolomics: Inhibition of Complex III Causes Increased Levels of Hepatic Oxidative Stress ... 118
4.3. Further Discussion ... 121
4.3.1. Metabolomics ... 121
4.4. Summary…. ... 121
5.0. Integration of GSK932121A Data into an AOP/MOA ... 123
5.1. Introduction – AOP/MOA of GSK932121A Toxicity ... 124
5.2. Key Events: Complex III Inhibition ... 126
5.3. Possible Key Events: Complex III Inhibition ... 128
5.4. Associated Events ... 131
5.5. Modifying Factors ... 135
5.6. AOP/MOA of Respiratory Chain Inhibitors ... 135
ix
6.0. Mechanism of DIMT– GSK2617971A Induced Uncoupling of OXPHOS ... 138
6.1. Introduction ... 139
6.1.1. Chapter Aims ... 140
6.2. Results ... 140
6.2.1. Confirmation of the Uncoupling Activity of GSK2617971A ... 140
6.2.2. Acute Dose In vivo Study With GSK2617971A – Non Mitochondrial Endpoints . 144 6.2.3. Acute Dose in vivo Study with GSK2617971A – Mitochondrial Endpoints ... 147
6.2.4. Identifying Mechanisms of Toxicity following OXPHOS Uncoupling in vivo using Transcriptomics ... 154
6.3. Discussion ... 159
6.4. Summary ... 165
7.0. The Effect of Sub-Cytotoxic Concentrations of GSK932121A and GSK2617971A in vitro and Comparison with a Bioinformatically Selected ‘Similar’ Chemical ... 166
7.1. Introduction ... 167
7.1.1. Experimental Aims ... 168
7.2. Results ... 169
7.2.1. Identifying Effectual Sub-Cytotoxic Concentrations ... 169
7.2.2. In Vitro Lactate Generation ... 174
7.2.3. RT-PCR – Metabolic Switch Gene Panel ... 179
7.2.4. In vitro Electron Microscopy ... 188
7.2.5. Compound Connectivity Mapping ... 190
7.3. Discussion ... 198
7.3.1. Mitochondrial Toxicity, Cytotoxicity and Lactate Generation ... 198
7.3.2. Gene Panel Discussion ... 200
7.3.3. The Link Between Azacyclonol and GSK932121A and GSK2617971A ... 202
7.3.4. Summary ... 204
8.0. Thesis Discussion ... 206
8.1. Manifestation of Mitochondrial Toxicity in vitro versus in vivo ... 207
8.2. The Use of a Systems Approach to Generate AOP’s ... 209
8.3. Markers of DIMT in the Absence of Overt Toxicity ... 212
8.4. Future Work ... 215
x
REFERENCES ... 218
APPENDIX I–STRUCTURAL ASSESSMENT OF ISOLATED MITOCHONDRIAL FRACTIONS ... 237
APPENDIX 1.1: Transmission Electron Microscopy ... 237
APPENDIX 1.2: Western Blot ... 240
APPENDIX II –FUNTIONAL ASSESSMENT OF ISOLATED MITOCHONDRIAL FRACTIONS ... 243
APPENDIX III– CONCENTRATION OF GSK932121AIN ISOLATED LIVER MITOCHONDRIA OF RATS TREATED WITH A 50MG/KG DOSE (CHAPTER 3) ... 246
APPENDIX IV: METABOLOMICS RAW DATA ... 247
xi
List of Tables
TABLE 1.1: Examples of assays used in the pharmaceutical industry for the analysis of DIMT .. 29
TABLE 2.1: Overview of blood sampling methodologies. ... 45
TABLE 2.2: Media constituents for HepG2 cell culture. ... 54
TABLE 2.3: HepG2 cell seeding density and flask/plate details. ... 55
TABLE 2.4: Serum free Seahorse assay media constituents ... 57
TABLE 2.5: Concentration of BOFA reagents loaded into the drug injection ports and final concentration in the well.. ... 57
TABLE 2.6: Details of the five antibodies comprising the mitochondrial membrane integrity western blot antibody cocktail (ab220414). ... 61
TABLE 2.7: Details of the primers and probes used for in vitro RT-PCR experiments ... 71
TABLE 4.1: Statistical summary of a plasma and liver metabolite changes. ... 106
TABLE 4.2: Impact of GSK932121A (50mg/kg) on plasma TCAi ... 107
TABLE 5.1: Experimental and literature evidence of key events in the complex III AOP/MOA including the plausibility of the relationships between the key events and remaining uncertainties at each stage. ... 127
TABLE 5.2: Evidence for, and remaining uncertainty surrounding PKE’s in the AOP/MOA of complex III inhibition. ... 130
TABLE 6.1: Direction of change in protein coding gene expression in GSK2617971A treated rat livers. ... 154
TABLE 6.2: IPA network analysis (biological theme analysis) of top 32 protein coding genes differentially altered in response to GSK2617971A (30 and 60mg/kg). ... 156
TABLE 6.3: IPA-Tox analysis of top 32 protein coding genes differentially altered in response to GSK2617971A. ... 158
TABLE 7.1: Genes selected for use in TaqMan gene-panel. ... 181
TABLE 7.2: Effect of GSK932121A and GSK2617971A on the intracellular levels of HepG2 cell glycogen and lipid. ... 189
TABLE 7.3: Genes submitted for connectivity mapping analysis... 191
TABLE 8.1: Representation of the relationships between Toxicity Pathways, Mode of Action Pathways, Adverse Outcome Pathways, and Source to Outcome Pathways. ... 211
APPENDIX TABLE 1.1: TEM Analysis of crude mitochondrial pellets isolated from five tissues of high metabolic load. ... 239
xii
APPENDIX TABLE 2.1: Non-quantitative comparison between obtained RCR values formitochondria isolated from five tissues of high metabolic load and published RCR
values ... 245
APPENDIX TABLE 3.1: Levels of GSK932121A in the mitochondrial fraction. ... 246
APPENDIX TABLE 4.1: Liver metabolomics raw data. ... 247
xiii
List of Figures
FIGURE 1.1: Structure of a eukaryotic mitochondrion. ... 5
FIGURE 1.2: The mitochondrial respiratory chain. ... 9
FIGURE 1.3: Graphical representation of mitochondria as a mediator of drug-induced toxicity....13
FIGURE 1.4: Schematic representation of drugs which have been implicated in inhibition of OXPHOS either via direct inhibition of respiratory chain complexes I-IV or via chemical uncoupling. ... 17
FIGURE 1.5: Putative mPTP proteins in the OMM and IMM in normal physiological and pathophysiological conditions. ... 22
FIGURE 1.6: Chemical structure of GSK932121A. ... 35
FIGURE 1.7: Schematic of the approach taken to manufacture a GSK932121A pro-drug ... 37
FIGURE 1.8: Chemical structure of GSK2617971A. ... 38
FIGURE 2.1: The Seahorse Bioscience BOFA assay ... 50
FIGURE 2.2: Graphical representation of the CRC assay. ... 52
FIGURE 2.3: Graphical representation of the whole cell OCR assay for determination of bioenergetic parameters. ... 58
FIGURE 2.4: A typical lactate assay standard curve. ... 63
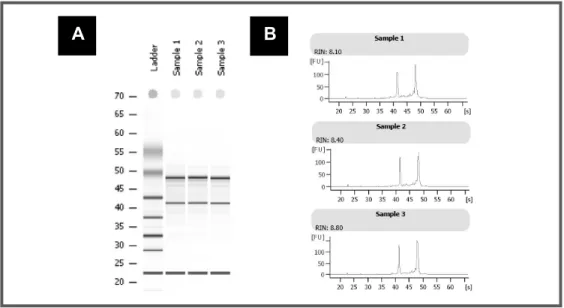
FIGURE 2.5: Gel image and electropherogram output from Agilent 2100 Bioanalyser – Assessment of RNA integrity. ... 66
FIGURE 3.1: Complex III activity assay with GSK932121A. ... 78
FIGURE 3.2: Analysis of liver mitochondrial OCR following in vitro treatment of control liver mitochondria with GSK932121A (measured using Seahorse XF24 analyser). ... 79
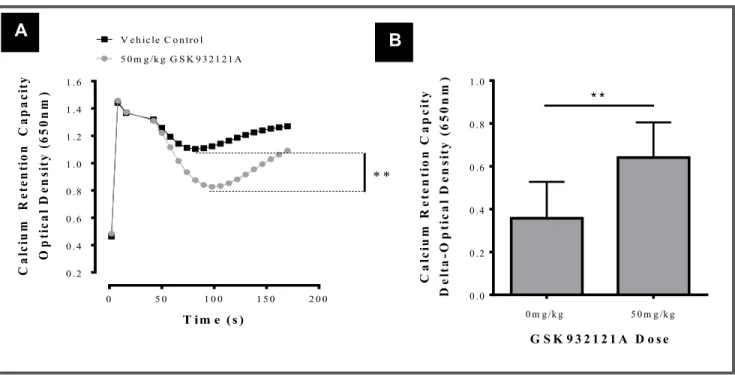
FIGURE 3.3: Assessment of the mitochondrial CRC. ... 80
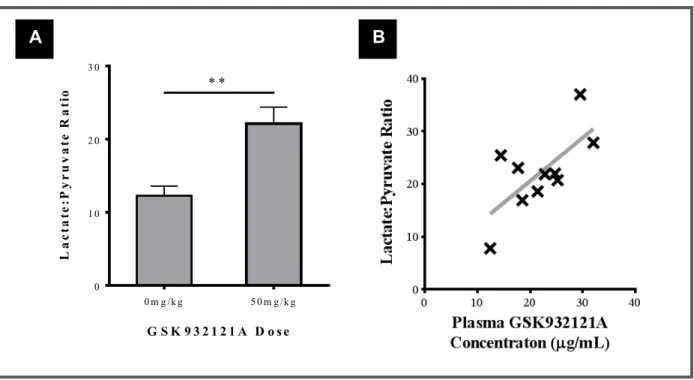
FIGURE 3.4: Relationship between core body temperature and plasma GSK932121A concentration. ... 81
FIGURE 3.5: Analysis of arterial blood gasses (p02 and pC02) and bicarbonate (HCO3) in whole blood of animals treated with GSK932121A (50mg/kg). ... 82
FIGURE 3.6: Effect of 50mg/kg GSK932121A on liver LM and TEM compared to VC. ... 84
FIGURE 3.7: Effect of 50mg/kg GSK932121A on whole blood lactate:pyruvate ratio compared with blood taken from VC animals ... 85
xiv
FIGURE 3.8: Analysis of liver GSH, GSSG and ratio of GSH:GSSG following treatment of rats with50mg/kg GSK932121A compared to vehicle control. ... 86 FIGURE 3.9: Analysis of liver mitochondrial CRC following treatment of rats with GSK932121A in
vivo. ... 87 FIGURE 3.10: Analysis of liver mitochondrial bioenergetics using the Seahorse XF24 analyser
following treatment of rats with GSK932121A in vivo ... 89 FIGURE 3.11: PCA of Affymetrix transcriptomics data (from liver of GSK932121A and VC animals)
highlighting relationship between degree of experimental data separation and plasma drug concentration. ... 91 FIGURE 3.12: Correlative analysis of gene copy number for 4 significantly altered genes and
GSK932121A plasma concentration. ... 92 FIGURE 4.1: Metabolomics data visualisation. ... 102 FIGURE 4.2: Effect of 12.5mg/kg and 50mg/kg GSK932121A on body temperature, blood
lactate:pyruvate ratio and isolated liver mitochondria CRC and OCR ... 104 FIGURE 4.3: Schematic representation of the glycogenolysis, glycolysis and PPP. ... 108 FIGURE 4.4: GSK932121A causes a dose dependent reduction in liver starch/glycogen intermediates
at a 4 hour time point. ... 109 FIGURE 4.5: Effect of GSK932121A treatment on key glycolysis metabolites in the liver of
GSK932121A and VC treated animals ... 110 FIGURE 4.6: Schemiatic representation of the carnitine shuttle and ketogenesis... 112 FIGURE 4.7: Effect of GSK932121A on plasma free carnitine... 113 FIGURE 4.8: Effect of GSK932121A on plasma and liver BHBA and plasma FA-acylcarnitine levels
... 114 FIGURE 4.9: Schematic representation of α-ketobutyrate and α-hydroxybutyrate involvement in the
supply of carbon sources to the TCA cycle. ... 115 FIGURE 4.10: Effect of GSK932121A on plasma and liver BCAA’s ... 117 FIGURE 4.11: Effect of GSK932121A on plasma AKB and its downstream metabolite AHB over a 4
hour time course ... 118 FIGURE 4.12: Effect of GSK932121A on oxidative stress and anti-oxidant stress response in the liver.
... 120 FIGURE 5.1.: Key events in the AOP/MOA for complex III inhibition. ... 126 FIGURE 5.2: PKE’s in the AOP for complex III inhibition ... 129
xv
FIGURE 5.3: Hybrid AOP/MOA including key events, possible key events and associated events inthe toxicological progression of complex III inhibition related toxicity... 132 FIGURE 6.1: Comparison of the OXPHOS uncoupling activity of GSK2617971A to 2,4-DNP in
control isolated liver mitochondria. ... 142 FIGURE 6.2: Assessment of the mitochondrial CRC following in vitro treatment of control liver
mitochondria with GSK2617971A and 2,4-DNP. ... 143 FIGURE 6.3: Relationship between core body temperature and plasma GSK2617971A concentration)
... 145 FIGURE 6.4: Effect of GSK2617971A treatment on blood lactate: pyruvate ratio. ... 146 FIGURE 6.5: TEM analysis of kidney sections of rats treated with 60mg/kg GSK2617971A and VC.
... 147 FIGURE 6.6: Analysis of kidney and liver mitochondrial bioenergetics using the Seahorse XF24
analyser following treatment of rats with GSK2617971A in vivo . ... 149 FIGURE 6.7: Reversibility of the uncoupling effect of GSK2617971A demonstrated in vitro in HepG2
cells... 150 FIGURE 6.8: Analysis of mitochondrial ΔΨ (JC-1) in liver and kidney mitochondria from animals
treated with GSK2617971A compared to VC……….151 FIGURE 6.9: Analysis of mitochondrial CRC in kidney and liver mitochondria isolated from
GSK2617971A treated rats and VC ... 153 FIGURE 6.10: PCA analysis of global hepatic transcriptional data pre and post statistical refinement.
... 155 FIGURE 6.11: Proposed AOP/MOA for mitochondrial OXPHOS uncoupling in vivo. ... 164 FIGURE 7.1: Analysis of HepG2 mitochondrial OCR following acute in vitro treatment with
GSK932121A (measured using Seahorse XFe96 analyser). ... 170 FIGURE 7.2: The effect of GSK932121A on HepG2 cytotoxicity (LDH) ... 171 FIGURE 7.3: Effect of GSK2617971A (OXPHOS uncoupling) on HepG2 cell metabolism (OCR and
ECAR). ... 172 FIGURE 7.4: Effect of GSK2617971A on HepG2 cell cytotoxicity ... 173 FIGURE 7.5: Effect of glucose concentration on the generation of lactate in HepG2 cell supernatant
following treatment with Oligomycin and Antimycin A ... 176 FIGURE 7.6: Effect of sub-cytotoxic concentrations of GSK932121A and GSK2617971A on HepG2
cell lactate generation up to 8 hours. ... 178 FIGURE 7.7: Heat map showing the effect in HepG2 cells of GSK932121A on a selection of pertinent
xvi
FIGURE 7.8: Heat map showing the effect in HepG2 cells of GSK2617971A on a selection ofpertinent genes involved in the response to DIMT. ... 187 FIGURE 7.9: Exemplar volcano plot for GSK2617971A / GSK932121A connectivity map and top ten
connected compounds. ... 193 FIGURE 7.10: Effect of azacyclonol on mitochondrial OCR in both HepG2 cells and isolated control
liver mitochondria. ... 194 FIGURE 7.11: Effect of azacyclonol on both HepG2 cell lactate generation and on the intracellular
level of glycogen clusters and lipid droplets. ... 196 FIGURE 7.12: Heat map showing the effect in HepG2 cells of azacyclonol on a selection of pertinent
genes involved in the response to DIMT. ... 197 FIGURE 8.1: Graphical representation of the relative metabolic states of potential target patient
populations and the commonly used preclinical animal species. ... 214 APPENDIX FIGURE 1.1: Assessment of mitochondria isolated from 5 rodent tissues via Western
blot.. ... 241 APPENDIX FIGURE 2.1: RCR values obtained for mitochondria isolated from liver, kidney, heart,
skeletal muscle and brain rat tissues. ... 244 APPENDIX FIG.5.1: Plasma lactate measured by Metabolon following treatment of rats with
xvii
List of Abbreviations
ΔΨ - Membrane potential 2-DG - 2-deoxyglucose 2,4-DNP - 2,4-dinitrophenol AHB - α-hydroxybutyrate AKB - -ketobutyrateADP - Adenosine diphosphate
AOP - Adverse outcome pathway
ATP - Adenosine triphosphate
BHBA - 3-hydroxybutyrate
BOFA - Basal, oligomycin, FCCP, antimycin A
CCCP - Carbonyl cyanide m-chlorophenyl-hydrazone
cDNA - Complementary deoxyribonucleic acid
CoA - Coenzyme A
CRC - Calcium retention capacity
cRNA - Complementary ribonucleic acid
Ct - Cycle threshold
DIMT - Drug-induced mitochondrial toxicity
DMSO - Dimethyl sulfoxide
DNA - Deoxyribonucleic acid
dNTP - Deoxynucleotide triphosphates
ECAR - Extracellular acidification rate
EDTA - Ethylenediaminetetraacetic acid
EGTA - Ethylene glycol-bis (2-aminoethylether)-N,N,N’,N-tetraacetic acid
ETC - Electron transport chain
FA - Fatty acid
FAD - Flavin adenine nucleotide
FCCP - Carbonyl cyanide-4-(trifluoromethoxy)phenylhydrazon
FDA - Food and drug administration
FTIH - First time in human
gDNA - Genomic deoxyribonucleic acid
GSH - Reduced glutathione
xviii
HEPES N-2.hydroxyethylpiperazine-N’-2-ethanesulfonic acid
IMS - Inter-membrane space
IRS - Insulin receptor substrate
LDH - Lactate dehydrogenase
IP - Intraperitoneal
IPA - Ingenuity pathway analysis
IVT - In vitro transcription
LD50 - 50% lethal dose
Me2 - Divalent metal ion
MOA - Mode of action
mPTP - Mitochondrial permeability transition pore
mRNA - Messenger ribonucleic acid
NAD+/NADH - Nicotinamide adenine dinucleotide oxidised / reduced
NRTI - Nucleotide reverse transcriptase inhibitors
NSAID - Non-steroidal anti-inflammatory drug
mw - Molecular weight
OCR - Oxygen consumption rate
OD - Optical density
OXPHOS - Oxidative phosphorylation
PBS - Phosphate buffered saline
PCA - Principle component analysis
PDK - Pyruvate dehydrogenase kinase
PKE - Possible key event
PPP - Pentose phosphate pathway
RCR - Respiratory control ratio
RMA - Robust multichip average
RNA - Ribonucleic acid
ROS - Reactive oxygen species
rRNA - Ribosomal ribonucleic acid
RT-PCR - Real time – polymerase chain reaction
SARM - Selective androgen receptor modulator
Sod2 - Superoxide dismutase 2
TBST - Tris buffered saline with Tween20
TCA/TCAi - The citric acid cycle / intermediates
1
2
1.1.
The Importance of Drug-Induced Mitochondrial Toxicity
“Failures to predict adverse drug reactions have immense financial implications, result in adverse human suffering and erode in trust of regulatory and pharmaceutical processes” [1].
The importance of drug-induced mitochondrial toxicity (DIMT) was realised when a number of nucleoside reverse transcriptase inhibitors (NRTIs, used for the treatment of HIV) were withdrawn from the market, due in part to deleterious effects on mitochondrial function [2]. Since then, a number of drugs have been reported to affect mitochondrial function with consequent adverse clinical reactions, necessitating Food and Drug Administration (FDA) black box warnings and drug withdrawals. An example is the first-in-class 2,4-thiazolidinedione anti-diabetic drug troglitazone, which had to be withdrawn from the market in 2000 due to delayed onset idiosyncratic hepatotoxicity which was later linked to adverse effects on mitochondrial function [3].
Mitochondria are important to the pharmaceutical industry. Mitochondrial toxicity is increasingly implicated in the aetiology of adverse drug reactions. Drugs from diverse chemical and therapeutic classes are known to undermine mitochondrial function and despite multiple clinical examples of mitochondrial toxicity, there remains no regulatory requirement to discharge the risk of mitochondrial effects as part of the pre-first time in human (FTIH) toxicology package [4]. This is not necessarily surprising as any regulatory requirement to discharge mitochondrial liability would represent a dynamic shift in drug safety assessment away from where the International Conference on Harmonisation of Technical Requirements for Registration of Pharmaceuticals for Human Use (ICH) is at present (i.e. assessing and identifying apical endpoints) and towards identifying key molecular events. Efforts have been made in industry in terms of in vitro preclinical screening for mitochondrial activity but there have been few rigorous efforts to correlate in vitro findings with in vivo functional endpoints or with conventional measures of toxicity. Improved in vivo assessment of mitochondrial function could facilitate the development of safer medicines but methods are currently underdeveloped and invalidated for practical application in preclinical studies [5]. The overall goal remains to identify and manage mitochondrial toxicity from the earliest possible point in drug development and support the safe progression of molecules, which may interact with mitochondria, to the market.
3 Despite the potentially potent effect of drugs which cause DIMT, mitochondria are increasingly seen as attractive targets for pharmacological intervention (i.e. therapeutic targeting of sub-optimal mitochondria) due to their central role in the mechanism of many common human diseases; e.g. as treatments for metabolic disorders (e.g. diabetes), neurodegenerative disorders, COPD and cancer. Given the diversity of metabolic pathways potentially affected by altering mitochondrial function, development of mitochondrial-targeting medicines clearly requires judicious safety assessment and risk management [5, 6]. Methods to assess drug-induced modulation of mitochondrial processes in vivo require particular attention. It is however important to acknowledge that, whilst a change in direction of a mitochondrial endpoint may be desirable (e.g. inhibition of the mitochondrial permeability transition pore, mPTP), a change in the other direction (i.e. potentiation of the mPTP) might be undesirable. The availability of quantitative measures of this activity are particularly useful in both situations.
This thesis focusses on the assessment of DIMT and correlates results obtained from in vivo studies to those obtained from in vitro studies. In vivo studies were performed using a systems toxicology approach in order to identify biochemical mechanisms downstream of DIMT and to generate adverse outcome pathways (AOP).
1.2.
Introduction to Mitochondria
Mitochondria, from the Greek mito (thread) and chondros (grains) are energy producing organelles that exist in the cytoplasm of eukaryotic cells. Mitochondria perform a variety of important functions including adenosine triphosphate (ATP) synthesis, calcium signalling/homeostasis, fatty acid (FA) metabolism, apoptosis initiation, regulation of cellular proliferation and biosynthesis of heme, pyrimidine and steroid structures [7].
Mitochondria were discovered in the late 19th century by Robert Alttman. They were originally called “bio-blasts” and described as "elementary organisms" living inside cells and carrying out vital functions [8]. Upon visualisation by electron microscopy in 1952, they were described as a collection of cytosolic free-floating individual vesicles forming thread-like structures inside cells [9, 10]. Just a year later in 1953, the oxidation capacity of mitochondria was revealed by discovering that specific staining of mitochondria by Janus Green B was due to the capacity of cytochrome oxidase to reoxidise the dye [11]. The following two decades saw a spate of discoveries relating to the role of mitochondria in cellular
4
respiration and oxidative phosphorylation (OXPHOS). Key discoveries included demonstration of the membranous localisation of the respiratory chain [12], demonstration of energy coupling between electron transport and ATP synthesis [13] and reconstitution of OXPHOS and related reactions [14].
Mitochondria are now widely acknowledged to be dynamic, pleomorphic structures constantly undergoing fission and fusion, with these processes tightly regulated by cellular stimuli and bioenergetic need [15]. Fission and fusion events allow the exchange of organelle content such as proteins, solutes, lipids and deoxyribonucleic acid (DNA) [16]. A wide body of evidence now suggests that impairment of the mitochondrial capacity is implicated in a number of human diseases and neuropathies [17].
The numbers of mitochondria in a cell vary widely depending on the cell type, owing to the differing degrees of reliance on cell sustainability and metabolic load [18]. Within a cell, the distribution of mitochondria is unequal, depending on the cellular energetic or metabolic demands; for example, in cardiac cells, mitochondria are localised to the contractile apparatus, whilst in a sperm cell they are wrapped tightly around the motile flagellum [19].
1.3.
Mitochondrial Structure and Genome
Mitochondria are highly compartmentalised organelles with two membranes, an outer mitochondrial membrane (OMM) rich in cholesterol / porin molecules and an inner mitochondrial membrane (IMM) rich in cardiolipin. These membranes functionally separate two distinct regions, the intermembrane space (IMS) and the water-containing matrix (shown in Fig.1.1). Mitochondria can only be visualised in detail using an electron microscope and are usually roughly ovoid but they may assume a filamentous shape or a vesicular form.
The OMM comprises two lipid bilayer membranes and contains many aqueous pores permeable to all ions and molecules up to 14 kDa [20]. This makes the IMS chemically equivalent to the cytosol with respect to the small molecules it contains. In contrast to the OMM, the IMM is impermeable to ions and polar molecules but contains many protein transporters spanning the membrane. Furthermore, the IMM is virtually devoid of cholesterol and is rich in cardiolipin (which binds the proteins of the ETC) [21]. The content of the matrix is dependent upon the availability of the transport proteins in the IMM to facilitate the import/export of molecules such as ATP/ADP which are transported via the adenosine nucleoside
5 translocator (ANT). The impermeability of the IMM allows an electrochemical gradient to be maintained and this gradient provides the proton motive force for ATP generation. Maintaining the integrity of the IMM is critical for mitochondrial function. The IMM is the most common target for mitochondrial toxicants. Many xenobiotics damage mitochondria either by increasing the permeability of the IMM or by inhibiting transport proteins within it. Furthermore, many drugs have a very high affinity for cardiolipin and thereby preferentially bind to the IMM and affect important organelle processes.
FIGURE 1.1: Structure of a eukaryotic mitochondrion: Electron microscopy image of a mitochondrion. Arrows show the key structural regions of the mitochondria, the outer mitochondrial membrane (OMM), the inner mitochondrial membrane (IMM), the intermembrane space (IMS), the matrix and the cristae. Image taken from [http://imgbuddy.com/mitochondria-microscope.asp] – Accessed 09 June 2015.
The IMM is invaginated forming structures known as cristae which greatly increase its total surface area for maximal ATP production. These cristae contain clusters of five protein complexes (complex I, II, III, IV and V) which are involved in a process known as oxidative phosphorylation (OXPHOS) where electron transport is tightly coupled to ATP synthesis [22].
OMM
IMS
Cristae Matrix
6 The mitochondrial matrix contains the vast majority of mitochondrial proteins, including those involved in fatty acid (FA) β-oxidation, haem/steroid synthesis and the tricarboxylic acid (TCA) cycle. The mitochondrial matrix also contains several copies of mitochondrial DNA (mtDNA) with the number of copies varying according to cell-type [6].
Mitochondria are the only organelles outside the nucleus that contain their own genome. A single DNA polymerase (polymerase-gamma, pol-γ) with base excision repair activity ensures the replication of mtDNA. Although pol-γ is a nuclear derived protein, its only known function is the replication of mtDNA and therefore any mutation or inhibition of this enzyme will manifest only in effects on mtDNA. The mtDNA shows substantial similarity to bacterial genomes (e.g. circular, unenclosed and lacking histones) leading to the theory that mitochondria were originally free-living aerobic bacteria that were then engulfed by eukaryotic cells more than a billion years ago [23]. The bacterial origin of mitochondria has implications for the drug discovery process as drugs designed to impair bacterial protein synthesis may have the potential to cause an adverse effect in the host’s mitochondrial ribosomes [24]. Mammalian mitochondrial ribosomes (55S) differ from bacterial (70S) and cytoplasmic ribosomes (80S) in terms of weight and molecular structure. Mitochondrial ribosomes are encoded in nuclear genes and imported into mitochondria where they assemble with mitochondrially transcribed rRNAs into ribosomes responsible for the translation of the 13 mitochondrial mRNAs encoding essential OXPHOS proteins [25].
mtDNA is maternally inherited and is present as several copies within the mitochondrial matrix. The mitochondrial genome consists of a small circular chromosome and each copy of mtDNA encodes 13 proteins, as well as 22 tRNA’s and 2 rRNA’s [26]. Whilst the proteins encoded by mtDNA are essential for OXPHOS, the majority of mitochondrial proteins are encoded by the nuclear genome and transported into the organelle by the means of protein localisation signalling and transporter molecules [27].
Mutations in mtDNA can cause serious disorders (mitochondrial-diseases) such as neuropathy, ataxia and retinitis pigmentosa (NARP), Leber hereditary optic neuropathy (LHON) and myoclonic epilepsy with ragged red fibres (MERRF) [28]. Not all mitochondrial diseases are due to mutations in mtDNA with some arising as a result of mutation in the nuclear genome. Moreover, polymorphic variations can give rise to a situation known as heteroplasmy, where each cell can have copies of both mutated mtDNA and wild-type DNA [29]. Unlike nuclear DNA, mtDNA is not protected by histone proteins and is located in close proximity to sites where reactive oxygen species (ROS) are routinely generated. This increases the
7 susceptibility of mtDNA to ROS-related oxidative damage. Also, some DNA repair processes are less efficient for mtDNA compared with nuclear DNA and as such the mutation rate is estimated to be at least 10-20 times higher [30].
1.4.
Mitochondrial Function
1.4.1.
M
ITOCHONDRIA:
E
NERGYP
RODUCTIONMitochondrial energy production is achieved by electron transfer in the respiratory chain, using a process known as OXPHOS. Approximately 95% of ATP is generated during aerobic (i.e. consuming oxygen) respiration by mitochondria. Mitochondria are also the site for other metabolic pathways, most notably the β-oxidation of FA’s and the TCA cycle.
Glucose is broken down in the cytosol during glycolysis (shown in Fig.4.3 in chapter 4), yielding a net gain of 2ATP molecules, 2 nicotinamide adenine dinucleotide (NADH) molecules and pyruvate. Under aerobic conditions, pyruvate is transferred to the mitochondrial matrix where it is converted to acetyl coenzyme A (acetyl CoA) by pyruvate dehydrogenase [31]. In the mitochondrial matrix the TCA cycle occurs whereby a series of enzyme-mediated chemical reactions occur with the objective of oxidising acetyl CoA to produce molecules capable of supplying electrons to the mitochondrial respiratory chain or replenishing molecular intermediates for other pathways. In brief, the output of the TCA cycle is the formation of 2CO2, 3NADH, 1GTP and 1FADH2. Additionally succinate formed in the cycle can be
oxidised by complex II of the mitochondrial respiratory chain (see Fig.1.2).
An alternative way of generating energy via OXPHOS is by using lipids which are stored in the form of FA’s in triglycerides. FA’s are degraded via catabolism in the mitochondrial matrix via a process known as β-oxidation. The process involves the extraction of several units of acetyl CoA by oxidation. The triglycerides are hydrolysed by lipases resulting in glycerol and FA. Glycerol can follow the glycolytic pathway while FA’s are processed via β-oxidation, wherein dehydration, hydration and oxidation occur to convert FA’s into several products used in mitochondrial metabolism including succinyl-CoA, which enters the TCA cycle.
8
In addition, the mitochondrion is the site at which the terminal steps of amino acid catabolism occur resulting in the production of acetyl CoA. Acetyl-CoA is therefore a convergence point for many catabolic pathways and enters the TCA cycle where energy rich electrons, abstracted from the oxidation of substrates, are used to reduce nicotinamide adenine dinucleotide (NAD+ to NADH) and flavin adenine dinucleotide (FAD+ to FADH
2). These high energy electrons (reducing equivalents) are then transferred
to the IMM where they enter the electron transport chain (ETC)[32].
NADH is oxidised by complex I (NADH:ubiquinone reductase) and the released energy is used to reduce ubiquinone and produce an electrochemical proton gradient. The majority of substrates produced via the TCA cycle (i.e. resulting from dietary fats, glucose and amino acids) are oxidised by this route meaning that this is the main entry point for channelling electrons into the ETC. Meanwhile the reduced form of FAD (FADH2), a prosthetic group within complex II (succinate dehydrogenase), also donates electrons to
ubiquinone [33]. This means that the second entry point of the respiratory chain is complex II-III (cytochrome bc1 complex) wherein complex III oxidises the reduced ubiquinol, promotes the generation of an electrochemical proton gradient by pumping protons across the IMM and reducing the water soluble carrier protein cytochrome c. Cytochrome c is attached to the cytosolic side of the IMM and serves as an electron carrier between complex III and IV. Complex IV (cytochrome oxidase) directly reduces molecular oxygen to water and further contributes protons to the electrochemical proton gradient.
As described above the transfer of electrons down an energy gradient is concomitant with the process of proton pumping from the matrix to the IMS by complexes I, III and IV resulting in the generation of an electrochemical (proton-motive) gradient i.e. the mitochondrial membrane potential (∆Ψ) [34] . The energy contained in the electrochemical gradient is utilised by complex V (ATP synthase) to make ATP from adenosine diphosphate (ADP) and inorganic phosphate. The overall rate of electron transport in the respiratory chain of mitochondria is regulated by the amplitude of the electrochemical potential (known as respiratory control). This is beneficial as under physiological conditions the decrease in proton gradient is due to the metabolic demand of the mitochondrion, and as a result an immediate stimulation of oxygen consumption (increased ETC activity) is observable. This means that the rate of respiration is therefore intrinsically coupled to the rate of metabolism. An overview of the ETC and OXPHOS system is shown in Fig.1.2 below.
9 FIGURE 1.2: The mitochondrial respiratory chain: High-energy electrons derived from reduced substrates are transferred through several multi-protein complexes to molecular oxygen. This provides the energy to move protons across
the inner mitochondrial membrane with ATP synthase utilising this energy to generate ATP. [H+- protons, Q-
ubiquinone]. Image not scaled.
Mitochondria are unique among cellular organelles, in that they can build up a ΔΨ of -180 to -220 mV. On particular occasions (e.g. when the IMM becomes permeable or in the presence of a proton/ion-ophore) the ΔΨ can be completely dissipated resulting in ATP depletion and an increase level of mitochondrial oxygen consumption (i.e. increased ETC output). A futile proton cycle then ensues, as protons bypass the F0F1 subunit of ATP synthase causing production heat [35]. This process is known as
mitochondrial uncoupling and can be protein dependent (e.g. in the presence of an uncoupling protein or UCP) or protein independent (requiring the presence of an ionophore or cationic lipid). ATP synthesis is therefore tightly coupled to electron transport with ATP synthase capable of converting energy from the electrochemical gradient into chemical bond energy in either direction [36].
Mitochondria are able to respond to a certain level of direct or indirect stress by utilisation of an innate respiratory reserve capacity. Reserve capacity is used to describe the amount of extra ATP that can be produced via OXPHOS at times of sudden increases in energy demand [37]. There are likely to be differing sensitivities to drug treatment in individuals based on age/genetics/co-medication etc. that alters the reserve mitochondrial capacity. Furthermore, the reserve capacity can often mask potential drug/mitochondrial interactions until the cell has a requirement to utilise that reserve capacity (e.g. under
10
conditions of stress) [38]. Effects may therefore not be seen until much later after exposure, a phenomenon recognised with cardiotoxicity. The mechanisms, by which the mitochondrial reserve capacities become compromised, are not well elucidated or understood [39].
1.4.2.
M
ITOCHONDRIA:
ROS
The normal process of electron transport is associated with some low level leakage of electrons which are directly donated to molecular oxygen. This results in the formation of reactive oxygen species such as superoxide which can react with, and damage, phospholipids, proteins and mtDNA [40]. Although the superoxide anion has limited chemical reactivity, it can be converted into more highly reactive species for example hydrogen peroxide (H202) and more particularly the hydroxide radical via Fenton chemistry [41].
Approximately 2-4% of the total oxygen consumed by mitochondria is not totally reduced to water and results in the formation of ROS. Under normal physiological conditions cells are able to counteract the harmful effects of ROS by several anti-oxidant defence systems including mitochondrial superoxide dismutase, glutathione peroxidase, peroxiredoxin (which utilises thioredoxin to counteract the effect of hydrogen peroxide) glutathione reductase, α-tocopherol and cytochrome c [42]. Furthermore, the methionine residues of mitochondrial proteins are able to prevent the oxidation of protein cysteine residues, inducing the formation of methionine sulphoxide and thus maintain protein functionality [43]. However when production of ROS exceeds the capacity of the anti-oxidant defence systems, oxidative stress ensues.
The main sources of ROS are complex I (primary source due to having the most reducing capacity) with complex III, monoamine oxidase and complex IV also contributing to burden. Mitochondrial proteins which are localised around the ETC (located primarily in the matrix or acting as IMM transporters) are constantly in danger of being impaired by oxidative stress [44]. Furthermore, impairment of complex I and complex III by oxidative stress can result in increased ROS generation from these sites and then a vicious cycle ensues [45]. In addition, chemical inhibition of the respiratory chain at multiple sites further increases the production of superoxide anions and as such drug-induced ROS generation may be a key player in the AOP of mitochondrial targeting compounds [46].
Loss of regulation of cellular calcium concentrations can also increase the production of superoxide anions by the mitochondrial respiratory chain. Calcium is able to bind to the phospholipid/cardiolipin rich
11
IMM which induces both a conformational and functional alteration in membrane function in turn facilitating electron leak from the respiratory chain [47].
1.4.3.
M
ITOCHONDRIA:
C
ELLD
EATHMitochondria have been demonstrated to play a crucial role in the cell death pathways, apoptosis and necrosis.
Necrosis describes the processes whereby cells suffer damage that results in increased cellular volume, aggregation of chromatin, disorganisation of the cytoplasmic contents, loss of plasma membrane integrity and loss of cellular functionality. During the progression of necrosis, most of the cell contents are released, causing damage to neighbouring cells, an increase in localised inflammation and irreversible damage to the surrounding tissue. Necrosis was always believed to be caused by passive disturbance; however, recent studies have suggested it can be regulated although in both scenarios, mitochondria have been heavily implicated in the control of necrosis. Cell death by necrosis can occur due to activation of the mitochondrial permeability transition (MPT) which comprises collapse of the proton motive force, a decrease in ATP production and an increase in ATP hydrolysis via F0F1-ATP synthase running in reverse
(i.e. hydrolysing ATP in order to maintain the ΔΨ, resulting in ATP depletion) [48]. Furthermore, it has been described that cell swelling during necrosis, due to alterations in the cytoskeleton and inhibition of the Na+/K+ pump) is caused by impaired cellular respiration and loss of ΔΨ [49].
Apoptosis, a form of programmed cell death, is a process by which cells are eliminated from the body during embryonic development, tissue homeostasis, normal cell turnover and following cell injury. In brief, apoptosis can result from two independent routes (intrinsic and extrinsic). During the extrinsic pathway, apoptosis is triggered by ligand-induced activation of death receptors at the cell surface, such as TNFR, CD95/Fas and TRAIL-R1/R2. The intrinsic apoptotic pathway heavily involves the mitochondria, either as initiators or propagators of the apoptotic signal.
An early event during intrinsic apoptosis is the release of cytochrome c from the IMM of the mitochondria into the cytosol. Cytochrome c then binds apoptotic protease activating factor (Apaf-1) and procaspase-9 promoting the formation of the heptameric apoptosome and the resultant activation of a group of cysteine proteases called “caspases”[50]. Caspases are categorised into initiators
(caspase-2,-8,-12
9, 10), effectors (caspase-3,-6,-7) and inflammatory (caspase-1,-4,-5) and they function to coordinate programmed cell death via chromatin condensation, DNA fragmentation and membrane blebbing [51]. Furthermore under certain apoptotic conditions (e.g. mitochondrial swelling) mitochondria release proteins such as cytochrome c (release mentioned above), Smac/DIABLO and the apoptosis inducing factor (AIF). AIF is then targeted to the nucleus where it binds to DNA, stimulating chromatin condensation and DNA breakdown [52]. Protein release from the mitochondria is a complex process and includes the oligomerisation on the OMM of the pro-apoptotic proteins Bax and Bak (pro-apoptotic Bcl2 proteins), which form a cytochrome c permeable channel. It is also now known the MPT pore (mPTP) can regulate calcium induced apoptosis and as such, the alteration in the calcium signal reaching mitochondria and/or the combined impact of apoptotic agents or pathological conditions (i.e. oxidative stress) can induce a profound alteration of mitochondrial structure, function and downstream cell death. This is highlighted by the work of Zamzami and colleagues who demonstrated that mitochondrial fragmentation during apoptosis was closely related to the collapse in ΔΨ, with this collapse being considered the point of no return in the apoptosis cascade [53].
1.5.
Mechanisms of DIMT
Drugs can interfere with mitochondrial function in many different ways. Given the structural and functional complexities of mitochondria it is unsurprising that many of these interactions can lead to DIMT. The mechanisms involved are reviewed below (Fig.1.3).
13 FIGURE 1.3: Graphical representation of mitochondria as a mediator of drug-induced toxicity: Mechanisms include not only direct inhibition or uncoupling of ETC and OXPHOS but also inhibition of transport or oxidation of substrates, of the mPTP as well as molecular targets of mitochondrial biogenesis (i.e. inhibition of mtDNA replication, transcription and translation, and import or post-translational processing of proteins). The result is either inhibition/uncoupling of the respiratory chain directly, an indirect failure to generate and assemble functional substrate for the ETC or induction of cell death pathways. All of which lead to ATP depletion and cellular bioenergetic deficit. Image taken and adapted from [27].
14
1.5.1.
D
IRECT INHIBITORS OFOXPHOS:
Drugs that interfere with OXPHOS include both inhibitors of the distinct complexes of the ETC and uncoupling agents. Acute poisoning of the respiratory chain classically presents signs and symptoms such as muscle weakness, fatigue, hypotension, confusion and nausea. The inhibition of the ETC and consequential inability to utilise oxygen at cytochrome oxidase causes cytotoxic hypoxia despite normal or above average blood oxygen. In contrast, uncouplers of OXPHOS from ETC function (caused by dissipation of the electrochemical proton gradient) induce disproportionate oxygen consumption. Uncouplers also cause ATP depletion and metabolic acidosis, but classically, little or no effect on blood oxygen is observed; The free energy of substrate oxidation is liberated as heat resulting in fever [20].
Complex I is the most susceptible of the ETC complexes to drug-induced malfunction. More than 60 different types of natural and synthetic compounds can perturb mitochondrial complex I activity including pesticides, neurotoxins, and antibiotics. It has been suggested, following rigorous structure activity relationship (SAR) studies that, generally compounds with complex I inhibitory activity have modular similarity to ubiquinone [54, 55]. Inhibitors of complex I can be broadly classified into one of three categories, namely, compounds that inhibit at the level of the NADH-flavin interface (such as rhein), complex I and III non-specific quinolone antagonists (such as myxothiazol) and finally, specific and potent inhibitors of complex I such as rotenone.
Complex II (succinate dehydrogenase) is less commonly studied in terms of its role in
pharmacotoxicology. This is unexpected considering that recent research has revealed a role for complex II in many roles independent to cell metabolism, such as succinate signalling, ischaemic preconditioning, ROS generation and ageing [56]. Complex II is experimentally inhibited using malonate or 3-nitroproprionic acid, but is also inhibited by a number of foloruoquinilones, fungicides, diazoxide and chloramphenicol (although many are not specific to complex II). Other compounds which affect mitochondrial complex II include the anticancer-drug etoposide, arsenic trioxide, cisplatin and menadione [57].
Complex III is the second membrane spanning protein complex of the ETC. The sensitivity of various
species to complex III inhibition varies significantly and as such, complex III inhibitors have been explored for use as anti-malarials, fungicides and anti-cancer drugs. Importantly the inhibition of complex
15
III of the mitochondrial chain (leading to ATP-depletion) is not the only harmful effect of these molecules. The generation of ROS following chemical inhibition of complex III likely contributes to the subsequent cellular and tissue toxicity. Inhibitors of complex III are generally categorised according to the site of action and these are outlined below.
Group I – Quinol antagonists encompassing a β-methoxyacrylate group that block the process of ubiquinol oxidation (e.g. myxothiazol, strobilurines and oudemasins).
Group II – Contain a 6-hydroxyquinone fragment and block electron transfer to cytochrome c1 and thus inhibit the reduction of cytochrome b1 (e.g. undecylhydroxydioxobenzothiazole, UHDBT).
Group III – Impede electron transfer from heme to a quinone or semiquinone molecule at the Qi site
of complex III (e.g. antimycin A and funiculosin).
Inhibitors of the Qi site of complex III such as antimycin are specific for the cytochrome-bc1 complex
whereas naturally occurring Qo site inhibitors are less specific and possess a ubiquinone-like structure
which often causes co-inhibition of complex I (albeit with significantly lower potency than the inhibitory effect they exert on complex III). Zinc ions are also acknowledged to inhibit the mitochondrial respiratory chain via complex III. Zinc binds reversibly and with high affinity to the Qo site of the cytochrome-bc1
complex and is able to inhibit oxygen consumption with high potency. Other mono- and di-valent metal cations, such as, Hg2+, Ag+, Cu2+ and Cd2+ have been shown to inhibit mitochondrial complex III although
with lower efficiency [20].
Complex IV is a heme/copper terminal oxidase that exploits cytochrome c as an electron donor. Complex
IV inhibitors have also been categorised into four distinct groups: (A) heme-binding inhibitors that are non-competitive with both oxygen and cytochrome c (e.g. azide, cyanide and sulphide), (B) inhibitors competitive with oxygen (e.g. carbon monoxide and nitric oxide) that are reversible, (C) inhibitors which are competitive with cytochrome c (e.g. polycations) and (D) non-competitive inhibitors which do not affect the heme-groups (e.g. phosphate ions and alkaline pH) [20].
Complex V (ATP-synthase) uses the electrochemical proton gradient to synthesise ATP from ADP and
inorganic phosphate. The enzyme is able to operate in either direction, for example under some conditions it can work as an ATPase to hydrolyse ATP and generate the proton gradient. ATP synthase is well conserved evolutionarily and as such many of its known inhibitors are of natural origin (mostly fungal).
16
Many antibiotics/mycotoxins were isolated because of their selective and potent toxicity against other fungi (e.g. aurovertins A, leucionstatins A+B and the classical inhibitors of mitochondrial ATP-synthase, oligomycin A-D). Injection of the ATP-synthase inhibitor oligomycin into rats causes inhibition of oxygen consumption, and severe lactic acidosis with little to no change in arterial blood oxygen levels. These mycotoxins all bind to either the F1 or the F0 subunit of the enzyme to block proton conduction.
The acute 50% lethal dose (LD50) values from both IP and subcutaneous injection are in the region of
1-10mg/kg in rats and mice [58, 59]. Other compounds and classes of compounds have shown acute inhibitory activity against mitochondrial ATP-synthase, though with less potency than the mycotoxins described above. These include, local anaesthetics [60], paraquat [61], the β-adrenergic receptor antagonist propranolol [62] and organotin composites [63].
Examples of drugs that inhibit the mitochondrial respiratory chain (either via direct ETC complex inhibition or mitochondrial uncoupling) are shown in Fig.1.4 below.
17 FIGURE 1.4: Schematic representation of drugs which have been implicated in inhibition of OXPHOS either via direct inhibition of respiratory chain complexes I-IV or via chemical uncoupling. Image taken and modified from
[http://watcut.uwaterloo.ca/webnotes/Metabolism/rchainOverview.html] – Accessed 29th May 2015.
Uncoupling of OXPHOS is considered to be a common characteristic of anti-inflammatory agents with
an ionisable group such as the non-steroidal anti-inflammatory drugs (NSAIDs) diclofenac, aspirin, nimesulide and indomethancin. All of these drugs, despite being taken routinely across the world, exert an uncoupling effect at concentrations corresponding to their pharmacological doses [64, 65]. In their review written in 2000, Wallace & Starkov suggest that the term uncoupling should encompass any energy-dissipating process which competes for energy with routine mitochondrial functions, and thus induces a metabolically futile wasting of energy. They explain that this description encompasses any drug-induced enhancement of any energy-consuming mitochondrial function (such as ion, metabolite or protein transport) as well as the classic idea of uncouplers (the dissipation of the proton gradient and impact on ATP production) [20]. Typically uncouplers of OXPHOS provoke a loss of mitochondrial ΔΨ, a
Aurovertin A leucionstatins A+B Oligomycin A-D Tamoxifen Lidocaine Paraquat Propranolol Azide Cyanide Sulphide Carbon monoxide Nitric oxide Myxothiazol Strobilurins Oudemasins UHDBT Funiculosin Antimycin A Zinc ions Malonate 3-nitroproprionic acid Diazoxide Chloramphenicol Rhein Flutamide Myxothiazol Aurachins Rotenone Rolliniastatin-1 Phenformin/Metformin FCCP/CCCP 2,4-DNP NSAIDS e.g. Diclofenac
Gramicidin Valinomycin FFA Tolcapone Phenols/Amides H+ H+ Uncoupling of OXPHOS
18
reduction in mitochondrial ATP production, increased levels of substrate oxidation and increased heat production. Uncouplers can be broadly categorised into the following:
Lipophilic weak acids – The majority of compounds processing protonophoric activity are lipophilic weak acids with an acid-dissociable group and strong electron withdrawing moieties. Examples of uncouplers in this group include carbonyl cyanide phenylhydrazones and salicylanilides. Compounds such as carbonyl cyanide p-triflouromethoxy-phenyl-hydrazone (FCCP) and cyanide meta-chlorophenylhydrazone (CCCP) are possibly the most frequently used uncouplers in the laboratory. In mice, FCCP and CCP induce rapid rigor mortis and death after IP injection with LD50 values of 32
and 40µmol/kg respectively.
Substituted phenols – The best represented and most studied class of uncouplers are the substituted phenols, including the highly toxic 2,4-dinitrophenol (2,4-DNP). Used in the 1930’s as a weight loss drug, numerous 2,4-DNP-associated side effects were recognised and it was eventually withdrawn from the market [5]. Although not licensed as a drug, 2,4-DNP is still occasionally used as a fat burning agent to this day, and numerous fatalities per year are still attributed to dinitrophenol poisoning [66], with signs and symptoms including hyperthermia, malaise, dyspnea, respiratory failure and ultimately death. Its potency is highlighted by an LD50 of just 141µmol/kg in mice [67].
SAR studies have confirmed that substituted phenols uncouple via the protonophoric mode of action (MOA), and revealed important correlations between the uncoupling activity and physicochemical properties such as hydrophobicity, acidity and lipid membrane stability [68].
Salicylanilide (2-hydroxy-N-phenylbenamide) derivatives – The salicylanilides have been widely used as anticestodal, antinematodal and antihelminithic drugs despite being protonophoric uncouplers of mitochondrial OXPHOS. The mechanism of uncoupling is similar to that of other A- protonophores.
SAR relationships with 28 salicylanilide derivatives revealed that both hydrophobicity and electron-withdrawing potential were required for uncoupling to take place [67].
Free fatty acids (FFAs, both endogenous and exogenous) – FFAs have long been known to be efficient uncouplers of mitochondrial OXHOS. Studies have shown that the adenine nucleotide translocator (ANT) is involved in the uncoupling action of FFAs. Many pathologies are associated with the accumulation of free long-chain FA’s in affected tissues and the effect of this accumulation
19
on mitochondrial function can be devastating, rapidly increasing local temperature generation and oxygen consumption at the expense of substrates for oxidation.
Ionophores – Ionophores are compounds of various chemical structures that are capable of transporting small ions across a lipid membrane. Ionophores have been reviewed in [69, 70] and generally are sub-categorised based on their physicochemical properties or their mechanism of ion transport. Channel-type ionophores (e.g. gramicidin A, D and S) are generally short amphiphilic peptides that form channels in lipid membranes. These channels can be selective toward small ions such as protons or K+ depending on the peptide, the membrane structure and conditions. The resulting
increase in permeability toward protons and K+ effectively collapses the ΔΨ in mitochondria, due
either to proton cycling or electrophoretic K+ transport. Carrier type ionophores (e.g. valinomycin and
nigericin) are able to form neutral or charged lipid soluble complexes with an ion to facilitate its electrophoretic transport or electroneutral exchange with protons across the IMM. Furthermore, calcimycin can form a lipid-soluble complex with Me2+ to transport divalent cations across lipid
membranes by means of electroneural Me2+/2H+ exchange. Dissipation of the calcium gradient
establishes a futile energy-dissipating cyclic flux of calcium.
Cationic uncouplers (e.g. the cyanine dye triS-C4(5)) – This category of OXPHOS uncouplers comprises compounds that uncouple mitochondria by increasing membrane permeability to ions [71]. The mechanism of toxicity requires the presence of inorganic phosphate and it is likely that the Pi-dependent compounds affect the physical integrity of the mitochondrial membranes.
Alternate electron acceptors – These compounds greatly diminish the efficiency of energy conversion by disrupting the prescribed pathway of electrons down the ETC and as a result increase the oxidation of substrates and divert excess energy to wasteful heat production. Terminal electron acceptors (those which are capable of being reduced by an electron carrier of the ETC) intercept electrons from the ETC and participate in futile redox cycling, whereby the compound is reduced at the expense of energy derived from substrates. Alternate electron acceptors (or electron-shunts), such as adriamycin, paraquat and a number of naphthoquinones, accept electrons and then feed them back to the respiratory chain at higher redox potential. This allows electrons to bypass a portion of the ETC excluding it from energy generation. Typically the secondary electron acceptor that completes the redox cycle is a terminal complex of the ETC and not molecular oxygen. A classic example of an