Take the steps...
Transportation Research Research...Knowledge...In
novative Solutions!
Best-Value Based on Performance
Technical Report Documentation Page
1. Report No. 2. 3. Recipients Accession No.
MN/RC 2008-40
4. Title and Subtitle 5. Report Date
September 2008
6.
Best-Value Based on Performance
7. Author(s) 8. Performing Organization Report No.
Magdy Abdelrahman, Ph.D., Ahmed El-Yamany, and
Scott Schram
9. Performing Organization Name and Address 10. Project/Task/Work Unit No.
11. Contract (C) or Grant (G) No.
Department of Civil Engineering North Dakota State University CIE 201
Fargo, North Dakota 58105 (c) 88127
12. Sponsoring Organization Name and Address 13. Type of Report and Period Covered
Final Report
14. Sponsoring Agency Code
Minnesota Department of Transportation 395 John Ireland Boulevard, Mail Stop 330
St. Paul, Minnesota 55155
15. Supplementary Notes
http://www.lrrb.org/PDF/200840.pdf
16. Abstract (Limit: 200 words)
The Best-Value procurement strategy is gaining interest from federal and state agencies. The strategy increases the value added to the project for each dollar added. This report discusses a new concept of Best-Value, that is; a rational and flexible model based on expected performance. The model flexibility is obvious in the selection of parameters, to be included in the contractor selection process, and in the determination of the parameter’s weights. The model rationality will be achieved through relating all awarded score to the agency’s expected performance. The establishment of the Best-Value model calls the past record of the contractor work for the agency as an indicator of qualification trend. Contractor Best-Value will be the base in selecting the most appropriate contractor that has the best qualifications for a given project. Data are collected from groups of experts in the Minnesota Department of Transportation and processed through the analytic hierarchy process (AHP) to establish the parameter weights. While this research assists DOTs in selecting the best contractor, the shared results are relevant to both academics and practitioners. A computer software “MnCAST” has been developed to help implementing the developed Best-Value system.
17. Document Analysis/Descriptors 18. Availability Statement
Best-Value, Contractor Selection Process, Expected Performance, Parameter Score,
Analytical Hierarchy Process, Project Specific Model
No restrictions. Document available from: National Technical Information Services, Springfield, Virginia 22161
19. Security Class (this report) 20. Security Class (this page) 21. No. of Pages
113 22. Price
Best-Value Based on Performance
Final Report
Prepared by: Magdy Abelrahman, Ph.D. Ahmed Elyamany Scott SchramDepartment of Civil Engineering North Dakota State University
September 2008
Published by:
Minnesota Department of Transportation Research Services Section
395 John Ireland Boulevard, MS 330 St. Paul, Minnesota 55155-1899
This report represents the results of research conducted by the authors and does not necessarily represent the views or policies of the Minnesota Department of Transportation and/or the Center for Transportation Studies. This report does not contain a standard or specified technique.
ACKNOWLEDGEMENTS
The author would like to acknowledge the support of Mn/DOT for the funding of this research. Thanks for Jay Heitpas and Mike Leegard from Mn/DOT contract office for steering the research work. Recognition is also for J.T. Anderson for providing the data used in this research and the involvement in the discussion about selecting the model parameters. Appreciation is also to Mn/DOT officials who enrich the research team knowledge with their field experience. Naming a few, are, Tom Ravn, Joel Williams, Paul Stembler, Dan Kuhn, and Jeff Perkins. Special acknowledgement is to Mr Gary Thompson for his technical support during his time with Mn/DOT.
TABLE OF CONTENTS
1. INTRODUCTION... 1 1.1BACKGROUND... 1 1.2OBJECTIVES... 1 1.3SYSTEM FLEXIBILITY... 1 1.4IMPLEMENTATION... 2 1.5REPORT ORGANIZATION... 22. CURRENT PRACTICE OF BEST-VALUE... 3
2.1OVERVIEW... 3
2.2THE BEST-VALUE SYSTEM... 4
2.2.1 Definition ... 4
2.2.2 Best-Value Concept 1 (Parameters) ... 7
2.2.3 Best-Value Concept 2 (Evaluation Criteria)... 8
2.2.4 Best-Value Concept 3 (Evaluation Rating System)... 10
2.2.5 Best-Value Concept 4 (Award Algorithm) ... 10
3. DATA COLLECTION ... 12
3.1DATA SOURCES... 12
3.2BEST-VALUE REPORTS... 12
3.3MN/DOTDATA... 12
3.3.1 Innovative Contracting Methods... 12
3.3.2 Mn/DOT Questionnaire ... 14
3.3.3 Questionnaire Summary... 14
3.3.4 Mn/DOT Engineers Meeting... 15
3.4OTHER BEST-VALUE SOURCES... 15
4. MODEL DEVELOPMENT ... 16
4.1MODEL CONCEPTS... 16
4.1.1 Contractor Parameter Scores... 16
4.1.2 Parameter Weights ... 16
4.1.3 Model Parameters ... 16
4.2MODEL EVALUATION... 17
4.2.1 TH-113 Project ... 17
4.2.2 TH-494 Project ... 17
4.2.3 Model Implementation Methodology ... 17
4.2.4 Calculations of Model Weight (Wi)... 20
4.2.5 Calculations of Best-Value Model ... 21
5. SOFTWARE DEVELOPMENT ... 25
5.1INTRODUCTION... 25
5.2BEST-VALUE EQUATION... 25
5.2.1 Best-Value Parameters’ Equations ... 25
5.2.2 Calculating Parameter Scale... 26
5.2.3 Calculating Parameters Weight: ... 27
5.3THE MNCAST SOFTWARE... 27
5.3.1 Best-Value Example ... 27
5.3.2 Example Solution:... 29
6. MODEL VALIDATION ... 35
6.1INTRODUCTION... 35
6.2BEST-VALUE BASED ON EXPECTED PERFORMANCE... 35
6.3PART-1 OF SENSITIVITY ANALYSIS... 36
6.3.1 The Best-Value Model... 37
6.3.2 Parameters Weight (Wi) ... 38
6.3.3 Best-Value Parameters ... 39
6.3.4 Best-Value Determination... 39
6.3.5 Modeling Best-Value Parameters ... 40
6.3.6 Parameters Score (Si) ... 40
6.3.7 Data Collection and Case Studies ... 43
6.3.8 Model Implementation ... 43
6.3.9 Sensitivity of the Best-Value Index... 45
6.4PART-2 OF SENSITIVITY ANALYSIS... 48
6.4.1 Effect of Changing the Number of Data Record on Best-Value ... 52
6.4.2 Effect of Changing the Included Work Types on Best-Value... 53
6.4.3 Effect of Changing the Included Districts on Best-Value... 54
6.4.4 Effect of Changing Bid Price/Performance Parameters Weight Ratio on Best-Value...55
6.4.5 Effect of Changing the 0 References Point for Bid Price on Best-Value... 56
6.4.6 Effect of Changing the 0 References Point for Performance Parameters on Best-Value... 57
7. SUMMARY AND CONCLUSIONS ... 59
7.1SUMMARY... 59
7.2SUMMARY OF PART-1 ... 59
7.3SUMMARY OF PART-2 ... 60
8. REFERENCES... 61
APPENDIX A MN/DOT RESIDENT ENGINEER QUESTIONNAIRE
APPENDIX C MNCAST MANUAL
LIST OF TABLES
Table 2.1 Evaluation Criteria [1] ... 6
Table 3.1 Total Collected Best-Value Parameters... 13
Table 3.2 Initially Selected Parameters for Best-Value Model ... 15
Table 4.1 Row Values of Model Parameters for Both Pilot Projects ... 20
Table 4.2 Relative Weight Calculations for Project TH-113... 22
Table 4.3 Relative Weights for Projects TH-113 and TH-494 ... 22
Table 4.4 Best-Value Calculation for Project TH-113 ... 22
Table 4.5 Best-Value for Projects TH-113 and TH-494 within the Two Cases ... 23
Table 4.6 Trade-off Analyses for Projects TH-113 and TH-494 within the Two Cases... 24
Table 6.1 Parameters of Best-Value and Their URL and LRL... 38
Table 6.2 Weights of Parameters Corresponding to Various Bid Price Weights (TH-494)... 44
Table 6.3 Samples of Sensitivity Analysis Results for Selected Cases ... 46
Table 6.4 Sensitivity Analysis for Decision Selection... 48
Table 6.5 MNCAST Inputs* for Different Contractors... 49
Table 6.6 Matrix of MNCAST Settings... 50
Table 6.7 Sensitivity Analysis Cases ... 51
Table 6.8 Results of Sensitivity Analysis Cases... 52 Table B-1 Percentage Engineers Satisfaction for Question one ... B-1 Table B-2 Percentage Engineers Satisfaction for Question Two... B-1 Table B-3 Percentage Engineers Satisfaction for Contractor Qualification Parameters ... B-2 Table B-4 Percentage Engineers Satisfaction for Contractor Experience Parameters ... B-2 Table B-5 Percentage Engineers Satisfaction for Project Performance Parameters... B-2 Table B-6 Percentage Engineers Satisfaction for Project Quality Parameters ... B-2 Table B-7 Percentage Engineers Satisfaction for Financial Situation Parameters... B-2 Table B-8 Percentage Engineers Satisfaction for Subcontractor Parameters... B-3 Table B-9 Data Sources as Suggested by Resident Engineers... B-3
LIST OF FIGURES
Figure 2.1 Best-Value Procurement Process [1]... 5
Figure 2.2 Best-Value Evaluation Rating Systems [1] ... 6
Figure 2.3 Best-Value Award Algorithms [1] ... 7
Figure 4.1 Relation between Rough Values of Parameter and Parameter Score... 19
Figure 4.2 Part-2 of Mn/DOT Questionnaire... 19
Figure 4.3 Part-1 of Mn/DOT Questionnaire Evaluation Parameters Importance Questionnaire ... 21
Figure 5.1 Calculating Parameter Scale for Corresponding Parameter’s Value... 26
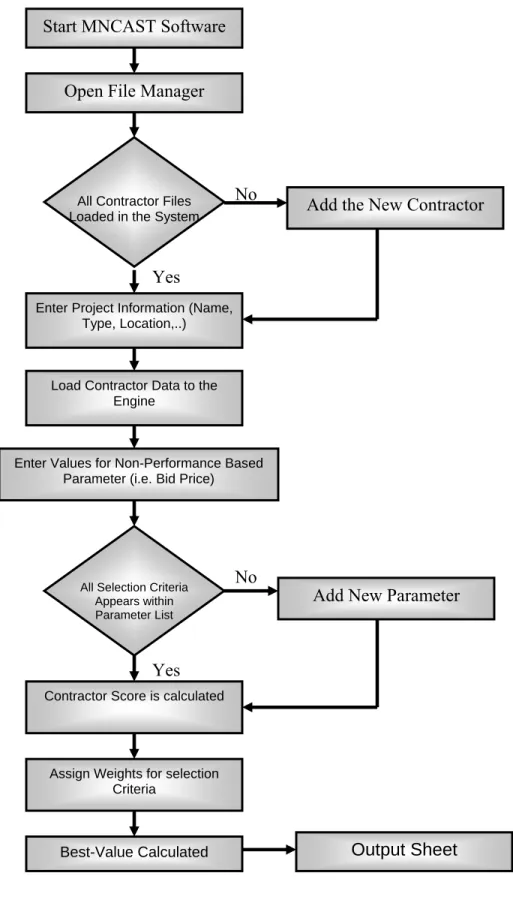
Figure 5.2 Procedures Used in Best-Value Calculation... 28
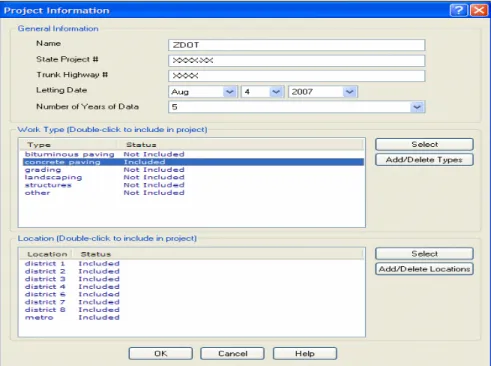
Figure 5.3 Entering Project Information... 29
Figure 5.4 Setting the Direction for Project Parameter... 30
Figure 5.5 Selecting Quality Tests Used in the Current Project... 30
Figure 5.6 Selecting form Output Options... 31
Figure 5.7 Setting the Comparison Option for the Project ... 31
Figure 5.8 Selecting Bidding Contractors and Entering Corresponding Offers ... 32
Figure 5.9 Selecting Project Parameters ... 33
Figure 5.10 Display of Results... 34
Figure 6.1 Research Methodologies ... 42
Figure 6.2 Score of Normalized Scale for Various Parameters; (a) Descending slope and (b) Ascending slope ... 43
Figure 6.3 Lower reference limit (LRL) values; (a) LRL = 50% for all parameters, (b) LRL = 70% for all parameters, and (c) LRL = 90% for all parameters...47
Figure 6.4 The Effect of Changing Data Record on Best-Value Results ... 53
Figure 6.5 The Effect of Changing the Included Work Types on Best-Value Results... 54
Figure 6.6 The Effect of Changing the Included Districts on Best-Value Results ... 55
Figure 6.7 The Effect of Changing Bid Price/Performance Parameters Weight Ratio on Best-Value Results... 56
Figure 6.8 The Effect of Changing 0 References Point for Bid Price on Best-Value Results... 57
Figure 6.9 The Effect of Changing 0 References Point for Performance Parameters on Best-Value Results... 58 Figure C-1 Project Information Window... C-4 Figure C-2 Edit Types Window... C-5 Figure C-3 Edit Location Window ... C-5 Figure C-4 Parameter Settings in Options Window ... C-6 Figure C-5 Project Location Code Settings in Option Window ... C-7 Figure C-6 Project Type Code Settings in Option Window ... C-7 Figure C-7 Quality Settings in Option Window ... C-8 Figure C-8 Output Settings in Option Window ... C-8 Figure C-9 Comparison Options Window ... C-9 Figure C-10 Select Contractors Window... C-11 Figure C-11 New Contractor Window... C-11 Figure C-12 Select Parameters Window... C-12 Figure C-13 New Parameter Window... C-13 Figure C-14 Summary of Results in Best-Value Results Window... C-14
Figure C-15 Details of Results in Best-Value Results Window ... C-15 Figure C-16 Input Data in Best-Value Results Window ... C-16
EXECUTIVE SUMMARY
Introduction
The term Best-Value has many competing definitions in the industry. One of the suggested broad definitions of Best-Value is “A procurement process where price and other key factors are considered in the evaluation and selection process to enhance the long-term performance and value of construction” [1]. The Best-Value (BV) procurement allows contracting agencies to evaluate offers based on total costs, technical solutions, completion dates, and other criteria to enhance the long term performance of projects. The Best-Value system is viewed as a balance between Fixed-Price Sealed Bidding and Sole Source Selection, or between price and qualification considerations. A key concept in Best-Value procurements is the focus on selecting the contractor with the offer ‘‘most advantageous to the government where price and other factors are considered.’’ The factors other than price can vary, but they typically include technical and managerial merits, financial health, and past performance [5, 6, 7, and 8]. Another key element in the success of innovative contracting techniques, including Best-Value, is the communication between owners and contractors in two main areas: (i) the rationality in ranking the contractor qualification and (ii) defining the owner expectations. Owners must think carefully of what is ‘‘valuable’’ in the product and not just ‘‘important’’ or ‘‘required’’ in the selection process. Using technical, managerial, or performance elements that are of indeterminate value, while important or required, simply clouds the decision. Owners should only base the Best-Value selection criteria on project elements that add measurable value to the project [9]. It is also important that owners set standards for the procurement process. Owners must carefully define what is expected and communicate that with contractors. An earlier research [10] shows agencies pre-qualify contractors using subjective values that may not follow a rational approach. A group of evaluators rate the contractor expected performance on several key areas such as staff, experience, project approach, schedule, and innovation. Using subjective equations or rules introduces a different form of bias to the procurement process. Research indicates that most agencies do not define the expected level of contractor performance in low-bid procurement systems. The contractor is only required to secure the necessary bonds before submitting a bid. The pre-qualification process is different because the contractor past performance has nothing to do with getting the next job, unless debarred. Even if a contractor fails miserably on an area, such as quality on one project, the contractor is able to bid the next project [11].
Study Objectives
The objective of this report is to develop a procurement system using the Best-Value concept. Best-Value system is driven by the expected performance of the contractor. To be practical, the procurement system is flexible in choosing the selection criteria for each project according to its needs. The Best-Value system allows the engineers to set the priorities of the selection criteria by using the Analytical Hierarchy Process.
Study Significance
The presented research improves the bid selection process in Minnesota. Mn/DOT will be in a better position to make the decision of moving from contractor selection solely based on minimum qualifications and low bids to a new system; “Best-Value Based on Performance.” The new system will reward contractors for quality of their work, for public safety, for compliance with the contract requirements, the business and employment requirements and the environmental requirements and for coordination with other elements of the construction
process. Rewarding contractors for their quality work will eventually improve the quality of pavement facilities. The benefits of this research are expected in addressing issues related to the pre-qualification mechanism and the contractor rating systems of Mn/DOT.
Best-Value Model
The parameters and evaluation criteria of Best-Value are first determined from the literature, survey, case studies, and meetings [12]. Based on previous application of Best-Value model within DOTs, it is suggested that evaluation criteria should be less in number and easy to obtain from project records. The research team discussed the possibility and validity of each evaluation criteria, included in the initial list, to be considered in the conceptual model. This process ends with a list of the evaluation criteria and suggested measurement factors. Two facts are kept in mind: the less evaluation criteria a Best-Value model has, the easier it is to deal with, and the probable lack of familiarity of DOT officials and contractors with Best-Value environment requires the need to get involved in the new concept slowly.
The first parameter selected to be included in the model is bid price (BP). This parameter was the most important parameter in selecting contractors using the traditional procurement system. For public agencies, lowest bid selection is enforced by law even if there is no need. Contract time (CT) is used as a competitive parameter in contracts that require a fast track. This parameter represents the “B” part in the A+B bidding process which yield from contract time multiplied by road-user-cost. The next parameter is Lane Rental (LR) which reflects the impact of construction activities on the road users’ time and money. Lane Rental (LR) is equal to the percentage of lane closure cost divided by the total bid amount. Past quality (PQ) parameter shows the quality of final product where it is evaluated by the percentage of rejected test specimens divided by the total test specimens.
The general equation for the Best-Value is shown below:
∑
= × = n i i i j CPS W BV 1Where; BVj= Best-Value for contractor j, n = number of parameters included in the Best-Value equation, CPSi = Contractor Parameter i Score, Wi= Relative weight of parameter i
The parameters used to evaluate contractors are scored relatively to each other. The contractor with the best parameter value will be the reference for others with worst values. Parameter weights (summed to 1.0) capture the relative importance of each parameter in the selection process according to the owner’s priorities. The weights are assigned to the parameters with the use of the engineering opinion about the importance of the parameters relative to each others. The MNCAST Software
The software named “MNCAST” was developed as part of this research to facilitate the implementation of the proposed system in real life situations. The contractor past performance will be used in the software to derive a score for each contractor based on his expected performance. The engineers’ input to the software determines the weights of the selection criteria through a questionnaire. This research presents a tool to select the performing contractor rather than selecting based solely on the lowest bid. The proposed system was implemented on two pilot projects form Mn/DOT. The MNCAST software consists of three parts: the input (input
menus), the engine, and the output (output menus). The input includes but is not limited to; project name, type, location, years to be considered from past contractor history, contractor data, parameter’s score, and weight. The output includes contractor scores and Best-Value details. Study Findings
Previous attempts to implement Best-Value contracting did not consider the unique characteristics of each construction project. The current Best-Value model, unlike previous models, considers each project as unique. The aim was to establish a flexible model capable of being tailored to certain project needs. The inclusion and exclusion of parameters and different weights give owners flexibility. Historical records of contractor performance act as inputs to the Best-Value system. These records are an indication of the contractor’s qualification trend. The model rationality is achieved through relating all awarded scores to the agency’s expected performance. The establishment of the Best-Value model uses the past record of the contractor work for the agency as an indicator of the contractor’s qualification trend. This research incorporates pre-qualification as a first level screening technique in selecting top contractor bids in Best-Value procurement and then applies a rational scoring system in the final selection. Data are collected from groups of experts in the Minnesota Department of Transportation and processed through the analytic hierarchy process (AHP) to establish the parameter weights. A sensitivity analysis is conducted to verify the model scale and calculation methods. The analysis shows reasonable differences in the parameter scores reflecting the differences in the contractor qualifications.
The sensitivity analysis clearly shows that a better selection would be more reliable and significant if the following condition occurs:
• More data records are used for the contractors such as data record for work done in other districts.
• The implementation of the Best-value system would start with a higher weight assigned to bid price, between 80-90% of the total weight, at which the selection will depend on the lowest bidder and considering other performance parameters. The opposite case would be for the weight of bid price ranges between 20-30% of the total weight leaving a higher weight value of 70-80% for the performance parameters at which the selection will be based heavily on the contractor with better performance. Reliable documentation of the contractor performance is necessary in this case.
• “0-reference limit” for bid price set as equal to max. Bid. Part-1 of this report discusses an alternative of setting a lower-reference-limit and the use of prescreening steps.
• The use of “0-reference limit” for performance parameters as equal to a specific percentile, the 60th to the 75th percentile of the contractor’s population in this case, is arbitrary and depends on available records to support the selected value.
1
1. INTRODUCTION
1.1 Background
The Best-Value procurement strategy is gaining interest from federal and state agencies. The term Best-Value has many competing definitions in the industry. One of the suggested broad definitions of Best-Value is “A procurement process where price and other key factors are considered in the evaluation and selection process to enhance the long-term performance and value of construction” (1). This definition was disaggregated into four primary concepts: parameters, evaluation criteria, rating systems, and award algorithms. Based on the analysis of the literature, meetings, and case studies, it is determined that a Best-Value procurement, which is simple to implement and flexible in the selection of parameters and award algorithms, is the most effective approach in the context of a traditional bidding system.
The Best-Value procurement allows contracting agencies to evaluate offers based on total costs, technical solutions, completion dates, and other criteria to enhance the long term performance of projects. When used correctly, the strategy obtains the optimum combination of price and technical solution for the public and rewards those who propose innovative concepts that enhance product quality or lower the price of quality. The inclusion of key parameters or evaluation factors, such as construction quality record, that match specific needs of a project guarantees the selection of the best contractor for a specific project. Merely, this happens when the agency adopting the system realizes the need, in each project, to use the Best-Value system as a unique case. The Best-Value system is viewed as a balance between Fixed-Price Sealed Bidding and Sole Source Selection, or between price and qualification considerations. The findings of NCHRP 10-61 research study show a trend in the construction public sector towards the increased use of various Best-Value procurement methods and a long-standing concern expressed by public owners [1]. However, low-bid procurement system, while promoting competition and a fair playing field, may not result in the Best-Value for dollars expended or the best performance during construction.
1.2 Objectives
This report outlines the basic aspects related to the implementation of Best-Value procurement with an emphasis on required data elements in the Department of Transportation (Mn/DOT). The main objective is to develop a system that is driven by the “Best-Value based on performance” concept and considering flexible set of bid selection criteria to evaluate the current contracting procedures by Mn/DOT. The presented information outlines data collection activities from Mn/DOT records required for the completion of this project.
1.3 System Flexibility
This research demonstrates few possibilities with the implementation of the proposed Best-Value system. The system incorporates pre-qualification as a first level screening technique in selecting top contractor bids in Best-Value procurement and then applies a rational scoring system in the final selection. Data are collected from groups of experts in the Minnesota Department of Transportation and processed through the analytic hierarchy process (AHP) to establish the parameter weights. A sensitivity analysis is conducted to verify the model scale and calculation methods. The analysis shows reasonable differences in the parameter scores reflecting the differences in the contractor qualifications.
2 1.4 Implementation
The presented research improves the bid selection process in Minnesota. Mn/DOT will be in a better position to make the decision of moving from contractor selection solely based on minimum qualifications and low bids to a new system; “Best-Value Based on Performance.” The new system will reward contractors for quality of their work, for public safety, for compliance with the contract requirements, the business and employment requirements and the environmental requirements and for coordination with other elements of the construction process. Rewarding contractors for their quality work will eventually improve the quality of pavement facilities. The benefits of this research are expected in addressing issues related to the pre-qualification mechanism and the contractor rating systems of Mn/DOT. Pilot projects are used during model implementation to clarify the impact of the Best-Value system in the contractor selection process. Results of model implementation shows the significant turnover from the lowest bid strategy to the choice of the best contractor based on past contractor performance. The maximum value of Best-Value for pilot projects has gone to a contractor other than the lowest bidder. This happens as an impact of including parameters more than just the lowest bid.
1.5 Report Organization
Chapter 2 presents an overview of the literature review, with primary emphasis placed on the concept of Best-Value and its components.
Chapter 3 discusses the sources that have been used to collect the data for the model development.
Chapter 4 presents the model development steps and the analysis of results of two pilot projects. The pilot project highlights the effectiveness of the model in solving the problem under investigation.
Chapter 5 presents the development of MNCAST Software with some discussion of how the software could be used in selecting the best contractor.
Chapter 6 includes the sensitivity analysis of the model parameter and the sensitivity analysis of the results obtained from MNCAST.
3
2. CURRENT PRACTICE OF BEST-VALUE
2.1 Overview
Literature indicates that low-bid procurement system encourages contractors to implement cost-cutting measures instead of quality enhancing measures and therefore makes it less likely that contracts will be awarded to the best-performing contractors who will deliver the highest quality projects [1]. However, State and Federal Sectors, have moved aggressively towards the use of Best-Value procurement, have attempted to measure its relative success, and are convinced that it achieves better results than low-bid due to the following reasons: (i) the low-bid method fails to serve the public interest because the lowest offer may not result in the lowest overall cost to the public, (ii) the Best-Value procurement provides a reduction in cost growth from 5.7% to 2.5% and a reduction in claims and litigation by 86%, (iii) a 1997 National Science Foundation study concluded that design-build contracts procured using the two-step Best-Value procurement procedure had the best cost and schedule growth performance, albeit representing a very small average improvement over the other procurement methods and (iv) the Best-Value procurement was emerging as a viable alternative to traditional low-bid method in the public sector construction [1, 2, 3 and 4].
A key concept in Best-Value procurements is the focus on selecting the contractor with the offer ‘‘most advantageous to the government where price and other factors are considered.’’ The factors other than price can vary, but they typically include technical and managerial merits, financial health, and past performance [5, 6, 7, and 8]. Another key element in the success of innovative contracting techniques, including Best-Value, is the communication between owners and contractors in two main areas: (i) the rationality in ranking the contractor qualification and (ii) defining the owner expectations. Owners must think carefully of what is ‘‘valuable’’ in the product and not just ‘‘important’’ or ‘‘required’’ in the selection process. Using technical, managerial, or performance elements that are of indeterminate value, while important or required, simply clouds the decision. Owners should only base the Best-Value selection criteria on project elements that add measurable value to the project [9]. It is also important that owners set standards for the procurement process. Owners must carefully define what is expected and communicate that with contractors. An earlier research [10] shows agencies pre-qualify contractors using subjective values that may not follow a rational approach. A group of evaluators rate the contractor expected performance on several key areas such as staff, experience, project approach, schedule, and innovation. Using subjective equations or rules introduces a different form of bias to the procurement process. Research indicates that most agencies do not define the expected level of contractor performance in low-bid procurement systems. The contractor is only required to secure the necessary bonds before submitting a bid. The pre-qualification process is different because the contractor past performance has nothing to do with getting the next job, unless debarred. Even if a contractor fails miserably on an area, such as quality on one project, the contractor is able to bid the next project [11].
Legislation at the federal, state, and local levels is moving towards allowing the use of Best-Value procurement strategies, which include price and other factors deemed to be in the best interest of the agency. Best-Value procurement offers:
• Reduction in cost growth
4
• Time-savings
• Innovation
• Higher quality construction
• Reduced procurement risk
Viewed as a balance between Fixed-Price Sealed Bidding and Sole Source Selection, Best-Value systems mold qualifications into the decision making process. Literature on the Best-Value focuses on three main aspects: industry trends, procurement methods, and implementation. Traditional industry practice includes negotiated procurements in the private sector, contracting by negotiation, and the ABA model, which considers objective, measurable criteria such as life-cycle-cost. Today, Best-Value is a topic of interest in various legislative sessions [1]. Colorado recently revised statutes that allow “competitive sealed best-value bidding”, while the Minnesota DOT sponsored a case study of Best-Value (State Project 2735-172). In the case of the Mn/DOT study, proposals were neither scored nor ranked, but evaluated for responsiveness to technical criteria. Interest in Best-Value even extends as far as California, where a Los Angeles City Charter provision allowed Best-Value to be included into the selection process. Federal agencies such as the Army and Navy also recognize the benefits of the Best-Value system. The Federal Acquisitions Regulation (FAR) includes commentary regarding the shortcoming of the low-bid method in serving the public interest [2]. A Navy study shows reduced claims and cost growth as advantages of Best-Value procurement over traditional methods [3]. A 1997 National Science Foundation study concluded that design-build projects using the Best-Value system had superior cost and schedule performance compared to other methods. For many years the Federal Highway Administration (FHWA) allowed alternative procurements using Best-Value concepts embedded in trial or experimental contracting methods for selected highway projects. NCHRP 10-61 reports 27 US transportation agencies had experience with Best-Value procurement. The study recommends basic implementation strategies that address legislative guidelines, model specifications, industry collaboration, and pilot projects[1].
2.2 The Best-Value System
NCHRP 10-61 [1]evaluated over 50 case studies from all sectors of construction to identify and categorize best-value concepts used in the public sector construction industry. Agencies included the US Army Corps of Engineers, US Air Force, National Aeronautics and Space Association, Spanish Road Administration, Swedish Highway Administration, US Forest Service, and a number of US Departments of Transportation. While the majority of these case studies involved design-bid-build projects, some included design-build projects.
2.2.1 Definition
Best-Value can be defined as a procurement process that considers price and other key factors in the evaluation and selection process to enhance the long-term performance and value of construction.
The following is an appropriate equation for the Best-Value [1]:
Best-Value* = A.x + B.x + P.x + Q.x + D.x (2.1)
5 x = weight
A = Cost B = Time
P = Performance & Qualifications Q = Quality Management
D = Design Alternates
The Best-Value definition can be dissected into four primary components used to describe its nature. These primary concepts are as follows:
• Parameters
• Evaluation criteria
• Rating systems
• Award algorithms
The system is graphically depicted as shown below.
Figure 2.1 Best-Value Procurement Process [1]
Table 2.1 and Figures 2.2 and 2.3 present the components of the Best-Value procurement. More details are presented later in the report.
6
Table 2.1 Evaluation Criteria [1]
7
Figure 2.3 Best-Value Award Algorithms [1]
2.2.2 Best-Value Concept 1 (Parameters)
Literature shows selection strategy, selection criteria, model form, parameter weights, and other technical factors varied significantly. The common consensus among case studies, surveys, and interview results, shows Best-Value procurement as a flexible, multi-parameter system where project priorities drive parameter selection. Best-Value parameters are presented:
2.2.2.1 Cost
Best-Value cost parameters generally fall into two categories: • A.0= Initial capital costs of construction
• A.1= Life-Cycle Costs incurred after construction is complete. Life-cycle cost has the main advantage of permitting the owner to compare the long-term advantages of competing proposals using an engineering economic analysis.
2.2.2.2 Time
Including time in the Best-Value model allows the contractor to establish a schedule that compliments the construction plan.
• B.0= Time • B.1= Lane Rental • B.2= Traffic Control
In this case, both lane rental and traffic control systems permit the owner to communicate the need to minimize a project’s impact on the traveling public during construction. These parameters create an incentive toward innovative management of congestion in work zones reducing detour time by rewarding proposals that minimize construction impacts on traffic.
8 2.2.2.3 Performance & Qualifications
Qualification parameters allow the owner to obtain some of the benefits from the historically accepted practice of the Brooks Act; Qualifications-Based Selection (QBS) used for procurement of design profession contracts.
•P.0= Prequalification
•P.1= Past Project Performance
•P.2= Personnel Experience
•P.3= Subcontractors Information
•P.4= Project Management Plans 2.2.2.4 Quality Management
The ability to review a contractor’s quality management plan before the contract is awarded is a primary advantage of quality parameters. Doing so has the potential to change the whole dynamic of quality management from an adversarial, compliance-based system to a competitive, award-to-the-best-plan system. Coupled with some form of warranty or performance-based acceptance indicator, these parameters create a system aimed toward delivering quality. Some case studies showed the use of an extended warranty pay item in the bid form, thus creating an environment that communicates the owner’s willingness to pay for the desired level of quality.
• Q.0= Warranty • Q.1= Warranty Credit
• Q.2= Quality Parameter measured with % in limits • Q.3= Quality Parameter using performance indicator • Q.4= Quality Management Plans
2.2.2.5 Design Alternates
Design criteria are components of many best-value procurements, particularly when highway agencies are soliciting bid alternates under design-bid-build or design-build delivery methods. Design alternates have advantages and disadvantages, depending on the delivery method.
Highway agencies have experimented with alternate bids for specific materials, construction items, or pavement types with some success, and evaluated the value received in terms of life-cycle cost.
• D.0= Design with bid alternate • D.1= Performance specifications
2.2.3 Best-Value Concept 2 (Evaluation Criteria)
The Best-Value system requires the parameters be assigned evaluation criteria. The literature review identified four categories of such criteria [1].
2.2.3.1 Management
The success of a best-value project arguably depends on the people and organizations selected to execute it.
9
Three general varieties of management criteria are as follows: 1. Qualifications of the individual personnel
2. Past performance of the organizations on the best-value team 3. Plans to execute the project
2.2.3.2 Schedule
Developing schedule evaluation criteria for the best-value selection is more than just setting a contract completion date. All foreseen material impacts on the scheduled completion date must be disclosed in the solicitation.
Schedule criteria can be categorized in four general forms: 1. Completion criteria
2. Intermediate milestone criteria 3. Restrictive criteria
4. Descriptive criteria 2.2.3.3 Cost
Properly written submittal requirements give the owner an opportunity to obtain cost information from bidders. Doing so allows owners to develop an understanding of the contractor’s thought process in developing the proposal and to obtain a competitive breakdown of project costs to use later in change order negotiations.
Three types of cost information requirements and associated evaluation were found: 1. Typical cost limitation criteria set by the owner:
• Maximum price • Target price • Funds available
• Public project statutory limits • Type of funding
• Multiple fund sources
• Fiscal year funding 2. Cost break-downs
3. Life-cycle costs 4. Design Alternate
While the bidding of design alternates for highway construction projects is not a new concept, it is not common practice in the United States. Nevertheless, traditional highway construction projects often contain limited requirements for design alternate components, for example contractor-furnished/DOT-approved asphalt and concrete mix. Such projects can be reviewed to determine how to factor design alternates into the Best-Value procurement.
10
2.2.4 Best-Value Concept 3 (Evaluation Rating System)
Calculating Best-Values requires assigning rating systems to the evaluation criteria. Satisficing (commonly referred to as go/no-go), modified satisficing, adjectival, and direct scoring systems are presented. All evaluation (scoring or rating) systems can be categorized into the following four general types of systems [1]:
1. Satisficing
2. Modified Satisficing. 3. Adjectival Rating 4. Direct Point Score 2.2.4.1 Satisficing
The simplest and easiest to understand for both evaluators and proposers, satisficing requires establishing standards for each criterion. Doing so creates a baseline for comparing proposals. 2.2.4.2 Modified Satisficing
Modified Satisficing considers the degrees of responsiveness to any given criteria. As a result, the range of possible ratings is expanded to allow an evaluator to rate a given category across a variety of degrees. Thus, a proposal that is less responsive can be rated accordingly and remain in the competition.
2.2.4.3 Adjectival Rating
An extension of modified satisficing and adjectival rating systems utilize a specific set of adjectives to describe the conformance of a criterion to the project’s requirements.
2.2.4.4 Direct Point Scoring
Under a direct point scoring system, evaluators assign points to each criterion based upon some predetermined scale or the evaluator’s preference. The greatest strength of this system is the scale’s flexibility. It allows more rating levels thus giving precise distinctions of merit.
Once the owner has determined which parameters are most appropriate for a given project, the remaining details of the best-value procurement can be determined.
2.2.5 Best-Value Concept 4 (Award Algorithm)
Best-Value award algorithms define the steps owners take to combine the parameters, evaluation criteria, and evaluation rating systems into a final award recommendation.
Seven best-value award algorithms identified in the literature review, case studies, and project procurements documents are considered [1]:
• Meets Technical Criteria—Low-Bid
• Adjusted Bid
• Adjusted Score
• Weighted Criteria
• Quantitative Cost—Technical Tradeoff
• Qualitative Cost—Technical Tradeoff
11
In addition, Best-Value award algorithms were also identified through a comprehensive review of procurement documents for water/wastewater, building, industrial, and highway projects. These algorithms include:
• Meets Technical Criteria—Low-Bid • Adjusted Bid
• Adjusted Score • Weighted Criteria • Cost-Technical Tradeoff • Fixed Price—Best Design
12
3. DATA COLLECTION
3.1 Data Sources
This chapter discusses and summarizes the effort of analyzing Mn/DOT records and data availability related to the Best-Value topic. Two questionnaires were designed to draw feedback from Mn/DOT engineers, is included in Appendix A and B. Data are collected from four different sources:
1. Best-Value Reports 2. Mn/DOT date records 3. Mn/DOT questionnaire 4. Other Best-Value sources 3.2 Best-Value Reports
Case studies published in NCHRP reports (10-61 and 10-54) provided Best-Value parameters and evaluation criteria as shown in Table 3.1.
3.3 Mn/DOT Data
The data collection phase required answering the following items:
- What data elements exist in Mn/DOT records? - How does Mn/DOT record Data?
- How are data records used in contracting applications?
These questions were addressed during task meetings with Mn/DOT engineers, in which it was concluded that a data base exists which can provide a foundation for Best-Value implementation. The research team collected a considerable amount of data that helped in the initial implementation of the proposed model. Through the data collection process and Mn/DOT feedback, the most suitable parameters to be included in the model were established.
3.3.1 Innovative Contracting Methods
The literature review identified the following primary innovative contracting methods:
• A+B Bidding • Lane-Rental • Incentives/Disincentives • Liquidated Savings • No-Excuse Bonus • Design-Build • Pay-for-Performance • Warranties
13
Table 3.1 Total Collected Best-Value Parameters
Parameter* Evaluation criteria Sub-factors Proposed measures -construction cost -Bid price
-procurement cost Initial capital cost
-design cost (DB projects) Cost
Life cycle cost Life cycle cost Life cycle cost
-design time (DB projects) -design time (DB projects) Time to build
project -construction time -construction time
Lane rental -total road user cost -lane closure cost according to schedule Time
Traffic control -effect of lane closure on road users’ time due to road diversion
-cost of road diversion on total daily traffic -financial information -number of years in business
-cooperation -commercial license Prequalification
-bonding requirements -previous owners
-overall past project success -No. of completed projects within last years -past schedule performance -safety record
Past project performance
-past quality performance -history of timely delivery Personnel
experience
-relevant technical experience -license and registration -past project experience of individual -Relevant experience -relevant experience of project personnel -proposed schedule/work plan -plan for logistics as material and equipment -subcontracting plan -workman’s compensation insurance modifier
as measure of safety records -key personnel plan
Qualification & performance Project management plan -safety plan
Warranty -construction warranty -warranty time Quality
management plan
-quality control plan -construction engineer inspection Quality
Quality parameters -quality control measurements
for material and workman ship -test results -percentage rejected specimens Proposed design
alternates -alternative material or technology and work innovation
determined by Mn/DOT Technical proposal
responsiveness
-compliance with specification and requirements determined by Mn/DOT Design alternates Environmental
consideration -aesthetics -regulation and requirements must be met
Three of the stated methods consider parameters common with the Best-Value system. The A+B bidding process reduces contract time on projects. Contractors bid the time to complete the project and a dollar amount for work items. The contract is awarded to the lowest combination of time and cost. Although, this method improves coordination between prime and sub-contractors and minimizes impacts to users, it may require more resources for contract administration and more intense negotiations for additional work.
Lane-rental reduces impacts to the traveling public by minimizing the time lanes are closed. Contractors are charged a fee for closing lanes and shoulders due to construction activities. The concept focuses on the time that the public is affected, not the overall contract time. Lane rentals encourage contractors to minimize road-user impacts and enhance coordination of prime and sub-contractors; however, more effort is required for monitoring, which increases cost.
14
Warranty requires contractors to guarantee all or portions of a construction project to be free of defects in materials and workmanship for a defined period. The contractor is required to correct deficiencies that occur during the warranty period. The length of the warranty period can vary from project to project, typically 2-3 years for transportation projects. Warranty could have the potential to guaranty high quality and durability of selected work items for a specific time, which alleviates inspection efforts while allowing the state to allocate resources elsewhere. Owners must ensure that warranty guidelines are reasonable and enforceable.
3.3.2 Mn/DOT Questionnaire
Finalizing the list of evaluation parameters required the experience of Mn/DOT engineers. A questionnaire was distributed to the resident engineers during a monthly meeting held on April 17, 2006. This questionnaire facilitated feedback on Best-Value as a procurement process where price and other key factors were considered in the selection process to enhance the long-term performance and value of construction. Project officials expressed the following concerns taken from the meeting minutes:
• Will both environmental and safety be considered in one category
• How are sub contractors considered when evaluating the performance of the prime Comment about the benefits of using BV system to include other parameters rather than the lowest bid
• Question about the level of details that is required Comment about the necessity of gathering data in the future in case of conducting the new approach
• Comment about the need to move to the project level to best answer the questionnaire questions
• Clarification of the fact that the new approach will deal with each project as unique, showing the system’s flexibility The need to distribute the questionnaire to more people rather than resident engineers to avoid personal judgment
This questionnaire is shown in Appendix A. There were 14 respondents.
3.3.3 Questionnaire Summary
The questionnaire sought the following information on whether Mn/DOT engineers were:
• Above average satisfied with the lowest bid system
• Below average satisfied with including factors related to quality in bid awarding process
• Below average satisfied with using incentive/ disincentive to enhance quality
• Above average satisfied with the overall contractor performance in the state
• Average satisfied with commercial license to be a BV parameter for contractor qualification
• Above average satisfied with qualification in other state to be a BV parameter for contractor experience
• Average satisfied with number of project completed in the last year to be a BV parameter for project performance
• Average satisfied with compliance with EEO as a BV parameter for project quality
• Average satisfied with financial ratios as a BV parameter for financial situation
15
3.3.4 Mn/DOT Engineers Meeting
The research team held a meeting with a group of Mn/DOT’s Engineers on the NDSU campus on Jun.30, 2006 to discuss the importance of collecting data from Mn/DOT records. The availability and viability of all potential parameters were discussed and a final set of parameters and corresponding data elements were established.
3.4 Other Best-Value Sources
Additional review of Best-Value systems provided a foundation for this research. Issues regarding implementation, legality, rating systems, and award algorithms were investigated from the experiences of other state agencies.
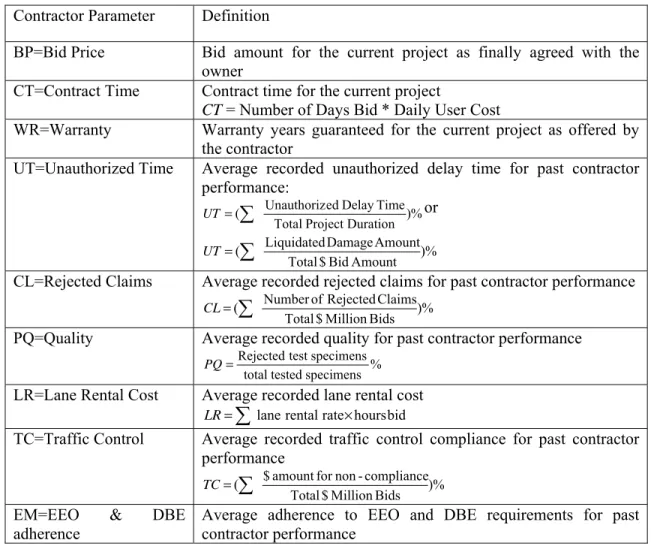
After collecting data from the mentioned sources, an initial list of the most appropriate parameters and corresponding measurements for Mn/DOT is provided in Table 3.2.
Table 3.2 Initially Selected Parameters for Best-Value Model
Contractor Parameter Definition
BP=Bid Price Bid amount for the current project as finally agreed with the
owner
CT=Contract Time Contract time for the current project
CT = Number of Days Bid * Daily User Cost
WR=Warranty Warranty years guaranteed for the current project as offered by
the contractor
UT=Unauthorized Time Average recorded unauthorized delay time for past contractor
performance: )% Duration Project Total Time Delay ed Unauthoriz (
∑
= UT or )% Amount Bid $ Total Amount Damage Liquidated (∑
= UTCL=Rejected Claims Average recorded rejected claims for past contractor performance
)% Bids Million $ Total Claims Rejected of Number (
∑
= CLPQ=Quality Average recorded quality for past contractor performance
% specimens tested total specimens test Rejected = PQ
LR=Lane Rental Cost Average recorded lane rental cost
bid hours rate rental lane × =
∑
LRTC=Traffic Control Average recorded traffic control compliance for past contractor
performance )% Bids Million $ Total compliance -non for amount $ (
∑
= TCEM=EEO & DBE adherence
Average adherence to EEO and DBE requirements for past contractor performance
16
4. MODEL DEVELOPMENT
4.1 Model Concepts
Value has many competing definitions in the industry. One of the broad definitions of Best-Value suggested is “A procurement process where price and other key factors are considered in the evaluation and selection process to enhance the long-term performance and value of construction” [1]. As discussed earlier, this definition was disaggregated into four primary concepts; parameters, evaluation criteria, rating systems, and award algorithms. Based on the analysis of the literature, meetings, and case studies, it was determined that a Best-Value procurement system is the most effective approach when compared to the traditional bidding system. The flexibility of the model parameters and the simplicity of implementation provides clear advantages. The general equation for Best-Value is shown in (4.1):
∑
= × = n i i i A CPS W BV 1 (4.1) Where;BVA= Best-Value for contractor A
n = number of parameters included in the Best-Value equation CPSi = Contractor Parameter i Score
Wi= Relative weight of parameter i
The Best-Value Model consists of two primary components: 1. Contractor Parameter Scores
2. Parameter Weights
4.1.1 Contractor Parameter Scores
The parameters used to evaluate contractors are scored. Among the parameters are bid price, time, quality, traffic control, etc.
4.1.2 Parameter Weights
Parameter weights (summed to 1.0) capture the relative importance of each parameter in the selection process according to the owner’s priorities.
4.1.3 Model Parameters
The parameters and evaluation criteria of Best-Value are first determined from the literature, survey, case studies, and meetings. A preliminary list of evaluation criteria, as shown in Table 3.1, is prepared and the proposed measurements of each evaluation criteria are suggested. Past DOT experience suggests the number of evaluation criteria be minimized and easily extracted from project records. The research team discussed the viability of each parameter included in the initial list (shown in Table 3.2). Discussions yielded a revised list of the parameters and suggested measurement factors. The foundation of this research recognizes that simplifying evaluation criteria (in quantity and measurement) will also simplify implementation.
17
Implementation planning should also recognize the lack of familiarity of the system’s participants and introduce the new concept slowly.
Other suggested contractor parameters such as Safety Records (SR) and Compliance with Environmental permits (EN) may be added to the model at a later time during the model implementation process. Parameter equations will be defined in the section on developing software. The flexibility to include or exclude parameters provides a system that is sensitive to project needs.
4.1.3.1 Factor Importance
Bid Price (BP) is the most important selection parameter in the traditional procurement system. In public agencies, Lowest Bid selection is enforced by law even if it is not a need. Contract time (CT) is used as a competitive parameter for fast track projects. This parameter represents the “B” component of the A+B bidding process and is the product of contract time and road-user-cost. Warranty (WR), the number of years guaranteed by the contractor, addresses the amount of risk the contractor assumes. Lane Rental (LR) reflects the impact of construction activities on the user in terms of time and cost. Lane rental (LR) is equal to the percentage of lane closure cost divided by the total bid price. The Past Quality (PQ) parameter considers the quality of the final product evaluated with the percentage of rejected test specimens. The Employees (EM) parameter is evaluated through the degree of compliance to EEO and DBE requirements, while Claims (CL) shows the contractor cooperation with the owner. This parameter is measured by the percentage of rejected claims divided by the total bid price. Table 3.2 depicts the final selected parameters and the definition formulas used to obtain them.
4.2 Model Evaluation
The model was tested with two pilot projects. Both projects differ in traffic volume, location, scope, preferences, and work type.
4.2.1 TH-113 Project
The primary purpose of this project was to reclaim TH 113 from the Jct. of TH 32 to the Norman/Mahnomen County line providing an increase of 12 to 15 years of life. District 4 out of Detroit Lakes added a 1.5” overlay from Norman/Mahnomen County line to Waupun. The project also included extending centerline RCP culverts to improve safety. This project was detoured with 35 working days assigned for contract completion. This contract was let in January 2006 with an engineering estimate of $2,084,814.87 and a bid price of $2,155,015.29.
4.2.2 TH-494 Project
This project located on TH 494 from 0.70 mile south of CSAH 16 to 0.43 miles north of CSAH 16. The project included grading, concrete and bituminous surfacing, and signal installation. This project was detoured with 145 working days assigned for contract completion. This contract was let in April 2006 with an engineering estimate of $9,058,490.84 and a bid price of $.9,932,277.34
4.2.3 Model Implementation Methodology
For both pilot projects, calculations are made for the lowest three bidders 1. Calculations of Contractor Parameters Scores
2. Calculations of Parameters Relative Weights 3. Calculations of Best-Value Model
18
4.2.3.1 Calculations of Contractor Parameter Score (CPSi)
The parameters of each project are first calculated for the three lowest bids. Row Values of the parameters included in the model for chosen pilot projects is shown in Table 4.1. Next, these values are normalized on a scale of 0 to 100 using the following steps: (consider quality parameter for TH-113)
1. For Contractor A, calculate the row value of the quality parameter using the following equation % Specimens Test total Specimens test Rejected = PQ (4.2) Which yield PQA= 15%
Using the same equation; PQ will be 12% and 0% for Contractor B and Contractor C respectively.
2. Determine the best and the worst values for each parameter from among the available contractor values.
For this case the best is PQA= 0% and the worst is PQC= 15%
3. Assign a Contractor Parameter Score (CPS) ranging from 0 to 100 for each contractor parameter value using the following equation
% parameter contractor of Value parameter best the of Value = CPS (4.3)
This score is determined relative to established reference scores. Reference scores are established from what is considered perfect (100%) and failing (0%), see question #2 in the Mn/DOT questionnaire in Figure 4.2.
4. Assuming that 1% and 15% represent 100% and 0% satisfaction of quality parameter respectively, the calculated CPS will be 6.67, 8.33, and 100 for Contractor A, B, and C respectively
5. In the case that the best parameter value equal zero, replace that value with a small value to avoid violating the domain.
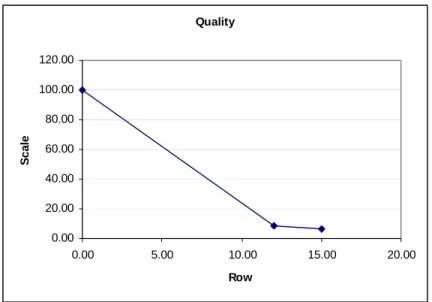
Note: A linear relationship between the row parameter and parameter score is assumed as shown in Figure 4.1. A larger population is needed for actual representation of such relation.
19 Quality 0.00 20.00 40.00 60.00 80.00 100.00 120.00 0.00 5.00 10.00 15.00 20.00 Row Sc a le
Figure 4.1 Relation between Rough Values of Parameter and Parameter Score
Figure 4.2 Part-2 of Mn/DOT Questionnaire
100% Satisfaction
2. For your project, Use the provided sketch to assign the appropriate values of both maximum satisfaction, minimum accepted values and bonus rates for the following Contractor Parameters
Contractor Parameter A B Bonus Rate = % CPS added /1 contractor
parameter point exceeds 100% satisfaction BP=Bid Price CT=Contract Time WR=Warranty UT=Unauthorized Time RC=Rejected Claims PQ=Quality
LR=Lane Rental Cost TC=Traffic Control
EM=EEO&DBE Adherence
Contractor Parameter Score Calculated Contractor
100 A B 0
20
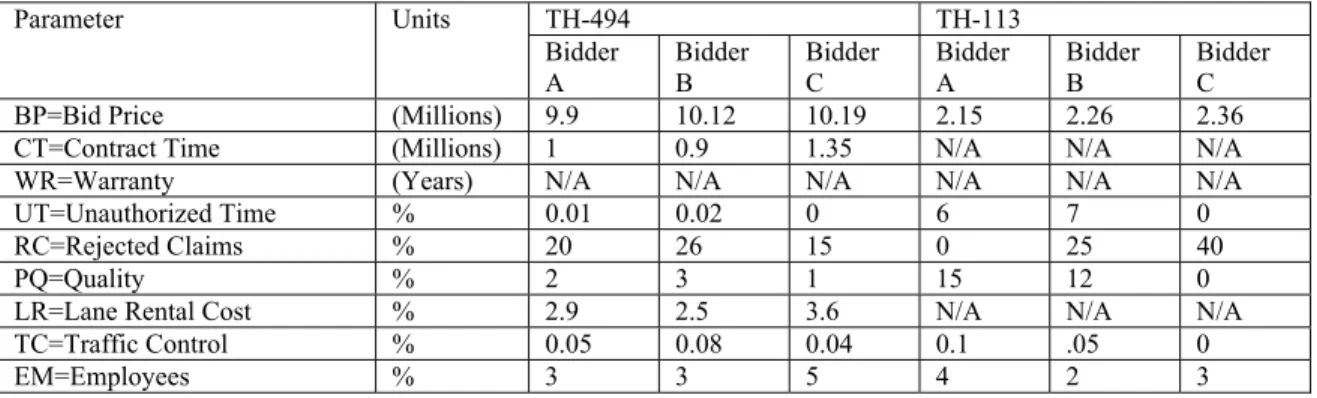
Table 4.1 Row Values of Model Parameters for Both Pilot Projects
TH-494 TH-113 Parameter Units Bidder A Bidder B Bidder C Bidder A Bidder B Bidder C BP=Bid Price (Millions) 9.9 10.12 10.19 2.15 2.26 2.36 CT=Contract Time (Millions) 1 0.9 1.35 N/A N/A N/A
WR=Warranty (Years) N/A N/A N/A N/A N/A N/A
UT=Unauthorized Time % 0.01 0.02 0 6 7 0
RC=Rejected Claims % 20 26 15 0 25 40
PQ=Quality % 2 3 1 15 12 0
LR=Lane Rental Cost % 2.9 2.5 3.6 N/A N/A N/A
TC=Traffic Control % 0.05 0.08 0.04 0.1 .05 0
EM=Employees % 3 3 5 4 2 3
4.2.4 Calculations of Model Weight (Wi)
This step is required to obtain the relevant weights for each parameter included in the Best-Value model. Weights are assigned to parameters through one of the following cases:
A. One or all parameters are fixed at a specific weight depending on the owner experience and/or needs.
B. One or more parameters are fixed at a specific weight while the other included parameters share the remaining weight.
C. All the parameters are obtained from a questionnaire whereby engineers are asked to evaluate the importance of each parameter. Rating is considered only for the parameters that are applicable for the project under consideration. Rating is converted to a relative weight
The following steps summarize the method used to establish parameter weights using the questionnaire rating results.
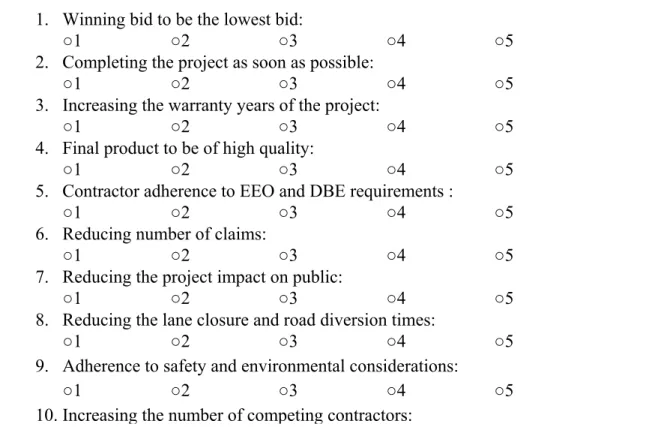
1. Questionnaires, as presented in Figure 4.3, were completed by assigning a rating (1 to 5) for each parameter.
Where
1= Maximum Significance 2= High Significance 3= Low Significance 4= Minimum Significance 5= Not significant at all
2. Weights are inverted and projected to a scale of 100 to 0 using the following equation: )% 1 -5 1 -Rate -(1 Scale Weight = (4.4)
Ratings of 2, 3, and 4 yield weights equal to 75, 50, and 25 respectively.
3. Assign weight scales to BV parameters that are applicable for the current project 4. Calculate the summation of weights for BV parameter included
5. Divide the weight of each parameter by the summation for all parameters to get parameter relative weight (Wi) ranging from 0 to 1 (summation must equal 1).
21
Figure 4.3 Part-1 of Mn/DOT Questionnaire Evaluation Parameters Importance Questionnaire
Calculations of relative weight are shown in Table 4.2. Relative weights for both projects are shown in Table 4.3.
4.2.5 Calculations of Best-Value Model
The Best-Value for each contractor is calculated using the equation (4.1) described earlier as
∑
= × = n i i i j CPS W BV 1Calculations differed on how relative weights were assigned to each parameter in the model. The following 2 cases are possible:
CASE 1: Weights assigned via questionnaire
Determine the importance of the following factors in the selection of the most suitable contractor for your project:
(Assign 1= maximum importance, 2= high importance, 3= low importance, 4= minimum importance, 5= not important at all)
1. Winning bid to be the lowest bid:
○1 ○2 ○3 ○4 ○5
2. Completing the project as soon as possible:
○1 ○2 ○3 ○4 ○5
3. Increasing the warranty years of the project:
○1 ○2 ○3 ○4 ○5
4. Final product to be of high quality:
○1 ○2 ○3 ○4 ○5
5. Contractor adherence to EEO and DBE requirements :
○1 ○2 ○3 ○4 ○5
6. Reducing number of claims:
○1 ○2 ○3 ○4 ○5
7. Reducing the project impact on public:
○1 ○2 ○3 ○4 ○5
8. Reducing the lane closure and road diversion times:
○1 ○2 ○3 ○4 ○5
9. Adherence to safety and environmental considerations:
○1 ○2 ○3 ○4 ○5
22
Table 4.2 Relative Weight Calculations for Project TH-113
Parameter Rating Rating Scale Relative Weight
BP=Bid Price 3 50 0.125 CT=Contract Time 1 - - WR=Warranty 4 - - UT=Unauthorized Time 1 100 0.250 RC=Rejected Claims 3 50 0.125 PQ=Quality 1 100 0.250
LR=Lane Rental Cost 2 - -
TC=Traffic Control 2 75 0.188
EM=EEO&DBE Adherence 4 25 0.063
400 1
Table 4.3 Relative Weights for Projects TH-113 and TH-494
parameter TH-113 TH-494 BP=Bid Price 0.125 0.174 CT=Contract Time - 0.174 WR=Warranty - - UT=Unauthorized Time 0.250 0.174 RC=Rejected Claims 0.125 0.087 PQ=Quality 0.250 0.130
LR=Lane Rental Cost - 0.130
TC=Traffic Control 0.188 0.087
EM=EEO&DBE Adherence 0.063 0.043
CASE 2: Bid price receives a fixed weight of 80%, while remaining 20% is distributed among the other parameters according to ratings from the questionnaire.
A sample calculation for Contractor A (Project TH-113) is shown in Table 4.4.
Table 4.4 Best-Value Calculations for Project TH-113
parameter Weight parameter Score best-Value
BP=Bid Price 0.125 100 12.5 CT=Contract Time - - - WR=Warranty - - - UT=Unauthorized Time 0.250 1.667 0.417 RC=Rejected Claims 0.125 100 12.5 PQ=Quality 0.250 6.667 1.667
LR=Lane Rental Cost - - -
TC=Traffic Control 0.187 10 1.88
EM=EEO&DBE Adherence 0.063 50 3.15
23
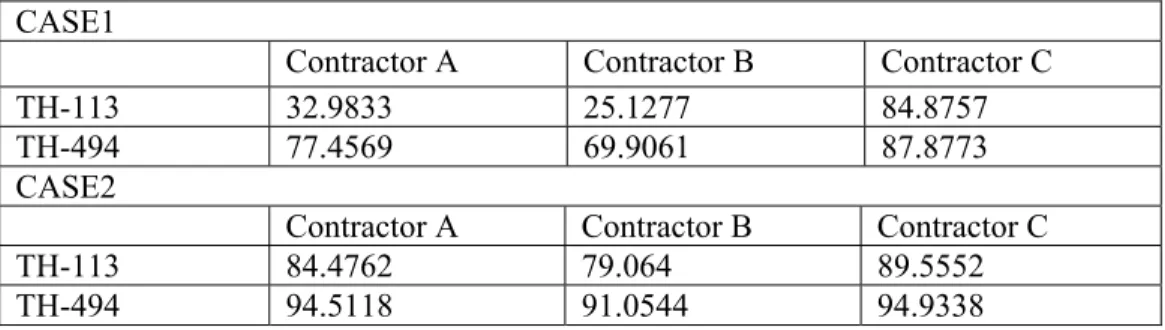
The results from model implementation on both pilot projects for CASE1 and CASE2 are summarized in Table 4.5.
Table 4.5 Best-Value for Projects TH-113 and TH-494 within the Two Cases CASE1
Contractor A Contractor B Contractor C
TH-113 32.9833 25.1277 84.8757
TH-494 77.4569 69.9061 87.8773
CASE2
Contractor A Contractor B Contractor C
TH-113 84.4762 79.064 89.5552
TH-494 94.5118 91.0544 94.9338
4.2.6 Analysis of Results
In the case of Project TH-494, district engineers assigned weights to Bid Price, Contract Time, Unauthorized Time, Rejected Claims, Quality, Employees, and Traffic Control. Warranty was not applicable for this project. Results show Contractor C received the maximum value (100) for four parameters, Contractor B received the maximum value for three parameters, and contractor A received the maximum value for two parameters. In traditional low bid systems, Contractor A would have been awarded the contract; however, the Best-Value analysis produced Contractor C as the best option (Total Score =87).
Project TH-113 considered six parameters out of the nine studied. Contract Time (CT), Warranty (WR), and Lane Rental Cost (LR) were not considered applicable for this project. Bid Price was given a weight equal 0.13 while both Unauthorized Time (UT) and Quality (PQ) were given a weight of 0.25. The Employee parameter (EM) was assigned a weight of 0.06. Contractor C received the maximum value (100) for the three highest weighted parameters. As a result, Contractor C is awarded the contract with a maximum score of 84. A Low Bid system would have awarded Contractor A the job.
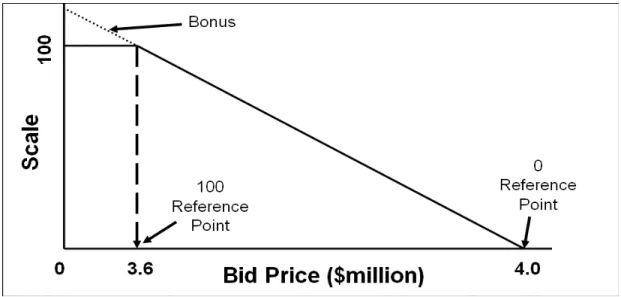
The main advantage of Best-Value procurement is realized in these two projects. In both cases, the contractor with the lowest bid was not the appropriate option considering the projects’ priorities. Moreover, the owner, if legislatively approved, could select a contractor with higher bid that has an advantage to construct the project. A trade-off analysis is shown in Table 4.6.
24
Table 4.6 Trade-off Analyses for Projects TH-113 and TH-494 within the Two Cases Case 1 Project TH-113 Project TH-494 Project TH-113 Lowest Bid Contractor A Chosen Contractor C % difference Lowest Bid Contractor A Chosen Contractor C % difference Price parameter 13.000 11.843 -8.898 17.000 16.516 -2.846 Other parameter (Technical) 19.983 73.033 265.467 60.457 71.361 18.036 Best-Value 32.983 25.128 -23.817 77.457 87.877 13.453 Case 2 Project TH-113 Project TH-494 Project TH-113 Lowest Bid Contractor A Chosen Contractor C % difference Lowest Bid Contractor A Chosen Contractor C % difference Price parameter 80.000 72.881 -8.898 80.000 77.723 -2.846 Other parameter (Technical) 4.476 16.674 272.520 14.512 17.211 18.598 Best-Value 84.476 89.555 6.012 94.512 94.934 0.446
25
5. SOFTWARE DEVELOPMENT
5.1 Introduction
This chapter focuses on developing a research tool for Mn/DOT personnel to test and experience different alternatives and criteria in selecting the best contractor for a specific project. The software deals with the fact that some of the adopted parameters encompass a quantitative nature; however, others encompass a qualitative nature. To acquire the weights of these qualitative parameters, the analytical Hierarchy Process AHP is used. The software is able to facilitate the process of evaluating bids from DOT’s perspectives. The software is flexible enough to change inputs and parameters and modify their weights based on the user’s preferences. The software interacts with the current Mn/DOT contracting system.
5.2 Best-Value Equation
The general equation for Best-Value is shown in the following equation:
∑
= × = n i i i j CPS W BV 1 (5.8)Where; BVA= Best-Value for contractor j, n = number of parameters included in the Best-Value
equation, CPSi = Contractor Parameter i Score, Wi= Relative weight of parameter i 5.2.1 Best-Value Parameters’ Equations
5.2.1.1 Contract Time:
CT = $(Number of Days Bid * Daily User Cost) (5.1) 5.2.1.2 Unauthorized Time: =
∑
% duration project Total delay time ed Unauthoriz UT (5.2) Or =∑
% amount bid Total amount damage Liquidated UT (5.3) 5.2.1.3 Rejected Claims: =∑
% bids $million Total Claims rejected of Number CL (5.4) 5.2.1.4 Quality: % Specimens Test total Specimens test Rejected = PQ (5.5)5.2.1.5 Lane Rental Cost:
% Bids ion Total$Mill bid Hours Rental Lane
![Figure 2.1 Best-Value Procurement Process [1]](https://thumb-us.123doks.com/thumbv2/123dok_us/10582101.2945252/18.918.129.793.510.900/figure-best-value-procurement-process.webp)
![Figure 2.3 Best-Value Award Algorithms [1]](https://thumb-us.123doks.com/thumbv2/123dok_us/10582101.2945252/20.918.126.794.115.456/figure-best-value-award-algorithms.webp)