Technological University Dublin Technological University Dublin
ARROW@TU Dublin
ARROW@TU Dublin
Dissertations School of Computing
2015-01-15
An Analysis of the Predictive Capability of C5.0 and Chaid
An Analysis of the Predictive Capability of C5.0 and Chaid
Decision Trees and Bayes Net in the Classification of fatal Traffic
Decision Trees and Bayes Net in the Classification of fatal Traffic
Accidents in the UK
Accidents in the UK
Aiden O'ConnorTechnological University Dublin
Follow this and additional works at: https://arrow.tudublin.ie/scschcomdis Part of the Computer Engineering Commons
Recommended Citation Recommended Citation
O'Connor, A (2015) An analysis of the predictive capability of C5.0 and Chaid decision trees and Bayes net in the classification of fatal traffic accidents in the UK. DIT 2015
This Theses, Masters is brought to you for free and open access by the School of Computing at ARROW@TU Dublin. It has been accepted for inclusion in Dissertations by an authorized administrator of ARROW@TU Dublin. For more information, please contact
“An analysis of the predictive capability
of C5.0 and Chaid decision trees and
Bayes net in the classification of fatal
traffic accidents in the UK”
Aiden O’Connor
A dissertation submitted in partial fulfilment of the requirements of
Dublin Institute of Technology for the degree of
M.Sc. in Computing (Data Analytics)
I certify that this dissertation which I now submit for examination for the award of MSc in Computing (Data Analytics), is entirely my own work and has not been taken from the work of others save and to the extent that such work has been cited and acknowledged within the test of my work.
This dissertation was prepared according to the regulations for postgraduate study of the Dublin Institute of Technology and has not been submitted in whole or part for an award in any other Institute or University.
The work reported on in this dissertation conforms to the principles and requirements of the Institute’s guidelines for ethics in research.
Signed: Aiden O’Connor
ABSTRACT
Road traffic accidents are a significant cause of deaths worldwide and there is a global focus on understanding accident contributory factors and implementing prevention strategies. Although accident statistics are steadily improving, effective prevention must be persistent, evidence based and properly resourced. This research aimed to extract fatal traffic accident prediction from UK STATS19 accident data using C5.0 and Chaid decision trees and Bayes net classification models. Data was grouped as either fatal or non-fatal. The class imbalance due to fatal accident infrequency was considered and data transformation and sampling techniques were applied to increase prediction likelihood. Chaid was used for supervised discretisation and proved effective in identifying homogeneous subgroups. SPSS Modeler was used for data preparation and model build. Model performance was evaluated using accuracy, recall, precision and ROC curves.
The experiment design and data preparation approach successfully predicted fatal accidents with high recall results, however, significant misclassification of non-fatals as fatals led to poor accuracy and precision performance. Boosting was subsequently tested and achieved some accuracy improvement. Serious accidents were grouped as non-fatal in the initial data analysis, however, are likely to hold similar characteristics to fatal and the models therefore struggled to classify correctly as non-fatal. Changing the experiment design to select fatal, serious and slight as targets may improve the models accuracy. Overall, the models succeeded in classifying fatal traffic accidents correctly and this was the original objective of the research.
Interpretation of business rules, by ranking rules and summarising in a standard format, proved effective for understanding and comparison of key predictors. When comparing both C5.0 and Bayes net models, the contributory factors identified were consistent, with road surface and urban/rural identified as the strongest predictors for both models. The experiment demonstrated that classification techniques can be used to predict infrequent events once sampling techniques are applied.
Key words: Predictive analytics, fatal traffic accidents, classification techniques, imbalanced datasets.
ACKNOWLEDGEMENTS
I would like to thank my supervisor Pierpaolo Dondio for his support and guidance in completing my dissertation.
I would also like to thank my wife Marie for her support and patience throughout the dissertation process and the M.Sc.
TABLE OF CONTENTS
1 Introduction ... 10
1.1 Introduction ... 10
1.2 Background ... 11
1.3 Research Problem ... 16
1.4 Research Aims and Objectives ... 16
1.5 Research Methodology ... 17
1.6 Scope and Limitations ... 18
1.7 Organisation of the Dissertation ... 18
1.8 Conclusion ... 19
2 Literature Review ... 20
2.1 Introduction ... 20
2.2 Road Traffic Accident Overview ... 20
2.3 The Role of Road Safety Data ... 25
2.4 UK Accident Statistics and Contributory Factors ... 26
2.5 UK Road Traffic Accident Data ... 31
2.6 Data Mining Overview ... 32
2.6.1 Data understanding and selection ... 33
2.6.2 Data preparation and transformation ... 34
2.6.3 Model building and evaluation ... 35
2.6.4 Data mining methodology ... 37
2.7 Predictive Analytics ... 38
2.8 Traffic Accident Prediction Research ... 41
2.9 Conclusion ... 43
3 Experiment design ... 44
3.1 Introduction ... 44
3.2 Implementation Methodology ... 44
3.2.1 Database & analytics software ... 45
3.2.2 Focus of experiment and objectives ... 45
3.3 Data Understanding ... 47
3.3.2 Data description ... 49
3.3.3 Data exploration ... 49
3.3.4 Data quality and cleanse ... 49
3.4 Data Preparation ... 50
3.4.1 Data selection and transformation ... 50
3.4.2 Data construction ... 51
3.5 Model Building ... 52
3.5.1 Select modelling technique ... 52
3.5.2 Test design ... 53
3.5.3 Model build ... 54
3.5.4 Model assessment ... 55
3.6 Model Evaluation ... 56
3.6.1 Evaluation results ... 56
3.6.2 Subsequent model improvements ... 57
3.6.3 Key findings ... 57 3.7 Conclusion ... 57 4 Experiment Implementation ... 58 4.1 Introduction ... 58 4.2 Data Understanding ... 58 4.3 Data Exploration ... 63
4.4 Data Quality and Cleanse ... 65
4.5 Data Selection and Transformation... 65
4.5.1 Selecting candidate features for data transformation ... 66
4.6 Data Construction ... 67
4.7 Model Build ... 68
4.8 Conclusion ... 71
5 Experiment Evaluation ... 72
5.1 Introduction ... 72
5.1 Model Assessment on Training and Test Data ... 72
5.1.1 Assessment confusion matrix ... 73
5.1.2 Model assessment ... 76
5.1.3 ROC assessment ... 77
5.2.2 Model 1: V13 Bayes net reduced no resampling ... 84
5.2.3 Model 2: V21 C5.0 normal minority boosting ... 88
5.2.4 Model 3: V4 Chaid reduced no resampling ... 93
5.3 Subsequent Model Improvements ... 96
5.4 Key Findings ... 98
5.5 Conclusion ... 100
6 Conclusion and Further Research ... 102
6.1 Introduction ... 102
6.2 Research Definition & Research Overview ... 102
6.3 Contributions to the Body of Knowledge ... 102
6.4 Experimentation, Evaluation and Limitation ... 103
6.5 Future Work & Research ... 104
6.6 Conclusion ... 106
B IB LIOGRAP HY ... 107
TABLE OF FIGURES
Figure 1. 1 The main risk factors for road traffic accidents ... 11
Figure 1. 2 The 5 E's of Road Safety Improvement ... 12
Figure 1. 3 A framework for road safety improvement ... 12
Figure 1. 4 CRISP-DM Process ... 17
Figure 2. 1 World population covered by legislation for five key road risk factors... 21
Figure 2. 2 Fatalities by road user class (average 2007 - 2011) ... 22
Figure 2. 3 Trends in road fatalities ... 23
Figure 2. 4 Haddon Matrix - A Systems Approach ... 24
Figure 2. 5 Risk factors influencing road traffic injury severity ... 24
Figure 2. 6 UK six road traffic accident performance indicators ... 26
Figure 2. 7 Trends in UK road traffic accident deaths ... 26
Figure 2. 8 KSI as a proportion of total casualties ... 26
Figure 2. 9 Deaths by road user in 2010 for UK ... 27
Figure 2. 10 Proportion of casualties types by motorway ... 27
Figure 2. 11 Licensed vehicles in the UK... 28
Figure 2. 12 Reduction in road traffic accident fatalities in recent years in the UK .... 28
Figure 2. 13 UK 2013 contributory factor and severity... 29
Figure 2. 14 UK 2009-2013 contributory factors for reported accidents ... 30
Figure 2. 15 UK 2013 casualties by contributory factor and severity ... 30
Figure 2. 16 UK 2013 contributory factor by vehicle type... 30
Figure 2. 17 UK 2013 contributory factor by road ... 31
Figure 2. 18 Data mining & knowledge discovery process ... 33
Figure 2. 19 Confusion matrix example ... 36
Figure 2. 20 Sample ROC curve ... 37
Figure 2. 21 CRISP-DM process phases and tasks ... 38
Figure 2. 22 Sample decision tree from IBM SPSS Modeler ... 40
Figure 2. 23 Sample decision tree ruleset from IBM SPSS Modeler ... 40
Figure 3. 1 Adapted Experiment Methodology ... 44
Figure 3. 2 SPSS Modeler audit of initial data ... 48
Figure 3. 3 SPSS Modeler data quality check of initial data ... 49
Figure 3. 4 Process for discretisation ... 51
Figure 3. 5 Training set construction process ... 52
Figure 3. 6 Test design using resampling and Chaid modelling technique ... 54
Figure 4. 1 Fatal accident proportion by policing region ... 60
Figure 4. 2 Proportion of fatalities per month ... 61
Figure 4. 3 Proportion of fatality on weekend days... 61
Figure 4. 4 Proportion of fatalities by time of day ... 61
Figure 4. 5 Proportion of fatalities by road type ... 62
Figure 4. 6 Proportion of fatalities by road surface ... 62
Figure 4. 7 Proportion of fatalities by junction detail type ... 62
Figure 4. 10 Urban or rural conditions ... 63
Figure 4. 11 Initial data relationships identified ... 64
Figure 4. 12 Extract Chaid decision tree ... 66
Figure 5. 1 Accurate ROC curve ... 78
Figure 5. 2 Less accurate ROC curve ... 78
Figure 5. 3 Validation recall and accuracy results ... 81
Figure 5. 4 Validation count TP, FP & FN ... 82
Figure 5. 5 Recall performance by model ... 83
Figure 5. 6 ROC curve model V14 ... 83
Figure 5. 7 Training & test ROC for Bayes net reduced no resampling ... 84
Figure 5. 8 Validation ROC for Bayes net reduced no resampling ... 85
Figure 5. 9 Bayes net reduced no resampling predictor importance ... 85
Figure 5. 10 Bayes net reduced with no resampling ... 86
Figure 5. 11 Training & test ROC for C5.0 normal minority boosting ... 88
Figure 5. 12 Validation ROC for C5.0 normal minority boosting... 89
Figure 5. 13 V21 C5.0 normal minority boosting predictor importance ... 89
Figure 5. 14 Extract C5.0 normal minority boosting decision tree ... 90
Figure 5. 15 V21 C5.0 top urban rules ... 90
Figure 5. 16 V21 C5.0 top rural rules ... 91
Figure 5. 17 Training & test ROC for Chaid reduced no resampling... 93
Figure 5. 18 Validation ROC for Chaid reduced no resampling ... 93
Figure 5. 19 V4 Chaid reduced no resampling predictor importance... 94
Figure 5. 20 Extract Chaid reduced no resampling decision tree ... 94
Figure 5. 21 V4 Chaid model rules ... 95
TABLE OF TABLES
Table 2. 1 STATS19 features ... 32
Table 3. 1 Traffic accident features ... 47
Table 3. 2 Data Construction Datasets ... 51
Table 4. 1 STATS19 fields explored ... 59
Table 4. 2 Derived date/time fields... 61
Table 4. 3 Most important predictors, old groups and new groups ... 67
Table 4. 4 Groups used to construct normal, reduced and semi reduced data ... 67
Table 4. 5 Experiment classification model listing ... 69
Table 4. 6 SPSS settings applicable to all models ... 70
Table 4. 7 SPSS C5.0 specific settings ... 70
Table 4. 8 SPSS Chaid specific settings ... 71
Table 4. 9 SPSS Bayes net specific settings ... 71
Table 5. 1 Confusion matrix and performance measures for training data ... 73
Table 5. 2 Confusion matrix and performance measures for test data ... 74
Table 5. 3 Models with unsuccessful prediction ... 75
Table 5. 4 C5.0 models accuracy results ... 77
Table 5. 5 Validation model listing ... 79
Table 5. 6 Confusion matrix and performance measures for validation data ... 80
Table 5. 7 Validation models with unsuccessful prediction ... 80
Table 5. 8 Confusion matrix and performance measures for top performing models .. 84
Table 5. 9 V13 road surface and urban/rural conditional probability... 86
Table 5. 10 V13 road surface conditional probability ... 87
Table 5. 11 V13 light condition and road type conditional probability... 87
Table 5. 12 Lighting groups description ... 87
Table 5. 13 V21 top rules based on training data ... 90
Table 5. 14 14 V21 C5.0 top 10 rules for validation data ... 91
Table 5. 15 V21 C5.0 top urban rule description ... 92
Table 5. 16 V21 C5.0 top rural rule description ... 92
Table 5. 17 V4 top rules based on training data ... 95
Table 5. 18 Boosting and likelihood ratio results ... 97
Table 5. 19 V21 C5.0 top ranked rules for validation and training data ... 99
1
INTRODUCTION
1.1 Introduction
Road traffic accidents are the eighth leading cause of deaths worldwide with over one million people dying on the roads each year and trends suggest that by 2030 road traffic deaths will have risen to the fifth leading cause (The World Health Organisation, 2013, p. vii). Organisations across the globe are focussed on road traffic accident analysis and understanding and proven strategies exist which can help to reduce road traffic deaths (The World Health Organisation, 2013, p. 1). Research has sought to identify factors which contribute to traffic accidents and use those factors for more effective prediction and as a guide to road safety planning and traffic accident prevention (Lord & Mannering, 2010). Speed, age, alcohol consumption and driving fatigue are some of the factors commonly associated with fatal road traffic accidents (The World Health Organization, 2004). The ability to accurately identify the key factors which contribute most to fatalities could help focus road safety planning efforts. Extracting actionable insights from historical information is a key aim of using predictive analytics. Predictive analytics techniques can be used to extract prediction from data by identifying patterns which may otherwise have gone unnoticed. Classification techniques are commonly used to identify key underlying relationships between data features and identify the key predicting features. Fatal traffic accidents are infrequent and are considered to be random events which increases the prediction difficulty. Sampling techniques can be applied to extract patterns from data with infrequent events.
This research project investigates the use of three classification techniques, C5.0 and Chaid decision trees and Bayes net to predict fatal traffic accidents. An outline of road traffic accident literature provides background to the experiment and an understanding of the key data characteristics. Literature review for data mining and predictive analytics, including the three algorithms selected for the experiment, relevant model evaluation techniques and current traffic accident prediction research are discussed. The experiment design follows a standard methodology and focuses on understanding and preparing the data, building the models and model performance assessment and evaluation. The experiment implementation is described and model results are presented, assessed and evaluated, with key findings outlined. The conclusion summarises the experiment execution, the findings, the limitations and future work which could enhance the findings.
1.2 Background
This chapter outlines the key components of traffic safety and the role road safety systems play to prevent accidents. Information sharing, the role of data and predictive analytics techniques are discussed to understand how they can help prevent road safety situations from occurring (Nyce, 2007). A commonly accepted definition for road accidents is the following:
“a rare, random, multi-factor event which is always preceded by a situation in which one or more road users have failed to cope with their environment” (Baguley, 2001). From this definition, it can be concluded that road accidents are rare events in time. In fact, road accidents have the characteristics of random events (David & Branche, 2004) which mean that they cannot be easily predicted. Accidents have many contributory factors such as driver behaviour, vehicle condition, road or environmental conditions as outlined in Fig. 1.1 (The World Health Organization, 2004, p. 71).
Figure 1. 1 The main risk factors for road traffic accidents Source: (The World Health Organization, 2004, p. 71)
To improve road safety, factors which cause road safety issues in particular countries or regions should be identified (Hermans, et al., 2009). Although individual accidents cannot be predicted, by identifying and predicting the causes of accidents, appropriate counter measures can be put in place to target the contributory factors. It is important that road safety policies are not anecdotal and instead based on robust analysis and
solutions based on local knowledge (The World Health Organization, 2004, p. 25). The five E’s of road safety improvement are education, enforcement, engineering, encouragement and evaluation as described in Fig. 1.2 (Abugessaisa, 2008). Following evaluation, policy makers can focus efforts on preventing accidents by targeting safety awareness campaigns at high risk groups, deploying limited policing resources to high risk areas and allocating funding to infrastructure improvements.
Figure 1. 2 The 5 E's of Road Safety Improvement Source: (Abugessaisa, 2008)
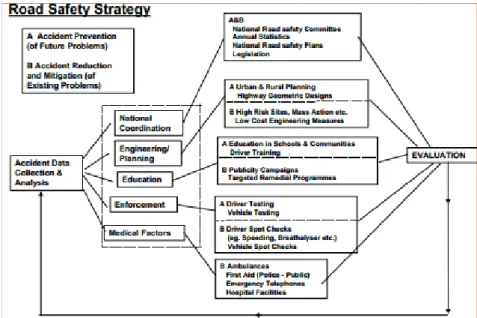
Fig. 1.3 outlines Baguley’s general framework of road safety improvement achieved by either accident prevention or reducing the cause of accidents, with an accident database at the centre of planning and evaluation. In order for road safety efforts to be effective they should be based on evidence, sustainable, properly resourced and the cost considered (The World Health Organization, 2004, p. 12).
Figure 1. 3 A framework for road safety improvement Source: (Baguley, 2001)
In order to prevent and reduce the causes of accidents, sharing accident data from various sources is vital. Road safety data is collected by different agencies, e.g.
hospitals and police. Road safety information is conducive to sharing due to the features it holds (Mitchell, 2002). In the UK, police complete a standard STATS19 accident report form for each road traffic accident reported to them. This data is available on the UK open government website for the period 1979 to 2013.1 STATS19 data can answer questions such as where, when and what type of injury occurred, the consequence of a collision as well as the environmental conditions.
To improve road safety, a prerequisite is that information is available about accidents, fatalities, injuries and roads (Abugessaisa, 2008, p. 9). Many countries experience problems defining the accident information, collecting the information, maintaining quality and ensuring completeness (Abugessaisa, 2008, p. 9). In the UK, fatalities are known to be recorded accurately, however, under reporting of non-fatalities is a significant issue (The International Transport Forum, 2013). Two notable characteristics of road safety data is that their sources vary and they suffer from under reporting issues (Abugessaisa, 2008, p. 10). Extracting data from different data sources, verification of data and harmonising into a consistent format are time consuming tasks. Time spent on data integration is time which cannot be spent analysing road safety situations and thus helping to prevent road safety issues. To help address data integration issues, well defined methods should be adopted by road safety experts. STRADA, the Swedish traffic accident data management system, is used by police and hospitals to coordinate accident reports and aims to make road traffic accident details reliable and consistent and harmonise data. By bringing together data, the volume of data available on road traffic injuries and accidents increased and the number of unrecorded incidents reduced (Abugessaisa, 2008, pp. 30-33). The availability, quality, reliability and accuracy of relevant data would seem to be paramount to a predictive road safety strategy. (Nyce, 2007, p. 2) stated:
“the validity of any predictive model depends on the quality and quantity of the data available to develop it”.
Data on road traffic accidents is not consistently collected and harmonised into databases in many countries (The International Transport Forum, 2013). Similarly, data on accidents caused by environmental, technical and other factors is not well captured. Information available in databases such as city event calendars and weather conditions can provide additional awareness around the events that lead to road safety issues. The more data that is available, the more opportunity there is to identify factors which might influence road safety issues. A prominent issue is the lack of available government policy to facilitate the sharing of data between government agencies. This is a significant predictive modelling issue as data which might improve the accuracy of
1
Department of Transport UK, 2014. Road Safety Data, http://data.gov.uk/dataset/road-accidents-safety-data, [Accessed 26 10 2014].
a predictive model is not available arising from data sharing issues.2 This impacts road safety policy makers capability to improve road safety polices and accurately monitor performance. Recent initiatives to publicly share road safety and weather data would seem to be a move in the right direction.3 By releasing high quality and diverse data to the public, crowd sourcing could use predictive analytics to help improve road safety. Policy makers use road safety performance indicators to measure road safety effectiveness. They provide a method to characterise the safety quality of road safety components (Abugessaisa, 2008, p. 22).
In IRTAD countries, between 2000 and 2010, fatal road traffic accidents have reduced substantially mainly due to improved safety features in cars and sustained anti drink driving campaigns (The International Transport Forum, 2013). Road traffic accidents relating to vulnerable road users such as pedestrians and cyclist have reduced but the reduction was smaller than that recorded for vehicle occupants. It may be concluded that significant improvements have been achieved, however, there is no time for complacency as the World Health Organisation (WHO) estimate that approximately 1.24 million people will lose their lives each year as a result of road traffic accidents with vulnerable road users making up half of those who die (The World Health Organisation, 2013).
A key requirement in the data mining and predictive analytics process is an understanding of the data. Inaccurate or missing data impact on the quality of the prediction which can be achieved. Given that fatal road traffic accidents are low frequency events, when considered in the context of all data recorded for road traffic accidents, this would be a key consideration when creating a predictive model as it could pose problems in terms of acquiring an adequate sample size to make the data amenable to prediction.
Data mining tools and techniques can be used to predict future events and trends which allow proactive and knowledge driven decisions. A part of the data mining process includes using machine learning techniques to find patterns and relationships in data (Miner, et al., 2009, p. 17). Examples of modelling techniques include decision trees and Bayes net. Many modelling techniques produce a propensity score which is a
2Travis, A., 2012, ‘
Government revives plan for greater data-sharing between agencies’,The Guardian, 24 May. Available at:
http://www.theguardian.com/politics/2012/apr/23/government-plan-share-personal-data, [Accessed 01 12 2014].
3
number in the range zero to one which indicates the likelihood of the event modelled occurring given a set of predictors. The score is ordered descending from highest to lowest with higher scores indicating that the event is more likely to occur. When approaching a data mining experiment, adoption of a methodology provides structure and best practice to the process. CRISP-DM is an industry accepted methodology which outlines six phases to a data mining project.
Predictive analytics relates to a broad field which applies statistical and analytical techniques to build predictive models to identify future events or behaviours (Nyce, 2007, p. 1). Predictive analytics is defined as a
“set of business intelligence (BI) technologies that uncovers relationships and patterns within large volumes of data that can be used to predict behaviour and events. Unlike
other BI technologies, predictive analytics is forward-looking, using past events to anticipate the future” (Eckerson, 2007, p. 5).
The main component of a predictive analytics technique is the predictor. These are variables that can be measured to predict future behaviour. Predictive analytics tools include mathematical algorithms as well as machine learning and statistical methods. These are very effective in terms of overcoming manual searching of data. Examples of modelling techniques include clustering (McCue, 2007, p. 51), supervised learning (Chong, et al., 2005) and time series analysis (Monfared, et al., 2013).
This research focuses on three classification techniques, C5.0 and Chaid decision trees and Bayes net. C5.0 is a supervised learner developed by Ross Quinlan to build decision trees using the concept of information gain. It works by splitting the data based on the field that provides the most information gain. Each subsample defined by the split is split again based on the next most important field. This process continues until the subsamples cannot be split any more. Finally, the lowest splits in the decision tree, which provide the least information, are removed. Similar to C5.0, Chaid is a supervised learning algorithm used for classification. Chaid (Miner, et al., 2009, p. 246) stands for Chi-squared automatic interaction detection. It was proposed by Kass in 1980. The splitting mechanism is specific to Chaid. Chaid uses the Chi-squared statistical test for proportion to determine a split. Chaid uses multiway splits (Miner, et al., 2009, p. 246) to construct trees and has a stopping mechanism which determines when a sub tree is complete (Miner, et al., 2009, p. 792). A Bayesian network (Bayes net) is a probabilistic graphical modelling technique used to represent knowledge about an uncertain domain such as traffic accidents (Simoncic, 2004). Bayes net can be used to classify a target variable such as fatal traffic accident. The network represents a set of random variables and their conditional dependencies. In the network, nodes represent random variables and edges represent the conditional dependencies among random variables.
1.3 Research Problem
(Tesema, et al., 2005) stated that we are drowning in data, yet knowledge of the factors which contribute to road traffic accidents fatalities seem to be limited. The STATS19 data is used extensively for road traffic accident statistics reporting in the UK and records accident related features in a consistent and relatively complete fashion. Predictive analytics would seem to be suitable for sifting through the data to identify useful patterns which could help predict road fatality risk. Fatal traffic accidents are considered infrequent events which adds to the prediction difficulty.
The research problem addressed in this dissertation is whether three selected classification techniques, C5.0 and Chaid decision trees and Bayes net, can predict fatal road traffic accidents based on a STATS19 UK Road Safety dataset and whether key contributory factors to fatal road traffic accidents can be extracted from the models.
1.4 Research Aim s and Objectives This research aims to:
• Apply three predictive modelling techniques, C5.0 and Chaid decision trees and Bayes net, to build predictive models to classify fatal road traffic accidents.
• Evaluate the technical and non-technical performance of the best prediction models.
• Identify the key contributory factors of fatal traffic accidents from the predictive models.
The objectives of the research are to:
• Review academic literature for road traffic accidents
• Review literature for data mining, predictive analytics and evaluation techniques and current research specific to traffic accident prediction
• Understand the data and prepare the data for modelling
• Design the experiment to build and evaluate models for C5.0 and Chaid decision trees and Bayes net to predict fatal traffic accidents
• Conduct the experiment to classify fatal traffic accidents and assess and evaluate the models
• Extract key findings from the experiment and the key contributory factors identified from the models
Given fatal traffic accidents are a significant cause of preventable death, it is hoped that this research will make a contribution to the existing body of knowledge.
1.5 Research Methodology
An overall design for the experiment will be prepared, following a recognised methodology to ensure a reliable and repeatable process is adopted. The design will include defining and preparing training data, test data and validation data, building models using selected modelling techniques, assessing model performance as well as model evaluation. IBM SPSS Modeler, a leading commercial predictive modelling tool, will be used to build the predictive models.
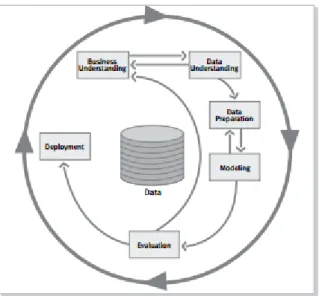
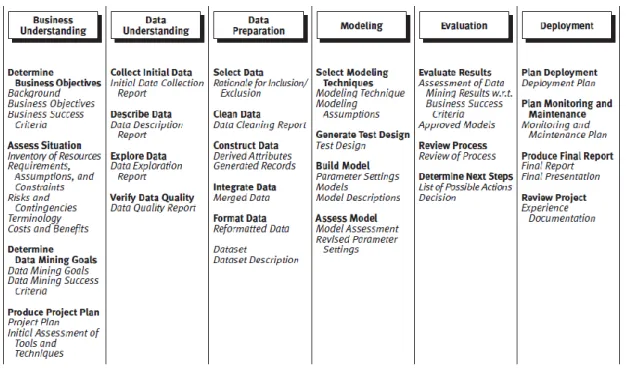
The Cross Industry Standard Process for Data Mining (CRISP-DM) will be used to guide the modelling process. CRISP-DM, as outlined in Fig. 1.4, is a standard process used to implement a predictive analytics and data mining solution (McCue, 2007, p. 49). An adaptation of this methodology, further discussed in chapter 3, was applied for the experiment to align to the specific experiment requirements.
Figure 1. 4 CRISP-DM Process Source: (Chapman P., et al, 2000)
Business understanding was derived mainly from literature review. Data understanding was based on data exploration and analysis using SPSS Modeler and Toad for Oracle database. The dataset selected for the experiment was the STATS19 UK Road Safety dataset, which is publicly available and is often used for academic research and the most commonly used source of UK road safety statistics. The literature suggests that the STATS19 data is well recorded for fatal accidents4, it was hoped that the data
4
Department of Transport UK, 2014, STATS19 Road Accident dataset. http://www.adls.ac.uk/department-for-transport/stats19-road-accident-dataset/?detail,
collected could be used to identify contributory factors for fatal accidents. Data preparation involved data selection, reduction and construction. Modelling stage included selection and design of the modelling techniques, building models in line with design and assessment of models. Evaluation was the final stage of the experiment where unseen data was scored against the models.
1.6 Scope and Lim itations
The scope of the dissertation was to design, build and implement three classification models which can effectively predict fatal road traffic accidents and to identify key fatal accident contributory factors identified by the models. The data source was the UK STATS19 road safety dataset which records all reported road traffic accidents. The UK dataset was selected due to the reported quality and completeness of the data and also the volume of fatal road traffic accidents in the UK should be sufficient to extract meaningful prediction.
The focus of the research was on prediction of fatal accidents. Modelling and sampling techniques were selected and applied to improve the likelihood of fatal accident prediction. As fatal traffic accidents were infrequent events in the STATS19 dataset, sampling techniques were used to improve fatal accident recall. However, as a result precision and accuracy performance were expected to be negatively impacted. Data preparation focussed on fatal accidents only which may also impact on accuracy performance if non-fatal data is misclassified where features for fatal and non-fatal are similar. This limitation means some performance metrics were expected to be low. This research was completed without the assistance of a subject matter expert so data exploration and preparation was completed using SPSS Modeler and Toad for Oracle and using Chaid for data reduction. This limitation meant that business understanding was not applied to the research and an informed review of data preparation prior to model build may have provided more meaningful data groups and therefore data relationships. The original experiment limits model builds to twenty seven, for each classification model, three modelling techniques and three sampling techniques were selected. Five additional models were built post evaluation to test if accuracy performance could be improved. The limitation of model numbers was necessary in order to ensure the research was completed within the time and project size constraints.
1.7 Organisation of the Dissertation
Following this brief introduction chapter, the remaining chapters describe in more detail the literature review completed for road traffic accidents and data mining and prediction techniques, the experiment design, implementation, evaluation and research conclusions.
Chapter two provides a description of the relevant literature on road traffic accidents. The chapter provides an overview of road traffic accident environment, the role of road safety data, UK accident statistics and contributory factors and the UK road traffic accident data. The chapter also introduces relevant data mining and predictive analytics research literature. An overview of data mining and the key data considerations is provided, together with relevant data sampling techniques. Predictive analytics, specifically focussed on classification techniques, is outlined and assessment and evaluation techniques relevant to this research are discussed. Current traffic accident prediction research is briefly discussed.
Chapter three proposes the research experiment design, including the implementation methodology, the key requirements for data understanding and data preparation, the model build and approach to model evaluation.
Chapter four describes the experiment implementation stages in line with the experiment design outlined in chapter 3. This chapter discusses each stage in more detail and provides details about the models built.
Chapter five outlines the experiment evaluation including the assessment of the model performance for training and test data and the technical and non-technical evaluation against validation data. Two suggested model improvements are evaluated and the key findings are summarised.
Chapter six provides a summary of the research completed, contributions to the body of knowledge and the experiment evaluation and limitations. Future work considerations are suggested.
1.8 Conclusion
The introduction provides an outline for the research experiment. The background to road traffic accidents and predictive analytics and classification techniques are introduced. The research problem to be addressed as part of this research and the main aims and objectives are presented. The planned research methodology is outlined, together with the scope of the research and the key limitations identified. Finally the structure of the research is summarised by chapter to provide an outline of the subsequent research.
2
LITERATURE REVIEW
2.1 Introduction
This chapter discusses current literature relating to road traffic accidents, data mining and prediction techniques relevant to this research. An overview of road traffic accidents is provided to frame an understanding of the relevant subject matter. The overview is followed by a brief discussion of the role of road safety data, road traffic accident data as well as information sharing. Relevant road traffic accident statistics for the UK are presented together with a description of contributing factors as identified in current literature.
Data mining is a broad term used to describe a variety of statistical and machine learning techniques used to extract knowledge from data. Data mining techniques can be applied to interrogate data and identify underlying trends allowing for the development of models aimed at predicting future events. The literature review focuses particularly on techniques which are of relevance to the research experiment and applicable techniques which could be applied to the prediction of fatal accidents. An overview of CRISP-DM is provided as this is a widely used methodology for data mining and predictive analytics.
Predictive analytics uses data mining and machine learning techniques to predict future events or behaviours. Classification techniques extract prediction by applying machine learning techniques and identifying relationships in data and grouping into classes. An overview of classification techniques including the algorithms selected for the experiment, C5.0 and Chaid decision trees and Bayes net, is provided.
Relevant evaluation techniques are discussed which are used to evaluate the performance of models in this experiment. Techniques include the confusion matrix, receiver operator curve (ROC), area under the curve as well as model interpretability. Four academic papers are briefly discussed outlining current research in the field of traffic accident prediction. The results achieved by (Wah, et al., 2012) in predicting fatal traffic accidents led to consideration of this research problem.
2.2 Road Traffic Accident Overview
It is estimated that more than a million people die from injuries sustained on the world’s roads annually and road fatalities are ranked eighth as the cause of deaths globally (The World Health Organisation, 2013, p. 1). The consequential socio-economic impact of dealing with road traffic accidents is estimated to run into the billion’s with young people aged 15 – 29 representing the largest proportion of
casualties (The World Health Organisation, 2013, p. 1). The costs of road traffic injuries are staggering (David & Branche, 2004) and include, but are not limited to, ambulance, hospital care, earnings lost as well as lifestyle disruption and emotional costs. Traffic accident injury is considered largely predictable and preventable (The World Health Organization, 2004, p. 25). For example, remedial and inexpensive interventions can be undertaken such as removing overgrown hedging which obscure stop signs (The Irish Road Safety Authority, 2013, p. 36). In recent years, countries in the developed world have reduced road traffic accidents by adopting road safety strategies and enforcing legislation to address some key risks such as speed, drink driving and seat belt wearing, however, it is noted that encouraging a safe road culture requires persistent effort (The World Health Organisation, 2013, p. 12). Fig. 2.1 presents the worldwide increase in comprehensive legislation enforced to target the key five road risk factors.
Road traffic deaths each year have not increased, however, the volume of approx. 1.24 million remains “unacceptably high” (The World Health Organisation, 2013, p. 4) and more action is needed to further reduce road traffic accidents. Although many useful strategies exist to address road safety behaviour they could be more widely implemented (David & Branche, 2004). 2012 was an important milestone for the OECD-IRTAD with many countries recording their lowest fatality rate on record (The International Transport Forum, 2013, p. 9). In order to achieve the 2020 targets set by the UN, to halve the fatality rate worldwide, improved road safety strategies will need to be adopted by those countries trailing behind the trend.
Figure 2. 1 World population covered by legislation for five key road risk factors
Source: (The World Health Organisation, 2013, p. 12)
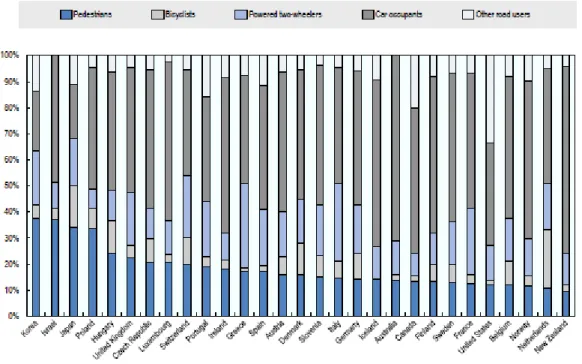
Fig. 2.2 displays the average fatality by road user from 2007 – 2011. Pedestrians and cyclists represent a neglected group of road users which comprise 27% of road traffic fatalities worldwide (The World Health Organisation, 2013, p. v). Recently, at the
road safety and sustainable development. Road safety policy must now focus on increasing the safety of non-motorised road users by protecting them from high speed traffic which is in line with a sustainable transport policy (The World Health Organisation, 2013, p. v).
Figure 2. 2 Fatalities by road user class (average 2007 - 2011) Source: (The International Transport Forum, 2013, p. 8)
Figure 2.3 shows that the average annual reduction in fatalities was higher in the last decade than any of the previous three decades for most IRTAD countries. This evidence supports the assertion that the implementation of road safety strategies has produced good results over the long term and the effective implementation of road safety policies would seem to be crucial. The safety of vehicle occupants has improved substantially over the last decade through public campaigns such as drink driving awareness and speed reduction programs (The Irish Road Safety Authority, 2013). National television networks have been used to graphically illustrative the consequences of bad driving practice. According to UTV News, some cohorts have strongly objected to the graphic nature of these accounts 5 but others maintain that this is what is required to deliver a compelling message to young people who are the largest casualty group in the OECD (The World Health Organisation, 2013, p. vii).
5
UTV News, 2014, 'Shocking NI road safety ad goes viral’, Available at: http://www.u.tv/News/Shocking-NI-road-safety-ad-goes-viral/81cf1549-f38a-4d28-a274-0060a6b2c43c, [Accessed 23 09 2014].
Figure 2. 3 Trends in road fatalities Source: (The International Transport Forum, 2013, p. 12)
Approaches such as legislative enforcement and police checkpoints have proven to be effective (The Police Chief, 2005). Road users are now encouraged to consider and reflect on their road usage behaviour by employing sophisticated road safety advertisements and mass media campaigns (The Irish Road Safety Authority, 2013).
Attitudes to road safety and road user behaviour differ greatly worldwide. Cultural considerations need to be factored into road safety planning and actions to prevent road traffic accidents should be tested locally (The World Health Organization, 2004, p. 162).
The WHO recommends that road safety agencies should be appointed in each country and should be given decision making authority to co-ordinate road safety efforts and resources (The World Health Organisation, 2013, p. 27). For example semi-state bodies such as the Irish Road Safety Authority play a key role educating the public about road safety. Unless urgent action is taken, current research suggests that by 2030, road traffic accidents will become the fifth leading cause of death world wide (The World Health Organisation, 2013, p. vii). A systems approach has been proposed as a necessary tool to effectively prevent road traffic injury. Haddon’s matrix, as outlined in Fig. 2.4, has been useful in the development of strategies and techniques (The World Health Organization, 2004, p. 12).
Figure 2. 4 Haddon Matrix - A Systems Approach Source: (The World Health Organization, 2004, p. 13)
The WHO and World Bank intensified work on road traffic injury prevention and prepared a detailed joint report which sought to describe patterns and impacts at a global and local level, review key risk factors and discuss intervention strategies (The World Health Organization, 2004, p. xx). Setting road safety targets has become an important part of national road safety strategies in many high-income countries. Governments are recommended to set interim targets to encourage public and political support for long term strategies but collection of data is key (The World Health Organisation, 2013, p. 27). There is strong scientific evidence available which supports the claim that adopting intervention’s, such as creating, adopting and enforcing legislation relating to key risk factors such as drink-driving, speed and wearing of seat belts, leads to a reduction in road traffic injury (The World Health Organisation, 2013, p. v). If action is taken, many lives can be saved and the evidence would seem to suggest that improvements can be achieved by taking simple measures (The Irish Road Safety Authority, 2013, p. 36). The WHO and World Bank joint report identified that there are well established risk factors which influence the severity of a road traffic accidents as summarised in Fig 2.5 (The World Health Organization, 2004, p. 88).
Figure 2. 5 Risk factors influencing road traffic injury severity Source: (The World Health Organization, 2004, p. 88)
2.3 The Role of Road Safety Data
In order to improve road safety and reduce fatalities, high quality, reliable and consistent information relating to accident circumstances as well as vehicle and casualty details should be made available to road safety professionals.
“Only by systematic and data-led management of the leading road injury problems will significant reductions in exposure to crash risk and in the severity of crashes be
achieved” (The World Health Organization, 2004, p. 8).
The availability of traffic accident data will enable road safety professionals to accurately assess the current situation and propose appropriate counter measures to reduce the likelihood of road safety situations. Data driven decisions taken, following analysis, is a function of data quality. The higher the data quality, the more targeted the corrective actions can be (Abugessaisa, 2008, p. 11). (Abugessaisa, 2008, p. 10) noted that road safety data has two notable characteristics. The first is that not all traffic accidents are reported. There may be a record of an injury at a hospital or insurance claim at an insurance company but no official road traffic accident record with the police. Secondly the consistency and accuracy of road traffic accident data sources vary. Data consumers find themselves needing to analyse different sources to materialise a consistent and accurate view of events. It would seem that there are data quality issues with road safety data (Abugessaisa, 2008, p. 11) and the data owners in many jurisdictions may need to be educated on the important role of road safety data. Consideration should be given to how data is gathered, organised and analysed. According to (Baguley, 2001, p. 8), studies of hospital records have shown that road accidents are considerably under reported, although the level of reporting tends to be higher for more severe injuries. However, in the UK all fatal accidents are reported by the police (The International Transport Forum, 2013, p. 429). By involving all the key participants responsible for road safety and implementing safety measures systematically, road deaths and serious injuries can be avoided (The World Health Organization, 2004, p. 19). The participants include but are not limited to drivers, vehicle designers and manufacturers.
According to (Hermans, et al., 2009, p. 178), performance indicators representing road safety risk factors can be used to quantify road safety performance. Accident or injury safety performance indicators can be used to measure if actions are effective (The World Health Organization, 2004, p. 19). Indicators are needed by road safety planners as basic accident counts do not evaluate accidents in terms of costs which are critically important to society e.g. social cost. By evaluating accidents in terms of critical factors, performance indicators can be used to help legislators and road safety professionals identify sectors in road safety which are performing well and those which require attention. In the UK a new strategic framework was launched in May
Figure 2. 6 UK six road traffic accident performance indicators Source: (The International Transport Forum, 2014, p. 501)
2.4 UK Accident Statistics and Contributory Factors
According to (The International Transport Forum, 2014, p. 491), between 2000 – 2012, a fatality reduction rate of 50% was recorded in the UK and as in Fig. 2.7 the trend for road traffic deaths has been steadily falling since 2006 (The World Health Organisation, 2013, p. 225).
Figure 2. 7 Trends in UK road traffic accident deaths Source: (The World Health Organisation, 2013, p. 225)
(The International Transport Forum, 2014, p. 490) states in 2013, 13% of the total 183,670 road casualties in the UK were killed or serious injury (KSI) casualties as displayed in Fig. 2.8. Although traffic flow increased in the period, there was a 2% decrease in the killed group. The reduction in accidents or fatal accidents was noted on all road types in 2013 when compared to 2012.
Figure 2. 8 KSI as a proportion of total casualties Source: (Department of Transport UK, 2013)
Drivers in 4-wheeled and light vehicles are the highest proportion of road deaths in the UK in 2010 followed by pedestrians and motorbike riders as displayed in Fig. 2.9.
Figure 2. 9 Deaths by road user in 2010 for UK Source: (The World Health Organisation, 2013, p. 225)
In 2013, the (Department of Transport UK, 2013) reported that most fatalities were car occupants and occurred on non-built up roads while most serious injuries occurred on built up roads as shown in Fig. 2.10.
Figure 2. 10 Proportion of casualties types by motorway Source: (Department of Transport UK, 2013)
At the end of 2013, there were 35 million vehicles licensed for driving in the UK (Grove, 2014) as outlined in Fig 2.11, this number has increased year on year for the last 10 years. Even with the increase in licensed vehicles, the fatality rate has reduced significantly over the last decade and in 2013, road safety incidents decreased again, with fatalities at their lowest levels since records began (Department of Transport UK, 2013).
Figure 2. 11 Licensed vehicles in the UK Source: (Grove, 2014)
Fig 2.12 describes the number of fatalities reported for the period 2005 – 2013. The 2012 – 2013 fatality count was 39% below the 2005 – 2009 average which would supports the claim that recent road safety strategies were effective (Department of Transport UK, 2013).
Figure 2. 12 Reduction in road traffic accident fatalities in recent years in the UK
Source: (Department of Transport UK, 2013)
The largest ever reduction in fatalities in the UK was observed in 2010 due to sustained periods of adverse snow and ice weather conditions (The International Transport Forum, 2013, p. 429). Environmental factors impact on road traffic accidents. (The International Transport Forum, 2014, p. 490) noted that in the first quarter of 2013 the weather was notably colder when compared with 2012, this was likely to have contributed to reduced casualties for pedal and motor cyclists and car occupants. There are various factors which might have contributed to this reduction including but not limited to improved vehicle safety, road engineering, hospital care and road safety education (The International Transport Forum, 2014, p. 491).
In the event of a road traffic accident, a number of characteristics are known to increase the risk of traffic accidents which include demographic, behavioural, environmental and vehicle (The World Health Organization, 2004). Demographic
characteristics include age and address as well as the occupation of the driver. Behavioural characteristics include drug or alcohol taking while driving, seat belt usage, speed and fatigue. Environmental characteristics include road and visibility conditions as well as weather conditions. Vehicle characteristics include car class, age and engine size.
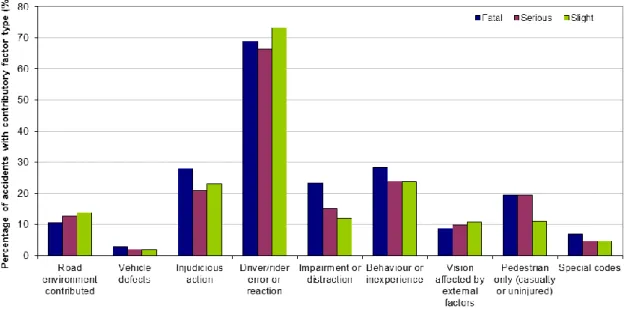
Contributory factors for road safety accidents are wide ranging. The factors identified are different depending on the particular characteristics being considered whether demographic, behavioural, environmental or vehicle. For example a behavioural contributory factor may be speed whereas as environmental factor may be road type. (The International Transport Forum, 2014) road safety annual report presents the key statistics relating to road safety accidents in the UK for 2013. Fig. 2.13 to Fig. 2.17 present the most recent statistics.
Figure 2. 13 UK 2013 contributory factor and severity6
6
Department of Transport UK, 2014. Contributory factors for reported road accidents, https://www.gov.uk/government/statistical-data-sets/ras50-contributory-factors, [Accessed 01 12 2014].
Figure 2. 14 UK 2009-2013 contributory factors for reported accidents6
Figure 2. 15 UK 2013 casualties by contributory factor and severity6
Figure 2. 17 UK 2013 contributory factor by road6
2.5 UK Road Traffic Accident Data
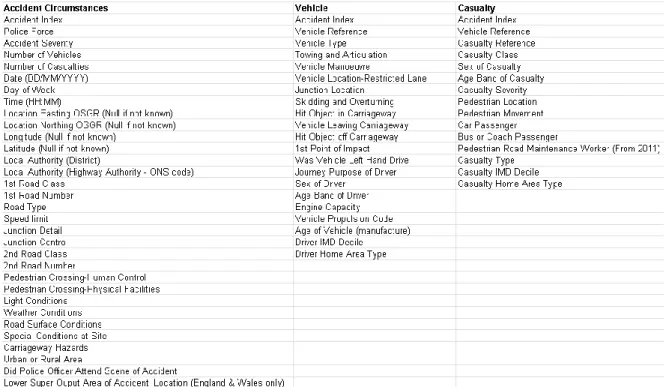
To build an accident prediction model, a core set of data is required. From this data, exploratory analysis can be conducted followed by model design. As previously mentioned road safety information tends to be managed by multiple agencies and is amenable to sharing (Mitchell, 2002). In the UK, the two main sources of road safety information are STATS19, the national road accident reporting system which includes police information, and the hospital episode statistics (HES) (The International Transport Forum, 2013, p. 428). Each agency manages different information of interest and uses it for specific purposes. All personal injury accidents which are reported to the police are recorded on a standard form called the STATS19 form. The STATS19 Road Safety dataset is published annually by the UK Department of Transport. The Department publishes the STATS19 dataset on the UK open data website which is licensed under the open government license.7 Under this license, an individual is free to copy, publish, distribute and adapt the STATS19 dataset. The dataset is supported by the “road accident safety data guide” which is a data dictionary which describes the structure of the STATS19 data.8
The dataset contains 7.5 million observations providing details about the circumstances of personal injury road accidents, vehicles involved and casualty details recorded since 1979. Each observation is classified by accident severity. The accident severity classifications are “fatal”, “serious” and “slight”. The dataset is divided into three categories being accident, vehicle and casualty. Accident features include date, time, speed limit, road type as well as weather, light and road surface conditions and
7
Department of Transport UK, 2014. Road Safety Data, http://data.gov.uk/dataset/road-accidents-safety-data, [Accessed 26 10 2014].
junction detail. Vehicle features include but are not limited to vehicle type and manoeuvre, driver sex and age as well as engine capacity. Casualty features include casualty type, sex and age band of casualty. All features recorded in each category are described in Table 2.1.
Table 2. 1 STATS19 features8
2.6 Data Mining Overview
A key consideration for data mining is the type of data in the dataset, including the volume, structure, frequency and specific characteristics. Fatal traffic accidents are rare or infrequent events and therefore pose additional challenges for accurate prediction. Sampling techniques can be applied to help identify patterns which would otherwise be unseen. Data mining analyses data in order to identify underlying relationships and patterns and the knowledge extracted can be used to develop predictive models (Nyce, 2007, p. 9). By rationalising the trends and relationships in data, knowledge is discovered (Han, et al., 2011, p. 17). Data mining, also referred to as knowledge discovery, is defined as;
“the nontrivial extraction of implicit, previously unknown, and potentially useful information from data” (Frawley, et al., 1992).
8
Department of Transport UK, 2013. Road Accident Safety Data Guide, http://data.dft.gov.uk/road-accidents-safety-data/Road-Accident-Safety-Data-Guide.xls, [Accessed 25 1 2014].
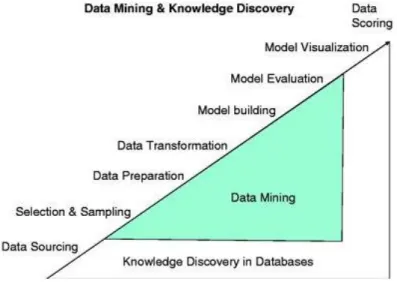
The stages in data mining and knowledge discovery are outlined in Fig. 2.18 and displays the relationship between data mining and knowledge discovery. The key stages in the data mining process are briefly discussed below.
Figure 2. 18 Data mining & knowledge discovery process Source: (Miner, et al., 2009, p. 17)
2.6.1 Dat a underst anding and sel ection
A key stage in the data mining process is the selection of data and often described as data understanding stage. Data needs to be of good quality and clean as the quality of predictive models is only as good as the data used to create them (Eckerson, 2007, p. 12). An understanding of the data characteristics, content and structure should be gained as the nature of the data can affect the selection of appropriate mining and prediction techniques to apply (McCue, 2007, p. 50).
Data quality considerations include accuracy, completeness and consistency (Han, et al., 2011, p. 79). Data quality and volume are vital to ensure the reliability of a predictive model and therefore prior to choosing a dataset an assessment of the data quality should be completed. Data volume is a consideration as a dataset used for predictive modelling must be large enough to be split into training, test and validation data in order to evaluate the model. Training data is used to build a model, test data estimates model accuracy and validation data, validates the model accuracy (Miner, et al., 2009, p. 70). Similarly, enough test and validation data should be available to validate model accuracy. The validation dataset is required as it is not sufficient to report model performance on the basis of a dataset which was used to create the model and the validation data should be kept separate from data included in model building (Miner, et al., 2009, p. 70). The larger the volume of training data available, the more accurate the resulting predictive model is likely to be. The data used for this research is the STATS19 traffic accident dataset.
In data mining, data is structured as continuous data or categorical data. Continuous data relates to numbers such as the number of accidents while categorical data relates to data grouping or categorisation such as road type. Data is typically described in a data description and can include field data type, size as well as descriptive statistics such as mean, standard deviations and data groupings for categorical fields. (Miner, et al., 2009, p. 40) This research will focus on categorical data only.
Uncommon or infrequent data relates to the trends and pattern in data which do not occur very often. Some infrequent patterns in data can contain useful prediction information. However, these patterns can appear so infrequently, data mining techniques can have difficulty capturing this information (He & Garcia, 2009, p. 1265). Where infrequent events exist the dataset may also suffer from class imbalance, where the minority class is limited within the dataset. Data sampling techniques can be applied to data which can make uncommon patterns more prominent in datasets (He & Garcia, 2009, p. 1266).
2.6.2 Dat a preparation and trans form ation
Data preparation involves getting the data ready for modelling stages and involves selecting the data relevant to the experiment, transforming and reshaping the data so it is in a suitable format for analytical modelling (Miner, et al., 2009, p. 40). Data preparation can present many challenges and can be a time consuming stage of predictive modelling (Zhang, et al., 2003, p. 377). By creating a smaller dataset through selection of relevant data only and applying data reduction techniques, such as sampling, significant data mining efficiencies can be achieved (Zhang, et al., 2003, p. 377). Techniques for data transformation reduce the size of the dataset but attempts to minimise the loss of information contained in the data (Han, et al., 2011, p. 111).
A sampling technique consists of building a representative sample of a dataset under the:
‘hypothesis that a classifier trained from that sample will not perform significantly worse than a classifier trained on the entire’ (Aounallah, et al., 2004) dataset. Data sampling techniques are used in data mining to select a representative sample of the data population which estimates the characteristics of the data population under consideration (The SAS Institute, 1998, pp. 16-17). In the context of this research experiment, these techniques will be used to rebalance the traffic accident data so fatal traffic accidents are more prevalent. An additional feature of infrequent events is that their occurrence is often limited in datasets, with features being outweighed by more frequent events. The dataset is then considered imbalanced which poses a problem when extracting relationships in the data, however, sampling techniques can be applied to make the data amenable to prediction. When a class imbalance problem is identified, experimentation with sampling techniques may help improve prediction performance.
Sampling techniques require specialised skill and it can take a significant timeframe to identify the best sample. Where an extreme imbalance exists in a dataset, most algorithms will not perform well and will likely assign the minority imbalance as negative (Ling & Li, 1998, p. 74). For most imbalanced datasets the application of sampling techniques assists in improving classifier accuracy (He & Garcia, 2009, p. 1266).
Undersampling is a technique used in data mining to adjust the class distribution of a dataset in favour of the minority class (He & Garcia, 2009, p. 1266). With undersampling, the majority class is reduced or under sampled (Han, et al., 2011, p. 320) and randomly eliminates data from the majority class until both classes match (Japkowicz, 2000, p. 13). For example, in the case of cancer diagnosis, patients given the all clear are the majority class and patients diagnosed with cancer are the minority class (He & Garcia, 2009). With undersampling, the volume of patients in the all clear class would be reduced to bring them in line with patients diagnosed with cancer. By undersampling the majority class, trends and patterns may be removed from the data that might lead to a worse prediction for the majority class. In SPSS Modeler, undersampling is referred to as majority reduction.
Oversampling is a technique used in data mining to adjust the class distribution of a dataset in favour of the majority class (He & Garcia, 2009, p. 1266). With oversampling, the minority class is increased or over sampled (Han, et al., 2011, p. 320) until the size meets that of the majority class (Japkowicz, 2000, p. 13). For example in cancer diagnosis patients given the all clear are the majority class and patients diagnosed with cancer are the minority class (He & Garcia, 2009). With oversampling, the volume of patients in the cancer class would be increased to bring them in line with patients who were given the all clear. With oversampling, there is a risk of overfitting the minority class to a model (He & Garcia, 2009, p. 1267). Using a validation dataset to test a model trained from oversampled data will provide additional evidence that the model classifies accurately and overfitting has not occurred. In SPSS Modeler, oversampling is referred to as minority boosting.
Class imbalance occurs when the class of interest is rare or infrequent i.e. the majority class far outweighs the rare class (Han, et al., 2011, p. 305). In the case of fatal traffic accidents, the non-fatal accident class far outweighs the fatal accident class. Class imbalanced datasets, when used as training data, can lead to poor predictions for the minority class as the minority class is not prevalent in the dataset.
2.6.3 Model buildi ng and evaluati on
tools, consideration should be given to the appropriateness and availability of modelling tools and the intended use of the model results (McCue, 2007, p. 118). For example, accuracy may sometimes be compromised to produce a model which can be easily understood and actioned. Neural networks provide high degrees of accuracy but it can be difficult to understand the basis of the result, whereas, for decision trees rules can be extracted which can then be interpreted
Evaluation is a key stage in the data mining process and helps to assess the predictive capability of the model and identify the model which performs best (Souza, et al., 2002, p. 1). Specific focus is given to techniques used to evaluate classification models which will be constructed as part of this experiment research such as the confusion matrix, receiver operator curve (ROC) and the area under the curve (AUC).
A confusion matrix is designed to show correct and incorrect predictions (Han, et al., 2011, p. 304). The terminology used to describe correct and incorrect predictions are true positives (TP), false positives (FP), true negatives (TN) and false negatives (FN). It is common for classification models to be evaluated using confusion matrix results. Fig. 2.19 is an example of a typical confusion matrix.
Figure 2. 19 Confusion matrix example Source: (Witten, et al., 2011, p. 164)
Commonly used evaluation measures which can be calculated from confusion matrix results, include accuracy, which measures the percentage of data correctly classified, precision, which measures the percentage of data which are correctly labelled as positive and recall, which measures the percentage of the positive targets labelled correctly (Han, et al., 2011, pp. 305-307).
Accuracy – The proportion of TPs and TNs which were classified correctly. This is also called the accuracy rate.
Recall/Sensitivity - The proportion of TPs which were classified correctly. This is also called the true positive rate.
Precision – The proportion of TP’s which were classified as fatals which were actually fatal.
The ROC curve provides a method to compare classification models (Han, et al., 2011, p. 312). The x-axis represents the false positive rate while the y-axis represents the true positive rate (Han, et al., 2011, p. 312). In this experiment research, the true positive