CHAPTER -4
ANALYSIS AND FINDINGS
This chapter brings out data analysis and interpretations. The data collected from different sources have been organized in order to bring out effective findings and conclusions. The main sources of data collection are the nursing staff, heads of nursing and hospital, hospital records, and observed field data. This chapter is organized into three major main parts namely Part – 1. Demographic Profile and Job Characteristics, Part – 2 Working conditions and facilities provided to the nursing staff, Part – 3 Over view of Quality indicators.
Part I of this chapter is “Demographic Profile and job characteristics”. This provides the findings about the nursing staff background and their work related characteristics. The information presented in this segment is based on the structured interview scheduled administered with 317 nursing staff, data collected from administrative and nursing heads of the sample hospitals (key informant interview) by guided interview schedule and data obtained from the hospital records (secondary data).
Part II of this chapter is “Working conditions and facilities provided to the nursing staff”. This presents the findings of the variables like physical facilities, organisational policies, professional development, work teams, respectful relationship, supervision and management, and service quality and patient safety. The information provided in this segment is based on the structured interview scheduled administered with 317 nursing staff, data collected from head of the hospitals and nursing heads of the sample hospitals by unstructured in depth interview.
Part III of this chapter is “Quality of work life indicators”, this part covers variables like work life balance, absenteeism, work stress, communication, job satisfaction, organisational culture and climate, and nursing staff’ perception on their work performance. There are seven variables covered in this segment.
Chapter – 5 covers the effect of job characteristics and working conditions and facilities on quality of work life of the nursing staff”. In this chapter the findings of key variables of Part-1 and Part-2 are cross examined with Part-3 Quality of Work Life indicators variables to understand “the effect of job characteristics and working conditions and facilities on the quality of work life of nursing staff”. The effect on quality of work life of nursing staff due to demographic profile of nurses, job characteristics, working conditions and facilities is analysed by applying statistical tools like chi-square tests, logistic regression and correlation. Also the data are analysed and presented in the form of cross tables.
The final chapter of analysis is “Chapter-6 Key Informant Interviews on nursing work environment”. In this segment the views shared by the heads of the nursing department like matron, assistant matron and hospital head medical superintendent or chief medical officer examined. A guided interview schedule was used to collect the information from theses respondents. These respondents also called key informants, as they have shared information with regard to nursing staff problems, challenges, work related issues, factors affecting their routine work, working conditions and facilities provided to the nursing staff etc.
Overall in this chapter some of the statistical tools used for analyzing data were percentages, mean, standard deviation, chi-square test etc. Also two way tables were used to describe the variables of the study. In addition to this, a multivariate tool of Logistic regression, has been used to bring out appropriate findings and meet the requirement of study objectives from the available data. In brief these statistical tools have played vital role in exploring the important aspects of the phenomenon and analyzing all important variables of this research study.
PART-1 DEMOGRAPHIC PROFILE AND JOB CHARACTERISTICS Section – ‘A’ Demographic Profile of the respondents
This section provides useful information to understand the demographic profile and job characteristics of the respondents. The respondents are 317 nursing staff who have completed three years of experience in Municipal Peripheral hospitals in Mumbai. The findings below relate to significant aspects of the respondents’ social, economic and job related characteristics.
Age, Education and Experience
Age: The nursing staff age, education and their experience are presented in table 1.1. The mean age of respondents is 42. The standard deviation of age (8) indicates that large numbers of respondents have reached middle age. The middle age group has its own behaviour and associated issues like health, adjustment to working conditions and facilities, promotions and other opportunities. As they grow older the nurses are expected to have improved knowledge and skills, maturity, and commitment to the work. It is also expected that patients would feel confident when the staff which is present is older in age. Also the senior staff would be good sources for providing coaching and training to the young staff at the ward level. They command respect from coworkers and other groups. On the other hand they might resist changes like computerisation, or modernization including use of latest technology because they need to acquire new skills which would be difficult for them to acquire at a older age.
Experience: The mean total experience of respondents is 19 years. The total years of experience of the nursing staff include their current experience in the present hospital and experience in similar BMC peripheral hospitals. The mean years of experience in the present hospital is 15 years. It is clear that the work age of beginner nurses is 23 years (mean age is 42 minus mean total experience 19 equal to 23 years) and before they took up the current positions they had worked on an average of 4 years (total mean experience 19 years minus mean present hospital experience 15 years) in other hospitals including BMC hospitals. The nursing staff have gained long years of experience in the same hospitals. Even though the nursing staff have various opportunities and scope to work in other places including
abroad, they have not moved away. Also it indicates that there is hardly any nursing staff turnover in these hospitals. Since the majority of the staff have continued to serve in the same hospitals it helps the staff to understand the value system of the hospitals and patients’ behaviour, and this facilitates better coordination between the patients and the staff. The nursing staff are able to easily understand the patient background, cultural and social requirement of the patients at the early stage of patients’ stay. As a result, the patients get appropriate support right from the time of their admission into the hospital.
Education: Among the respondents, a majority of the nursing staff, nearly 71 per cent, are qualified with a nursing diploma with Higher Secondary Course (HSC) which is the currently considered as minimum educational eligibility for a staff nurse position. However, 28 per cent of the nursing staff have a diploma in nursing with Secondary School Leaving certificate (SSLC) or Standard X. These nurses are relatively older nurses and had joined the hospitals before the introduction of HSC as a requirement. There is only one per cent of staff who have a degree with nursing diploma or Degree in nursing courses as seen in the sample hospitals. It is seen that there is no necessity for the nursing staff to carry on higher studies as there is no perceived benefit associated with higher qualification. Also there is a reason to believe that majority of the staff have middle age health factors and family responsibilities that undermine any effort of upgrading their qualifications. It is reported that the Indian Nursing Council is trying to bring degree in nursing as the basic qualifications for nursing services where the present qualifications of Staff nurses (diploma in nursing) will be replaced by the degree holders as and when these nursing staff retire. One of the matrons in the study hospitals pointed out that “by 2010 new recruitment will start with only degree in nursing candidates”. In the near future the diploma in general nursing and midwifery holders will be no longer potential candidates in the public hospitals. Also the nursing educational institutions are likely to stop training diploma nurses in the coming years.
TABLE -1.1
Respondents Age, Education, and Experiences
Age of the respondents Present designation Total Staff Nurse Sister
incharges Below 30 yrs 27 (10.2) 1 (1.9) 28 (8.8) 31-35 yrs 48 (18.2) 2 (3.8) 50 (15.8) 36-40 yrs 58 (22.0) 5 (9.4) 63 (19.9) 41-45 yrs 63 (23.9) 7 (13.2) 70 (22.1) 46-50 yrs 42 (15.9) 3 (5.7) 45 (14.2) 51 & above 26 (9.8) 35 (66.0) 61 (19.2) Education X2 = 90.73 P=.000
SSLC with Nursing Diploma 55 (20.8) 34 (64.2) 89 (28.1) H Sc with Nursing Diploma 205 (77.7) 19 (35.8) 224 (70.7)
Others 4 (1.5) 0 (0.0) 4 (1.3)
Total years of experience X2 = 41.21 P=.000
Up to 5 yrs 30 (11.4) 0 (0.0) 30 (9.5) 6-10 yrs 36 (13.6) 3 (5.7) 39 (12.3) 11-15 yrs 89 (33.7) 7 (13.2) 96 (30.3) 16-20 yrs 58 (22.0) 5 (9.4) 63 (19.9) 21-25 yrs 42 (15.9) 12 (22.6) 54 (17.0) 26- & above yrs 9 (3.4) 26 (49.1) 35 (11.0)
Experience in present hospital X2 = 102.39 P=.000
Up to 5 yrs 41 (15.5) 15 (28.3) 56 (17.7) 6-10 yrs 30 (11.4) 5 (9.4) 35 (11.0) 11-15 yrs 70 (26.5) 2 (3.8) 72 (22.7) 16-20 yrs 80 (30.3) 4 (7.5) 84 (26.5) 21-25 yrs 30 (11.4) 7 (13.2) 37 (11.7) 26 & above 13 (4.9) 20 (37.7) 33 (10.4) Total 264 (100) 53 (100) 317 (100) X2 = 68.67 P=.000 (Figures in brackets indicate the percentage of nursing staff) N=317
Family Size and Background
The size of the family includes adults, children and dependents. The details are presented in Table -1.2 Adults, children and dependents. The mean number of adult in the nursing staff family is 3 and the standard deviation is 1.Nursing staff family
size is one of important factors to decide on a professional career because being a female worker they have greater responsibilities to take care of the family members particularly the young children and elderly persons in the family. It is expected that if the family members are adults and are able to manage themselves, the nursing staff have slightly less home responsibilities. Also the adult members are able to understand the nature of nursing profession and try to extend support and cooperation to the nursing staff. Another advantage is that there is a possibility to get financial support from the adult members subject to their earning capacity. However, the nursing staff do have certain responsibilities of supporting the adult members in terms of providing financial support if they are pursuing higher studies, unemployed or any other reason that adds to the tension of the nursing staff.
The mean number of children in the nursing staff family is 1.7 and the standard deviation is 0.6. Nearly 38 per cent have only one child and 57 per cent have two children in the present scenario. A majority of the nursing staff have followed the governmental norm of “we two, ours two”. This is because of the nursing staff’s high awareness on family planning, living in an urban environment, more oriented towards having small and compact families. Another reason for having only one or two children is most of the nuclear family set up wherein the family consists of only the husband and wife and there are no other members, elders or relatives or trust worthy persons, to take care of their off spring. It is to be noted that some the nursing staff mentioned that “young and school going children take much of our time and give us more challenges by demanding more attention, and support.” Another issue is that the nursing staff have to pay more attention to their work because of the above reasons and the nursing have consciously avoided having a larger family.
TABLE -1.2
Nursing Staff Family Members: Adults, Children and Dependents
Number of Adults
Present designation
Total Staff Nurse Sister incharges
Up to 2 102 (38.6) 13 (24.5) 115 (36.3) 3-4 134 (50.8) 26 (49.1) (50.5)160 5-6 25 (9.5) 14 (26.4) (12.3)39 7+ 3 (1.1) 0 (0.0) (0.9)3 Number of children 1 70 (38.3) 12 (38.7) 82 (38.3) 2 106 (57.9) 15 (48.4) 121 (56.5) 3+ 7 (3.8) 4 (12.9) 11 (5.2) Number of dependents X2 = 13.35 P=.004 1 49 (20.8) 15 (32.6) 64 (22.7) 2 122 (51.7) 23 (50.0) 145 (51.4) 3 46 (19.5) 6 (13.0) 52 (18.4) 4 14 (5.9) 1 (2.2) 15 (5.3) 5 3 (1.3) 0 (0.0) 3 (1.1) 6 2 (0.8) 1 (2.2) 3 (1.1) Total 236 (100) 46 (100) 282(100) X2 = 7.28 P=.063 (Figures in brackets indicate the number of nursing staff) N=317
The mean number of dependents in the nursing staff family is 2. Nearly 46 per cent of the nursing staff have two dependents, 20 per cent have only one dependent. These dependents are mostly their own children and in-laws who are staying with the nursing staff. Other than caring for elders and the children who require more attention and well being the nursing staff also provide economic and monetary support to these dependents.
Economic conditions of nursing staff
The smooth functioning of a family unit is connected with various requirements including financial support. In the nursing staff family there are few members earning and providing support. The details of economic support and other aspects are presented in table Table1.3
Majority of nursing staff 74 per cent have two earning members in the family which include self and their spouse. Nearly 13 per cent of the staff have a single earning member that is mostly self income. However, the mean earning member in the nursing staff family is 2 and the standard deviation is 0.7. In normal circumstances, it is expected every male has to work in Indian traditional families. If it is considered the male has to work in addition to that the female member also working so every nursing staff family is supposed to have two earners in a family which brings in an additional economic support for the family.
Nearly 59 per cent of the nursing staff receive a salary between Rs.14000 to Rs.17000 which is a reasonable salary as per the Indian economy, but to earn this salary the staff have to put in at least an average of 19 years of service in the hospitals. The system is such that more the years of experience of the nursing staff, the higher the salary due to yearly increments. The nursing staff average self income is Rs.15,301 per month per person and the standard deviation is Rs.2049. However, the mean income is not the actual take home salary. There are some standard deductions applicable like professional tax, contribution to provident fund, loan recovery, LIC, Income tax etc.
Nearly 39 per cent of staff have a family income of Rs.20001 to Rs.25000. The mean income of the family is Rs.22,831. The difference between the self-income and family income is Rs.7530 per month. It means, on an average, extra income other than self generated is Rs.7530 per month. In other words, the spouses’ earning is really low when compared to that of the nursing staff. In such situations if the nursing staff do not work, the family is likely to face economical crises. Even though there is an average of two persons who earn in the nursing staff family, many nursing families depend on the nursing staff income as main source of income. Therefore, even if a nurse wishes to leave her job she cannot leave the job.
The total family members are 1742 which includes 1024 adults and 359 children. The per capita income of the family members is Rs.4155 person per month which include the both the self and spouse. If the children are excluded from the calculation of per capita income it works out Rs.7068. While comparing the
nursing staff family members’ per capita income Rs.4155 with national per capita income Rs.3333 per month per person (World Bank Report, 2007) the nursing staff family members have a higher per capita income per month.
TABLE1.3
Economic Support and Income Status of the Staff
Occupation of spouse
Present designation
Total Staff Nurse Sister incharges
Unsecured job 179 (73.7) (34.7)17 196 (67.1)
Secured job 51 (21.0) (30.6)15 66 (22.6)
Retired 13 (5.3) (34.7)17 30 (10.3)
Number of earning members in the family X2 = 55.94 P=.000
1 32 (12.1) 8 (15.1) 40 (12.6) 2 205 (77.7) 29 (54.7) 234 (73.8) 3 15 (5.7) 10 (18.9) 25 (7.9) 4 8 (3.0) 4 (7.5) 2 (3.81) 5 3 (1.1) 2 (3.8) 5 (1.6) 6 1 (0.4) 0 (0.0) 1 (0.3)
Monthly self income X2 = 17.71 P=.003
Up to Rs. 8000/- 3 (1.1) 0 (.0) 3 (.9)
Rs.8001-11000/- 7 (2.7) 0 (.0) 7 (2.2)
11001-14000 82 (31.1) 4 (7.5) 86 (27.1)
14001-17000 158 (59.8) 31 (58.5) 189 (59.6) 17001 & above 14 (5.3) 18 (34.0) 32 (10.1)
Monthly family income X2 = 46.930 P=.000
Rs.10000 -15,000 17 (6.4) 1 (1.9) 18 (5.7) Rs.15001 to Rs.20000 68 (25.8) 11 (20.8) 79 (24.9) Rs.20001to Rs.25000 106 (40.2) 17 (32.1) 123 (38.8) Rs.25001to Rs.30000 51 (19.3) 21 (39.6) 72 (22.7) Rs.30001 to Rs.35000 9 (3.4) 2 (3.8) 11 (3.5) Rs.35001 and above 13 (4.9) 1 (1.9) 14 (4.4) Total 264 (100) 53 (100) 317 (100) X2 = 11.74 P=.038
(Figures in brackets indicate the number of nursing staff) N=317
Nearly 51.7 per cent of the spouses are working in private companies and 14.5 per cent work in Government organisations. Further, the jobs are classified under secured and not so secured to have clear view about the nature of job and how they meaningfully support the nursing staff family. It is found that nearly 59.3 per cent
of the spouses of the nursing staff are working in private companies and the casual work sector that are both unsecured. However 20.8 per cent of the spouses of nursing staff are working in secured positions like government job, corporations, banks etc. Secured job and unsecured job makes lot of difference in the nursing staff mindset. It has been observed that some nursing staff are very happy to mention the occupational status of their husband only if he possesses a secured or white-collar job or runs his own business. On the other hand, if the staff’s spouse has a job in the private sector or in employed in a temporary occupation, the staff mentions their spouse’s occupation with some hesitation. Some of the staff stated that their husbands are not willing to take up a job. This increases their mental tension and there is no financial support from their spouse.
Nursing staff’s Marital Status, Religion and State of Origin
Nursing staff’s marital status, their religion and the state of origin is presented in table number 1.4. Among the respondents nearly 92 per cent are married and only 6 per cent are unmarried. Married nursing staff have many problems which include time pressure, developing professionalism, raising and managing the children and other work related issues. Some of the nursing staff mentioned that their children are latch-key kids. It is because there are no facilities in the work place or there is nobody is to take care of the children at home and childcare facilities are either easily available or expensive. Many senior nursing staff have reported that because of the work shifts they have missed out on enjoying quality time with their children.
The majority of the nursing staff i.e. 84.5 per cent belongs to Hindu religion and nearly 13 per cent of the staff are Christian. The nursing profession and religion are traditionally closely associated. Nursing services were introduced in India by missionaries and later it was recognised as a profession in the country. Since the beginning Christians used to take up nursing as a profession and make it their career choice. It is perceived that there is no practice of taking nursing as a career choice in Hindu communities. But in the study of hospitals it has been found that majority are belonging to Hindu religion. It shows that the religion is no long longer a factor when choosing the nursing profession and secondly that Hindu families have accepted that their children have a right to choose nursing as profession. Another
reason for accepting nursing a career choice is that it gives enough employment opportunities for women in private, government and corporations which in turn provides a constant source of income to the family. Moreover, the women irrespective of any religion who takes up nursing profession get satisfaction while serving the community.
The majority of the staff (91 per cent) are Maharashtrians and only 6 per cent hail from Kerala. It shows that the recruitment is restricted to only within the state of Maharashtra. The Maharashtrians being localities can understand the local languages of the state, the difficulties of the patients and are able to communicate with the patients without any language barrier. However, there are certain issues associated with the present system – in case the hospitals need more number of nursing candidates to compensate the existing shortage or additional requirements if any it would be difficult to identify workforce within the state because there may be inadequate number of nursing candidates who are trained within the state and there is scope for such candidate to migrate aboard.
TABLE – 1.4
Nursing Staff Marital Status, Religion and State of origin
Variables
Present designation
Total Staff Nurse Sister incharges
Current marital status
Unmarried 17 (6.4) 2 (3.8) 19 (6.0) Married 243 (92.0) 49 (92.5) 292 (92.1) Widowed 3 (1.1) 2 (3.8) 5 (1.6) Divorced 1 (0.4) 0 (0.0) 1 (0.3) Religion Hindu 222 (84.1) 46 (86.8) 268 (84.5) Muslim 4 (1.5) 1 (1.9) 5 (1.6) Christian 36 (13.6) 5 (9.4) 41 (12.9) Others 2 (0.8) 1 (1.9) 3 (0.9) State of origin Maharashtra 242 (91.7) 47 (88.7) 289 (91.2) Kerala 13 (4.9) 5 (9.4) 18 (5.7) Karnataka 3 (1.1) 0 (0.0) 3 (0.9) Other states 6 (2.3) 1 (1.9) 7 (2.2) Total 264 (100) 53 (100) (100)317
Travelling between the workplace and residence and related matters
The details of place of stay, travel distance, mode of transport, duration of travel and amount spent on travel are discussed in table 1.5. Most of the respondents stay in different locations and are spread all over Mumbai and its suburban areas. The respondents stay in nearly 60 different locations. Nearly 13.6 per cent of the respondents stay in Borivili. This is the highest concentration of staff in a single location. Many respondents stay far away from their work place. In Mumbai most of the areas are well connected with the transport facilities. Since the nursing staff follow the shift system and the duty timings are different from non-peak hours it would be possible for them to travel easily. The nursing staff are not provided with quarters. Hardly any staff have got accommodation within the hospitals. Even if the hospitals provide quarters some of the staff members hesitate to occupy such facilities because they have to work as substitutes or relievers and have to be available 24 hours on call. In fact, a few nursing staff complained that “they have been used very frequently as a substitute for absentees”.
A majority of the nurses, nearly 55 per cent, stay close to their work place, within 5 kilometers, and another 11 per cent of the staff stay between 16 – 20 kilometers. The mean distance between workplace and the place of residence is 11 kilometers and the standard deviation is 18 kilometers. The nursing staff have an option of choosing from a variety of modes of transport. Nearly 43.8 per cent of the nursing staff travel by train while 29.3 per cent travel by bus. Usually, the nursing staff use multiple modes of transport to reach the hospital. The nursing staff use train and auto or train and bus etc. because the work place is far away from the railway station or sometimes the residence is far away from the railway station. Using multiple modes of transport increases travel fatigue and this results in an attitudinal change in the work place as well in the family set up. The nursing staff that use only trains as their mode of transport feel that is faster and cost effective but are uncomfortable to the overcrowding that Mumbai trains are famous for.
TABLE-1.5
Travel to Work Place and Related Issues
Variables Present designation Total Staff Nurse Sister incharges Mode of transport Walk (8.7)23 5 (9.4) 28 (8.8) Auto (2.3)6 1 (1.9) 7 (2.2) Bus (29.5)78 11 (20.8) 89 (28.1) Train (44.7)118 28 (52.8) 146 (46.1)
Train and Auto (1.1)3 0 (0.0) 3 (0.9)
Bus and Train (11.0)29 8 (15.1) 37 (11.7)
Own vehicle (2.7)7 0 (0.0) 7 (2.2)
Distance between the work place and residence
Upto 5 kms 150 (56.8) 23 (43.4) 173 (54.6) 6-10 kms 25 (9.5) 5 (9.4) 30 (9.5) 11-15 kms 19 (7.2) 4 (7.5) 23 (7.3) 16-20 kms 27 (10.2) 8 (15.1) 35 (11.0) 21-25 kms 13 (4.9) 1 (1.9) 14 (4.4) 26-30 kms 4 (1.5) 1 (1.9) 5 (1.6) 31-35 kms 5 (1.9) 1 (1.9) 6 (1.9) 35+ kms 21 (8.0) 10 (18.9) 31 (9.8) 4-5 hours 17 (6.4) 4 (7.5) 21 (6.6)
5 & above hours 26 (9.8) 8 (15.1) 34 (10.7)
Amount spent on travel
No expenses 25 (9.5) 3 (5.7) 28 (8.8)
Up to Rs.200 32 (12.1) 5 (9.4) 37 (11.7)
Rs.201-400 96 (36.4) 15 (28.3) 111 (35.0)
Rs.401-600 64 (24.2) 16 (30.2) 80 (25.2)
Rs.601 & above 47 (17.8) 14 (26.4) 61 (19.2)
Total duration of away from residence
8-9 hours 49 (18.6) 4 (7.5) 53 (16.7)
9-10 hours 172 (65.2) 37 (69.8) 209 (65.9)
11-12 hours 37 (14.0) 10 (18.9) 47 (14.8)
13 & above hours 6 (2.3) 2 (3.8) 8 (2.5)
Total 264 (100) 53 (100) 317 (100)
(Figures in brackets indicate the number of nursing staff) N=317
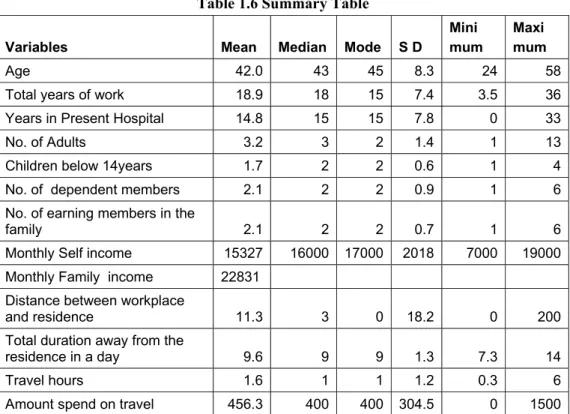
The mean time spent on travel is 1.4 hours (table1.6). Nearly 32 per cent of staff stay close to the hospital hence they spend just about 15 minutes on travel to and
from the workplace. Nearly 28 per cent of the staff spend one hour on travel and another 21 per cent spend two hours on travel. Many nursing staff have their own houses in suburban areas. They have got these houses in suburban areas because the cost of flats is relatively cheaper there, but these places are considerably far from their work place. It is to be noted that a majority of study hospitals located in suburban areas and all the hospitals have been well connected with transport systems and this saves a lot travelling time. However, the nursing staff have to face a crowd while travelling even though they may travel in non-peak hours. There are many occasions the staff face traffic problems especially when they travel by bus. This delays them when reaching the hospital or home. The nursing staff spend a reasonable amount of their income on travel since majority of the respondents travel by train which is relatively cheaper and faster transport service.. The mean travel expenses is Rs.455 per month and the standard deviation is Rs.305. Nearly 30 per cent of the staff spend Rs.201 to Rs.400 as monthly travel expenses. Only 11 per cent of the staff spend less than Rs.200 as monthly travel expenses.
The nursing staff spend more than one third of the day away from their family. The usually are at work or are travelling and these two constitute the total time spent away from the residence. The nursing staff’s mean time away from the residence is 9 hours and 40 minutes and standard deviation is 1 hour 30 minutes. Nearly 32 per cent of the nursing staff have indicated that they spend up to 8 hours in the hospital and another 31 per cent of the staff spend 8-9 hours in the hospital. In fact, nearly 63 per cent of the above two categories 32 +31 of the nursing staff reported that they spend less than 9 hours which is comparatively lower than the mean time. It is reported that staying longer hours away from the residence affects the personal life particularly managing the children’s education, emotional support and well being. It is to be noted that when the mother is away for longer hours, children are likely to get upset and learn abnormal behaviour. There is significant association between the travel time and distance traveled by the nursing staff (r = 0.513). The table 1.6 presents the summary of statistics used in chapter-4 Section -A.
Table 1.6 Summary Table
Variables Mean Median Mode S D
Mini mum
Maxi mum
Age 42.0 43 45 8.3 24 58
Total years of work 18.9 18 15 7.4 3.5 36
Years in Present Hospital 14.8 15 15 7.8 0 33
No. of Adults 3.2 3 2 1.4 1 13
Children below 14years 1.7 2 2 0.6 1 4
No. of dependent members 2.1 2 2 0.9 1 6
No. of earning members in the
family 2.1 2 2 0.7 1 6
Monthly Self income 15327 16000 17000 2018 7000 19000 Monthly Family income 22831
Distance between workplace
and residence 11.3 3 0 18.2 0 200
Total duration away from the
residence in a day 9.6 9 9 1.3 7.3 14
Travel hours 1.6 1 1 1.2 0.3 6
Amount spend on travel 456.3 400 400 304.5 0 1500
Section B: Job Characteristics
1. Nursing organisation in the sample hospitals
Nursing department in Peripheral hospitals follows a simple organisational structure. The structure consists of only five categories and the details are presented in chart-1. The highest position in the hierarchy is Matron. She is the overall In-charge of all the functions of the nursing department as well the nursing care system in the hospital. The second in command in the hierarchy is Assistant Matron. She provides administrative support in terms of supervising, organisation of functions, interacting with all ward staff, taking the charge of all the nursing functions in the absence of Matron. The third level is sister In-charge. She reports to assistant matron or matron. She is provided with a set of responsibilities which will be carried out on day-to-day basis. The sister in charge is a ward level staff and provides support and facilitation to the staff nurses. The next category is staff nurse position. Staff nurse carries out the nursing duties at the ward level and she is responsible for the implementation pf the entire nursing programme. The last rung of the hierarchy ladder is the ANM staff. The ANM staff assist in wards,
particularly labour wards and maternity wards, in some hospitals. Once the ANM staff get retired they are replaced by staff nurse.
Chart-1 Nursing organisational chart in BMC Peripheral Hospital
The matron and the assistant matron were interviewed separately through in-depth interviews to bring out insights of study variables. The sister in-charge and staff nurses were interviewed through structured questionnaires. The number of respondents (sisters in-charge and staff nurses) participated in the study is presented in chart-2. The information shared by matron and assistant matron along with head of the hospitals is presented separately.
Chart-2 Percentage of staff participated in the study Representation of staff for the study
17%
83% Sister in charge
Staff Nurse
Among the respondents nearly 83 per cent are staff nurses and 17 per cent are sister incharges. The sister incharges are senior staff work in the ward along the supervisory responsibilities. While comparing the staff nurse and sister incharges, the staff nurses are higher in number as they are the field staff. Accordingly, the
Matron Assistant Matron
Sister in charge
Staff Nurse
adequate and appropriate representation of these categories participated in the study.
The nursing staff from various departments which include Outpatient Services, Casualty, Operation Theatre, Burns Ward, Intensive care Unit (ICU), Medical Intensive Care Unit (MICU), Pediatric Intensive Care Unit (PICU), Premature Ward, Pediatric Ward, Trauma Intensive Care Unit (TICU), Male Surgical ward, Male Medical ward, Male Ortho ward, Eyes Ear Throat ward (ENT), Female Surgical Ward, Female Medical Ward, Female Ortho ward, Labour ward, Obstrics and Gynecology ward (OBG), etc. participated in the study. For the purpose of analysis all these wards are classified into five major categories. They are General wards, Critical care units, Operation Theatre (OT), Emergency Services and OPD services. The departments representation are presented in chart-3.
Chart-3 Present departments of the participants of the study
Nursing staff present departments
7%
55% 7%
17%
14% Out Patient Services
General Ward Services Emergency Services Operation Theatre Services Critical Care Services
It is found that there is an appropriate representation from each department for the study.
Nearly 55 per cent from general wards, 17 per cent from operation theatre, 14 per cent from critical care units, 7 per cent from emergency services and 7 per cent from OPD services nurse have participated in the study. In every hospital usually 5 to 10 per cent of the beds are provided for critical care services, and nearly 80 per cent of the beds are general wards. The staff distribution is done in accordance with the nature of care provided by the hospital.
2. Nursing work activities
The nursing staff are trained in three and half years in professional training institutions. During this period they are provided with appropriate training in all the areas of clinical and some aspects of non-clinical services so that they can easily handle the patient care. When they join hospitals they are provided with variety of opportunities in various work settings like different wards including general wards, critical care wards, operation theatre and outpatient services. Even though the nursing staff are capable of doing multiple tasks but they cannot do all the work at a time. So it is important to prioritise work logically. Sometimes they continue to perform a variety of complex functions and across various chains of activities so it is very important to specify what work they have to do and when they are supposed to do them. This specification can be called job description. The nursing staff’ duties and responsibilities are clearly specified in the job description. This ensures that the staff can work in a focused way and that their time is utilised effectively to achieve better patient care. The nursing staff job description is enclosed in appendix -4.
Keeping this in view, the nursing staff are asked to spell out whether they are doing their work as per their job descriptions or not. Nearly 19 per cent of nursing staff reported that they do work other than the nursing work. The details are presented in Table 1.7. It is observed that many nursing staff do non-nursing work and they consider these tasks are part of the nursing care such as clerical work, inventory management, handling of patient visitors, management of class IV staff etc.
Table 1.7
Nursing staff working as per your designation/job description
Are you doing work as per your designation/job description?
Present designation
Total Staff Nurse Sister incharges
No 49 (18.6) 11 (20.8) 60 (18.9)
Yes 215 (81.4) 42 (79.2) 257 (81.1)
Total 264 (100.0) 53 (100.0) 317 (100.0)
(Figures in brackets indicate the percentage of nursing staff) N=317
This is because of lack of clarity of proper guidelines about the work they suppose to carry out. In the absence of specific guidance or written guidelines the staff managing their work based on the basic training received from nursing school during their studentship. As a result these nurses continue to provide service with
their age old practices and there is no possibility of ushering in modern methods of nursing practice. Details of non-nursing activities performed are presented in Table1.8
Table 1.8
List of selected non-nursing activities performed by the nursing staff
Non-nursing activities performed by the nursing staff
Present designation
Total Staff Nurse Sister incharges
Blood transfusion, inserting I V to the patients
19 (38.8) 5 (45.4) 24 (40.0) Controlling the visitors, shifting patients
one place to another 2 (4.1) 0 (0.0) 2 (3.3) Election duty, and other government work 3 (6.1) 1 (9.1) 4 (6.7) Giving kidney tray, pulling the Oxygen
cylinder 11 (22.4) 2 (18.2) 13 (21.7)
Indenting of material, and maintenance of
inventory in the ward 6 (12.2) 2 (18.2) 8 (13.3) More clerical work includes reports,
registers and formats 6 (12.2) 0 (0.0) 6 (10.0) Taking lecture on cleanliness, and hand
washing procedures 2 (4.1) 1 (9.1) 3 (5.0)
Total 49 (100.0) 11 (100.0) 60 (100)
(Figures in brackets indicate the percentage of nursing staff) N=60 As mentioned in table 1.8 the nursing staff carry out some of the work which are not in their regular profile, however, they have continue to do so because it became their practice. The nursing staff feel that all these non-nursing work may be a part of the job description of the doctors or the house keeping staff or the administrative staff. The usual non-nursing work which the nursing staff regularly perform are blood transfusion, inserting the IV, giving kidney tray, pulling the Oxygen cylinder, controlling the visitors, shifting patients one place to another clerical work, election duty, providing training, lecture to class IV staff etc. It is confirmed that the hospitals have documents formalising the job descriptions and the staff have seen such documents but do not have copy of this document in hand. In the absence of formal guidance or standards the nursing staff are unable to compare or conclude whether they do more or less or optimal work or the work they do which really is part of their formal work profile.
The nursing staff have a set of responsibilities. These responsibilities could be achieved by developing better relationships. For making a strong foundation for creating relationship among the staff there are several methods that are used in hospitals- one among them is staff orientation. According to table 1.9 nearly 12 per cent of the staff mentioned that they do not have any formal introduction or orientation programme when they joined the hospital. Nearly 40 per cent of staff reported that they were orientated by the Matron and another 35 per cent by their own colleagues.
Table 1.9
Orientation programme for the nursing staff
At time joining orientation conducted by
Present designation
Total Staff Nurse Sister incharges
Supervisor 24 (9.1) 11 (20.8) 35 (11.0) Matron 108 (40.9) 18 (34.0) 126 (39.7) Colleagues 93 (35.2) 16 (30.2) 109 (34.4) None 31 (11.7) 7 (13.2) 38 (12.0) Sister-in-charge 38 (3.0) 91 (1.8) 49 (2.8) Total 264 (100) 53 (100) 317 (100)
(Figures in brackets indicate the percentage of nursing staff) N=317
The staff orientation is conducted by different persons using different methods at different points of time. This shows that the hospitals do not have any formal orientationprogramme for the staff. Also there is no clear protocol available for the new recruits in terms of acquaintance with information such as hospital rules, policies, type of patients and about the hospital. It is perceived that formal orientation programmes brings better understanding between the employees and management. Similarly, orientating the staff in the work place is necessary to improving the social psychological quality of mindset that people have about the work that they perform. It creates conducive sentiments and emotional feelings that people associate with their work and thereby improves their work quality. . Finally, work orientation refers to the symbolic ideas, belief, and emotions that a worker has about their work-related experience. Work orientation creates a person’s sense of self. Once the staff get oriented about the working pattern they usually adapt efficiently to the hospital working system.
Organisation of work shift and Duty System
In the study hospitals the duty roster is prepared systematically and distributed in each ward. According to table 1.10 almost all the nursing staff (98 per cent) say that there is a duty roster and it is followed without fail. Usually the duty list is prepared for one full month by the matron. Once the duty roster is ready, it is put in place and everybody follows the duty roster without fail. In case the staff fail follow the duty roster they are punished with salary deduction or being marked as absent for two days known as double day absent. Sometimes it may be difficult for the staff to follow as per the schedule. In such a situation it is necessary to bring some flexibility to modify or change their shift timings. It has been found that nearly 68.8 per cent of the nursing staff feel that they had an opportunity to modify or change the shift for meeting their requirements. The remaining members did not have a chance to modify their shits for their personal emergencies. Developing quality work environment needs flexibility in the work schedule.
Since the nursing staff follow the shift system they usually have some problems. The nursing staff considers that doing shift duty particularly night duty is a major drawback of nursing profession. Keeping this in view, the nursing staff were asked to report on this issue. In case they get an opportunity to choose the duty, the majority of the respondents (nearly 83 per cent as per table 1.10) would prefer to do morning shift and nearly 16 per cent have given their preference to do afternoon shift while hardly any staff (less than one per cent) is interested in doing night duty. It shows that nursing staff are doing their duty mostly against their wishes. However, their service is needed 24 hours and somebody has to be there with the patients. So there is no option for staff to withdraw from doing night duty or shift duties. Another interesting observation is that the younger nurses like to do morning shift due to their family commitments. Similarly, the elder nurses feel that they should be given morning shift because they have served several years round the clock services and at this stage of life in their middle age or old age with the attendant health issues they should get some relief from doing night shifts. It is very difficult for the nursing management to handle these issues.
Table 1.10
Nursing of Duty system and Flexibility
Variables
Present designation
Total Staff Nurse Sister incharges
Do you have duty roster?
No (1.9)5 (1.9)1 (1.9)6
Yes (98.1)259 (98.1)52 (98.1)311
Which shift do you prefer?
Morning (82.2)217 (86.8)46 (83.0)263
After noon (17.0)45 (13.2)7 (16.4)52
Night shift (0.8)2 (0.0)0 (0.6)2
Do you have an opportunity to modify or change your shift timings for an
emergency or family reason?
No (32.6)86 (24.5)13 (31.2)99
Yes (67.4)178 (75.5)40 (68.8)218
How many times have you been able to avail this? Never (55.7)147 (39.6)21 (53.0)168 Sometimes (34.1)90 (39.6)21 (35.0)111 Frequently (5.7)15 (9.4)5 (6.3)20 Very frequently (4.5)12 (11.3)6 (5.7)18 Total (100)264 (100)53 (100)317
(Figures in brackets indicate the percentage of nursing staff) N=317
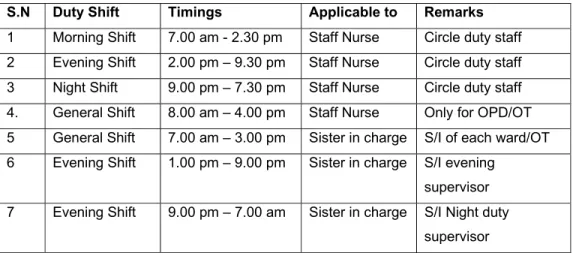
Shift timings and Official break between the shifts
The nursing department maintains proper working system by preparing a duty list, leave plan and allocating the staff to respective wards. Table 1.11 shows the clear plan on the timings between each shifts (duration for each shift).
Table 1.11 Shift Timings
S.N Duty Shift Timings Applicable to Remarks
1 Morning Shift 7.00 am - 2.30 pm Staff Nurse Circle duty staff 2 Evening Shift 2.00 pm – 9.30 pm Staff Nurse Circle duty staff 3 Night Shift 9.00 pm – 7.30 pm Staff Nurse Circle duty staff 4. General Shift 8.00 am – 4.00 pm Staff Nurse Only for OPD/OT 5 General Shift 7.00 am – 3.00 pm Sister in charge S/I of each ward/OT 6 Evening Shift 1.00 pm – 9.00 pm Sister in charge S/I evening
supervisor 7 Evening Shift 9.00 pm – 7.00 am Sister in charge S/I Night duty
supervisor
Sister in charge and senior staff nurse usually do general duty which consists of 8 hours. In addition to some of the staff nurses who are young mothers, older nurses with lots of years of experience (on the ground of health problems) are given general duty as per the decision of matron office.
The nursing staff is expected to work a minimum of 24 days in different shifts in a month and the remaining 6 days are given as day-off generally in between a shift change. Each shift has specific duration for example night shift has 10 hours duty and day duties usually last 7.30 hours. The system is rotated to ensure that all the staff nurses and the sister incharge shall undergo a similar system for every month. The details are presented in the table as given below:
Table 1.12
Work shift hours for a Month Sl.No Duty
shift No. of days Actual work hours of Staff Nurse Actual work hours of Sister in-charge
1 Night shift 06 days 10 hours per shift 10 hrs x 6 days = 60 hours
10 hours per shift
10 hrs x 6 days = 60 hours 2. Morning
shift
12 days 7 and half hours per shift 7.5 hrs x 12 days = 90 hours
8 hours per shift
8 hrs x 12 days = 96 hours 3. Evening
shift 06 days 7 and half hours per shift 7.5 hrs x 6 days = 45 hours
8 hours per shift
8 hrs x 6 days = 48 hours
4. Day off 06 days - -
Total 30 days 195 hours in a month Total hours = 204 – 16 = 188 hours*
* Half day leave @4 hours per day for 4 weeks (4hrs x 4 days) =16 hours (Sources: Duty Roster, at the matron office)
Circle duty system is common in all the hospitals. The sister incharges do mostly morning shift and night duty weekly once. The night duty may increase or decrease depending on sister incharges positions available in the hospital. As per the current nursing duty roster the nursing staff do which include day and night duty for 195 hours and sister incharge 188 hours in a month. The sister in-charge is provided with half a day leave every week in addition to their four offs in a month.
Official Break: Break is essential for the staff in between the hectic work schedule. It is found that different practices are followed in the hospitals. In fact there is no clear rule which specify the break between the work shifts. In this regard nearly
58.4 per cent of the nursing staff reported that they have the privilege of getting official break during shift and another 38.5 per cent of the staff reported that they have no official break during the shift. The details are presented in Table 1.13 Number of breaks during the shifts: Nearly 59 per cent of the respondents enjoy one break in the morning shift as per table 1.13. Nearly 99 per cent say that there is no official break in the afternoon and night duty. It shows that there is a lack of clear guidance regarding providing breaks to the nursing staff in the hospitals. The reason for not providing official break is because the nursing staff are expected to provide patient care 24 hours and leaving the patients may hamper the treatment. Therefore, there is no official break or fixed time of break during the shift. A practice followed in the hospitals is that if there is an adequate number of staff present in the ward, there is an increased likelihood for the staff members to get a break during their shifts. Also there is a possibility of getting a break if there is a reliever who will come and take over the duty. Even though there is no official break the nursing staff are permitted to take a break anytime during their shift unofficially when there is less work load in the ward.
Duration of Break: The respondents have indicated that the mean duration of break is 31 minutes in the morning shift. It ranges between15 minutes to 60 minutes. It is very important to note the break is given only in the morning shift and general shift and there is no break in the afternoon or night shift.
Table 1.13
Break in between the shifts and frequency of breaks
Opportunity for getting break between the shifts
Present designation
Total Staff Nurse Sister incharges
No (39.8)105 (32.1)17 38.5)122
Yes (56.8)150 (66.0)35 58.4)185
Morning shift: No. of Breaks
No break (40.9)108 (30.2)16 39.1)124
One break (59.1)156 (69.8)37 60.9)193
Average Duration of each-Morning Shift
15 minutes (0.6)1 0.0)0 0.5)1
30 minutes (95.5)149 86.5)32 93.8)181
40 minutes (3.2)5 13.5)5 5.2)10
60 minutes (0.6)1 0.0)0 0.5)1
Total (100)264 100)53 100)317
Practical constraints and suggestions regarding break:
The staff members are unable to enjoy the break because it does not have official status. On the other hand, even if the hospital allows them to take a break; it would not be possible for them to take a break because of the non-availability of relievers for the staff. In addition to that if the nursing staff work load is heavy in the busy wards, the patients need constant attention of the nursing staff and it would be difficult for the nurses to move away from their wards. These are the practical constraints which affect the nursing staff and do not allow them even a break to relax form their work pressures.
The staff nurses and sister incharges suggest that one break of 30 minutes should be provided in each shift or at least 15-30 minutes should be given as a break in between the shift particularly in the afternoon shift. Nursing staff also should be given break like any other administrative staff. Some of the staff feel that the present system of giving one break in the morning shift and no breaks in the other shifts should be continued. However, it is not acceptable to some of the other staff members. Furthermore, some of the nursing staff suggest that the break should be according to the work load and if there is less or no work load then the staff is likely to get a break. Giving official breaks or increasing their frequency may affect patient care. There is a lack of unanimous consensus among the nursing staff about the changes needed in the break system.
Double duty
In BMC hospitals double duty is common. Double duty means the staff has to continue to work one shift after another for two shifts in single day. In other words, the staff does two work shifts without having any break. In the study hospitals a majority of the staff (80 per cent) reported that they do double duty in a single day. The double duty is a convenient tool for the nursing management to make up for the immediate shortage of staff or absenteeism. There are various reasons for the staff doing double duty in the hospitals, such as shortage of workforce, increased work load in the hospital (work load increases whereas actual number of staff is remain the same), staff members’ frequent absenteeism either for short period or due to
long leave, lack of substitutes to meet the additional staff requirements, etc. It is observed that at a given point of time nearly 10 to 15 per cent of the staff are on long leave. Also, the double duty depends on seasonal requirements, particularly during the children’s Board examinations, summer and festival seasons as during this period a large number of staff apply for leave. The hospital management finds it very difficult to put strict rules in place against the staff wishes. Nearly 66.7 per cent of the staff report that they do double duty occasionally, 29.6 per cent say that they are required to do so once or twice in a month and another 3.6 per cent say that they have to do double duty every week. It shows that double duty has become inevitable in the hospitals. If the hospital avoids double duty then the patient care may get affected due to non-availability of the staff during the shift. At the same time if the double duty norm continues, the staff get tired and there is a possibility of adverse effects in the ward like compromise on quality of patient care and lack of attention given to the patients. Also there is a possibility that with less number of staff posted in the ward the staff present have to take on the entire work load and work under a lot of pressure.
Table 1.14
Double duty, compensation for double duty
Variables
Present designation
Total Staff Nurse Sister incharges
Are you doing double duty?
No 44 (16.7) (37.7)20 64 (20.2)
Yes 220 (83.3) (62.3)33 253 (79.8)
How often do you do double duty?
Weekly once 9 (4.1) (0.0)0 9 (3.6)
Monthly once /twice 64 (29.1) (21.2)7 71 (28.1)
Occasionally 47 (66.8)1 (78.8)26 173 (68.4)
In what ways is the double duty was compensated?
Day off 224 (97.8) (100.0)42 266 (98.2)
Monetary 5 (2.2) 0.00 5 (1.8)
Total 264 (100) 53 (100) 317 (100)
(Figures in brackets indicate the percentage of nursing staff) N=317 The staff double duty is compensated by providing a compensatory off. There is no monetary support for doing double or extra duties in the hospital. Providing compensatory off has its own side effect in that a staff who does double duty would take the compensatory off along with her regular off creating a larger gap in a
situation already overwrought with lack of human resources that led to the existing staff having to do double duty in the first place. This means the cycle of double duty will never end. Since there is a heavy shortage of nursing staff in the hospital and very less scope for avoiding double duty in the hospitals it becomes necessary for the hospital to keep attractive incentives for the staff who do double duty. In this way the hospital can avoid work pressure among the staff and would able to cope with the situation.
Nursing work force, work load and job rotation
Hospitals are facing an acute shortage of work forces. There are several reasons for this shortage. The shortage of staff really affects the patient care, however, the hospitals do try to provide patient care with the available resources. On the other hand, it may be difficult to provide even minimum level care when the number of staff is reduced beyond a certain limit as it creates distress among the staff. At this stage it has become very important to look at the work force of the study hospitals. BMC has provided certain guidelines with regard to minimum staffing requirement i.e. sanctioned posts for these hospitals. Sanctioned post is the minimum number of staff who should be available to accomplish the tasks (work load) of the hospitals. The details of staff position in the study hospitals are presented in table 1.15 There is always some vacant position exist in the hospitals. The current situation in the study hospitals is presented in table 1.15.
Table 1.15
Nursing workforce in the Study Hospitals
Hospital
Staff nurse Sister in charge Total
SP FP VP SP FP VP SP FP VP Bhagawathi Hospital, Borivili 135 124 11 19 17 2 154 141 13 V N Desai Hospital, Santacruz 81 74 7 13 10 3 94 84 10 K B Bhabha Hospital, Kurla 80 70 10 12 12 0 92 82 10 M T Agarwal Hospital, Mulund 51 43 8 15 12 3 66 55 11
Satapti Hospital, Govandi 67 56 11 8 7 1 75 63 12
Total 414 367 47 67 58 9 481 425 56
SP=Sanctioned posts, FP= Filled posts, VP= Vacant Posts
The study hospitals have an overall of 481 sanctioned nursing posts, 433 filled posts and 56 vacant posts which include both staff nurses and sister incharges. The overall vacant posts constitute nearly 11.3 per cent. Among the staff nurse nearly 8.8 per cent are vacant and of the sister in-charge 13.4 per cent positions are vacant. It is very important to note that the sanctioned posts are the minimum needed staff for providing patient care which is decided by the competent authority at the higher level, however, in not one hospital has it been filled completely. This has a direct impact on the ward services and when the patient need care nursing staff may not be available to help them. In other words, the staff plan the services and do the services and not as per the patient’s needs because they have to give basic care to everybody and if they have additional time they may see to the supplementary needs of the patients. The staff shortage is a universal problem all over the country and world. The majority of the nursing staff (90 per cent) have reported that there is a shortage of staff nurses in the hospitals which lead to various problems not only for the staff, but also for the patients. The nursing staff position available is shown chart-4.
Chart-4 comparison of sanctioned posts, filled posts and vacant posts
0 50 100 150 200 250 300 350 400 450
Staff Nurses Sister
Incharges
Sanctioned posts Filled Posts Vacant Posts
Furthermore, a considerable number of staff have expressed their feelings that shortage of staff has created more work pressure and health problems for the staff. Yet, there is another important aspect need to be examined is comparing the sanctioned positions with nursing council norms. The number positions needed for each hospital is presented in table 1.16.
Table 1.16
Nursing staff requirement as per the nursing council norms
Hospital Number of beds Op er ati on th eatr e Average OPD per day Nursing staff requirement as per MCI norms including
30 per cent reserve To
ta
l
General Critical Nursing staff Sister in charge Bhagawathi Hospital, Borivili 373 12 13 1019 268 64 332 V N Desai Hospital, Santacruz 284 - 5 1333 160 46 206 K B Bhabha Hospital, Kurla 306 - 4 1241 165 50 215 M T Agarwal Hospital, Mulund 225 10 8 643 172 41 213 Satapti Hospital, Govandi 210 10 9 1095 175 41 216 Total 1398 52 39 5331 940 242 1182
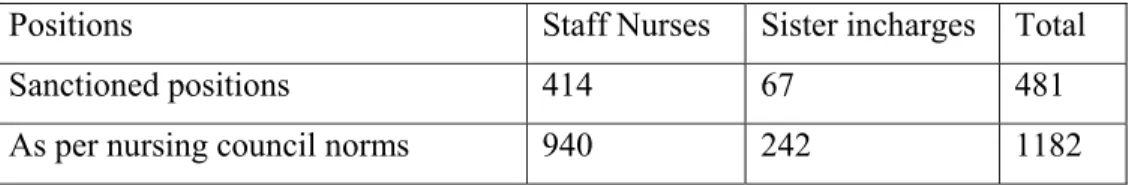
While comparing the actual posts (filled) positions with nursing council norms the number of staff needed is 200 per cent. The details of nursing norms enclosed in appendix 5. When comparing the sanctioned positions with nursing council norms, the sanctioned post is an average of 40.6 per cent of nursing council norms, similarly, comparing the filled posts and the nursing council norms, the filled posts amount to a mere 36 per cent of the nursing council norms. A comparative table is presented along with graph in table 1.17 as given below.
Table 1.17 Comparison between the sanctioned posts with nursing council norms
Positions Staff Nurses Sister incharges Total
Sanctioned positions 414 67 481
0 100 200 300 400 500 600 700 800 900 1000
Staff Nurses Sister
Incharges
Sanctioned posts
Filled Posts
Staff needed as per nursing council norms
Keeping the above data in view, it becomes necessary to examine the staff-patient ratio in actual situations. The data that has been collected through the structured questionnaire is presented in table 1.18. In the hospitals the staff allotment is based on the wards and number of beds. The wards are categorised as: small ward about 25 beds, medium size 26 -35 beds and bigger wards up to 45 beds. It is observed that in many hospitals renovation work is in progress so the hospital authorities have combined two wards or three wards together. Sometimes there would be possibilities of allotting the staff based on number of patients in case the workload increases. The staff are distributed among Operation Theatres, Critical Care Units, the various types of Wards and Out Patient Services. It is found that nearly 29 per cent of staff are allocated to the operation theatre services while 71 per cent are distributed among the wards and the OPD services. During the interviews in the study hospitals the nursing staff managed a number of patients. The details are presented in table 1.18. The nursing staff report that nearly 18 per cent attend to less than 10 patients while another 16 per cent attend 21 to 30 patients in a single shift. Moreover, nearly 10 per cent attend to 31 to 40 patients in their shift. The mean current nursing staff and patient ratio is 1:13 i.e. one staff member is responsible for thirteen patients. Ideally, 1 staff is to 5 patients is the required ratio in every shift. But in the sample hospitals the number of patients for each nurse to care for is much higher. It shows that the nursing staff are really required do more work and handle a large number of patient in their shifts so that they concentrate on the minimum patient care essential for the wellbeing of the patients.
Table 1.18
Number of patients seen by nursing staff during their the shift
In your duty you over see-Patients Staff Nurses incharges TotalSister
OT services 75 (28.4) 23 (43.4) 98 (30.9) Less than 10 pts 49 (18.6) 8 (15.1) 57 (18.0) 11-20 pts 42 (15.9) 6 (11.3) 48 (15.1) 21-30 pts 43 (16.3) 7 (13.2) 50 (15.8) 31-40 pts 29 (11.0) 3 (5.7) 32 (10.1) 41-50 pts 19 (7.2) 4 (7.5) 23 (7.3) 50 pts and above 7 (2.7) 2 (3.8) 9 (2.8)
In your duty you over see-Wards
OT 67 (25.4) 21 (39.6) 88 (27.8)
1 Ward 180 (68.2) 23 (43.4) 203 (64.0)
2 wards 12 (4.5) 4 (7.5) 16 (5.0)
3 wards 5 (1.9) 5 (9.4) 10 (3.2)
Total 264 (100) 53 (100) 317 (100)
(Figures in brackets indicate the percentage of nursing staff) N=317
The hospitals have no provision to provide extra staff when the workload increases in the ward and other areas. As seen in Table 1.19, nearly 68 per cent of nursing staff mentioned that the hospitals do not provide any extra staff in such situations. It is to be noted that the hospitals are already facing shortage of staff and there is no possibility of providing extra staff.
Table 1.19
Additional staff are provided if the work load increases
Does the organisation provide for extra
staff if workload increases? Staff Nurses Sister incharges Total
No 179 (67.8) 37 (69.8) 216(68.1)
Yes 85 (32.2) 16 (30.2) 101(31.9)
264 (100) 53 (100) 317 (100)
(Figures in brackets indicate the percentage of nursing staff N=317
All the study hospitals follow the strategy of job rotation for a specific period of time. Job rotation shall help the staff gain experience in a variety of conditions and also lead to the acquisition of multi-skills. This also helps the hospital make an arrangement for substitute in any ward irrespective of staff crunch so that the work will not suffer. Job rotation has created an opportunity for the nurses to work in Operation Theatre, Critical Care Services and special and general wards. As seen in Table 1.20 nearly 90 per cent of staff say that they have been rotated on the job every year and another 5 per cent reported that they are rotated in once in two years.
At the outset the job rotation fulfills the aim of the nursing staff of being professionals with multi skills.
Table 1.20
Nursing staff Job Rotation
How frequently you are shifted to one ward
to another? Staff Nurses
Sister incharges Total Daily 4 (1.5) 3 (5.7) (2.2)7 Yearly 259 (98.1) 28 (52.8) (90.5)287 One in 2 yrs 1 (0.4) 14 (26.4) 15 (4.7) One in 3 yrs 0 (0.0) 8 (15.1) 8 (2.5) 264 (100) 53 (100) 317 (100)
(Figures in brackets indicate the percentage of nursing staff N=317
Work activities and Time spent for each activity
Nursing staff are engaged in several activities during their duty (single shift) which is, generally, 7 hours 30 minutes in a day. Some of the activities that are performed are directly connected with patient care and some of the activities are indirectly associated with patient care. The staff nurse utilises nearly 50 per cent of her time for direct patient care. The rest of the time is spent on other activities. The non-nursing work can be done by others instead of the non-nursing staff so that the nurse can devote her full time to patient care. If such an arrangement is made the current nursing shortage can be managed to some extent.
Table 1.21
Time Utilisation by Staff Nurse
Activities performed by Staff Nurse Time spent for each activityOut of 450 minutes Per cent
Patient care (medication, communicating with patients, bed making, handing over taking over, rounds with
doctors, planning of work) 225 50
Clerical work (writing a case file, Preparing report,
indent, etc) 71 16
Inventory management, ,collecting, checking items from
stores etc 31 7
Telephone conversation for work purpose 14 3
Handling visitors / relatives and others 27 6
Internal training (case discussion, and other learning) 23 5 Traveling to various places in the hospital for work
purposes 18 4
Break (coffee, tea, and lunch) 27 6
Talking to the friends, and colleagues other than the
The sister in-charge plays vital role in organising, supervising, implementing and evaluating work at the ward level and in some cases the entire hospital. Usually the sister in-charge does an eight hours duty. The table below presents the various activities performed by the sister in-charge. The sister incharges are senior staff and they are engaged in patient care as well in guiding the staff. Sometimes they are given the responsibility of managing particular ward(s). The sister in-charge spends nearly 42 per cent of her time on nursing care activities and the rest of the time is spent on other works that could be easily managed by a non-nursing staff member. In private hospitals there some posts such as patient care coordinators or nursing aids to serve the patients and assist the nursing staff in the ward. In such situations the nursing staff spend their valuable time to only on patient care activities and the other duties are managed by the other staff work in the ward.
Table 1.22
Time Utilisation by Sister incharges
Activities performed by sister in charge
Time spent for each activity Out of 450
minutes Per cent out of 100
Preparing duty list, allotment staff, organising staffing for day to day, supervisory function, discussion with patients and relatives, supervision of night duty and afternoon duty for whole hospital etc.
202 42 Clerical work )writing a case file, Preparing report,
indent, etc 86 18
Inventory management, ,collecting, checking items from
stores etc 43 9
Telephone conversation for work purpose 19 4
Handling visitors / relatives and others 29 6
Internal training )case discussion, and other learning 34 7 Traveling to various places in the hospital for work
purposes 24 5
Break )coffee, tea, and lunch 29 6
Talking to the friends, and colleagues other than the
work matters 14 3
Nursing effective working hours
The nursing staff are provided with the following leaves Casual Leave 20 days in a year
Earned Leave 30 days in a year Sick Leave 15 days in a year Maternity Leave 90 days for a delivery Weekly off 72 days for a year Half Pay Leave 20 days for a year
In addition to the above there is a provision for abortion leave for the staff and two permissions for at least 1-2 hours of absence each is granted to the staff in a month. The sister incharges and senior staff get a weekly one day and half day leave respectively. Considering the number of off-days and other requirements the nursing staff’s effective working hours is calculated.
Staff Nurse
Total number of days available in a year = 365 days Number of days leave in a year 147 days
Net working days = 218 days
As per the above analysis the staff nurses devote 50 per cent of the time for patient care so the net working time goes to patient care is 109 days i.e. 30 per cent of the time in the year to patient care, but the staff are paid for the full year. In this case it is important to note that the working system, organisational ability and old practices are the primary instruments responsible for not using the working days of staff efficiently.
As per the above analysis the sister incharges devote 42 per cent of the time for the core purposes and direct work related issues so the net working time for patient care is 92 days i.e. 25 per cent of the year for patient care but the staff are paid for the full year. In this case, too it is important to note that the working system, organisational ability and old practices are primary responsible instrument for not using the net working days of staff.
Considering the actual situation, the nursing staff have reported their satisfaction with regard to time devoted to nursing supervisory and patient care processes. It is understood that the nursing staff do not allot sufficient time to patient care. It is also evident in Table 1.23 that only 32 per cent of the staff feel that the time devoted to patient care is satisfactory and the rest of the respondents feel that non-nursing work takes more time. Also some of the nursing staff feel that due to the heavy work load the time spent on each patient is nominal. There are two issues affecting the nursing
staff satisfaction with regard to time devoted the patient care process: (1.) There are more non nursing jobs and (2.) Inadequate time devoted to the patients due to work pressure.
Table 1.23
Nursing staff satisfaction regarding the time devoted to patient care
What extent do you satisfied with the time you give for patient care?
Present designation
Total Staff Nurse Sister incharges
Not at all (6.8)18 (5.7)3 (6.6)21
To some extent (62.5)165 (56.6)30 (61.5)195 To a large extent (30.7)81 (37.7)20 (31.9)101
Total (100)264 (100)53 (100)317
(Figures in brackets indicate the percentage of nursing staff) N=317
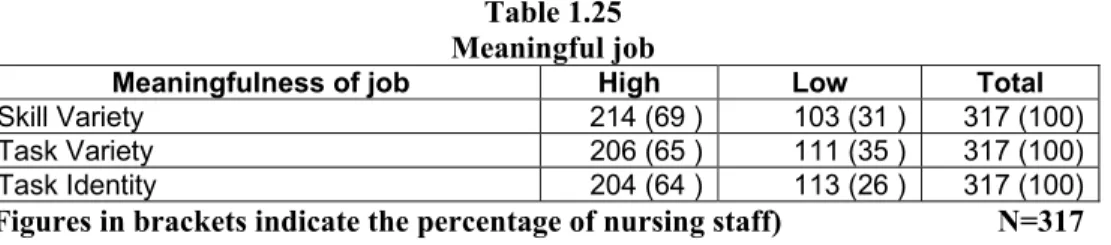
Analysis of nursing tasks
Nursing tasks are considered to be significant ones. There is no doubt that the nursing staff really contribute to the patient care process meaningfully. However, the nursing staff do many jobs which are not specific to their profession. In such cases it may affect the quality of nursing specific work as well decrease the intensity level of their work. Also there is a scope for developing the perception a low value is assigned to the nursing profession. Every nurse can choose to do the job that challenges, is interesting and makes her feel proud. If the staff have an opportunity to do such kinds of job she is motivated, satisfied and achieves a good performance. Theoretically speaking the workplace where the employees perform high complexity tasks shows that there is very low absenteeism Turner and Lawrence identify five job characteristics and their relationship to personal and work outcomes. According to the experience and practice of the staff members on the job activities may rate each characteristic high or low.
1. Skill variety: the degree to which the nursing job requires a variety of different activities so the nurse can use a number of different skills and talent
2. Task identity: the degree to which the nursing job requires completion of a whole and identifiable piece of work.
3. Task significance: the degree to which the nursing job has a substantial impact on the lives or work of other people