HESSD
12, 12827–12875, 2015 From meteorological to hydrological drought using standardised indicators L. J. Barker et al. Title Page Abstract Introduction Conclusions References Tables Figures J I J I Back CloseFull Screen / Esc
Printer-friendly Version Interactive Discussion Discussion P a per | Discussion P a per | Discussion P a per | Discussion P a per
Hydrol. Earth Syst. Sci. Discuss., 12, 12827–12875, 2015 www.hydrol-earth-syst-sci-discuss.net/12/12827/2015/ doi:10.5194/hessd-12-12827-2015
© Author(s) 2015. CC Attribution 3.0 License.
This discussion paper is/has been under review for the journal Hydrology and Earth System Sciences (HESS). Please refer to the corresponding final paper in HESS if available.
From meteorological to hydrological
drought using standardised indicators
L. J. Barker, J. Hannaford, A. Chiverton, and C. SvenssonCentre for Ecology and Hydrology, Wallingford, UK
Received: 6 November 2015 – Accepted: 17 November 2015 – Published: 10 December 2015 Correspondence to: L. J. Barker (lucybar@ceh.ac.uk)
HESSD
12, 12827–12875, 2015 From meteorological to hydrological drought using standardised indicators L. J. Barker et al. Title Page Abstract Introduction Conclusions References Tables Figures J I J I Back CloseFull Screen / Esc
Printer-friendly Version Interactive Discussion Discussion P a per | Discussion P a per | Discussion P a per | Discussion P a per | Abstract
Drought monitoring and early warning (M&EW) systems are a crucial component of drought preparedness. M&EW systems typically make use of drought indicators such as the Standardised Precipitation Index (SPI), but such indicators are not widely used in the UK. More generally, such tools have not been well developed for hydrological
5
(i.e. streamflow) drought. To fill these research gaps, this paper characterises meteo-rological and hydmeteo-rological droughts, and the propagation from one to the other using the SPI and the related Standardised Streamflow Index (SSI), with the objective of im-proving understanding of the drought hazard in the UK. SPI and SSI time series were calculated for 121 near-natural catchments in the UK for accumulation periods of 1–24
10
months. From these time series, drought events were identified and for each event, the duration and severity was calculated. The relationship between meteorological and hy-drological drought was examined by cross-correlating the one month SSI with various SPI accumulation periods. Finally, the influence of climate and catchment properties on the drought characteristics and propagation were investigated. Results showed that at
15
short accumulation periods meteorological drought characteristics showed little spatial variability, whilst hydrological drought characteristics showed fewer but longer and more severe droughts in the south and east than in the north and west of the UK. Propagation characteristics showed a similar spatial pattern with catchments underlain by produc-tive aquifers, mostly in the south and east, having longer SPI accumulation periods
20
strongly correlated with the one-month SSI. For catchments in the north and west of the UK, which typically have little catchment storage, standard-period annual average rainfall was strongly correlated to drought and propagation characteristics. However, in the south and east, catchment properties describing storage, such as base flow index, percentage of highly productive fractured rock and typical soil wetness, were
25
more influential on drought characteristics. This knowledge forms a basis for more in-formed application of standardised indicators in the UK in future, which could aid in the development of improved M&EW systems. Given the paucity of studies applying
HESSD
12, 12827–12875, 2015 From meteorological to hydrological drought using standardised indicators L. J. Barker et al. Title Page Abstract Introduction Conclusions References Tables Figures J I J I Back CloseFull Screen / Esc
Printer-friendly Version Interactive Discussion Discussion P a per | Discussion P a per | Discussion P a per | Discussion P a per
standardised indicators to hydrological droughts, and the diversity of catchment types encompassed here, the findings could prove valuable for enhancing the hydrological aspects of M&EW systems elsewhere in the world.
1 Introduction
Drought is widely recognised as a complex, multifaceted phenomenon (e.g. Van Loon,
5
2015). Unlike many other natural hazards, drought develops slowly making it difficult to pinpoint the onset and termination of an event. Fundamentally, a drought is a deficit in the expected available water in a given hydrological system (Sheffield and Wood, 2011). Since Wilhite and Glantz (1985), drought has popularly been classified into various types (e.g. meteorological, hydrological, agricultural, environmental and
socio-10
economic). The drought type generally reflects the compartment of the hydrological cycle or sector of human activity that is affected; deficits typically propagate through the hydrological cycle impacting different ecosystems and human activities accordingly.
Given the complexity of drought, there is a need for objective approaches to define drought events for management purposes. The desire to quantitatively identify and
15
analyse drought duration, severity, onset and termination has led to the development of drought indicators. Lloyd-Hughes (2014) counted over 100 drought indicators in the literature, this proliferation reflecting the complexity of the subject matter. It has been argued that indicators should be chosen according to the type of drought in question; for example, meteorological indicators should not be used in isolation to characterise
20
hydrological drought due to the non-linear responses of terrestrial processes to climate inputs (Van Loon and Van Lanen, 2012; Van Lanen et al., 2013).
One of the primary uses of drought indicators is in monitoring and early warn-ing (M&EW), a crucial part of drought preparedness (Bachmair et al., 2015b). Lit-tle can be done to prevent a meteorological drought from occurring, but actions can
25
be taken to prevent or mitigate the impact of a hydrological drought. An effective drought M&EW system is the foundation of a proactive management strategy,
trig-HESSD
12, 12827–12875, 2015 From meteorological to hydrological drought using standardised indicators L. J. Barker et al. Title Page Abstract Introduction Conclusions References Tables Figures J I J I Back CloseFull Screen / Esc
Printer-friendly Version Interactive Discussion Discussion P a per | Discussion P a per | Discussion P a per | Discussion P a per |
gering planned actions and responses (Wilhite et al., 2000). There are numerous examples of drought M&EW systems globally, for example, the US Drought Moni-tor (http://droughtmoniMoni-tor.unl.edu/Home.aspx) and the European Drought ObservaMoni-tory (http://edo.jrc.ec.europa.eu), to name but two. Although drought M&EW systems do use hydrological variables such as streamflow, the emphasis is typically placed on
5
the meteorological and/or agricultural drought hazard. As such, hydrological aspects are often less sophisticated, as discussed in a recent study that combined a litera-ture review with a survey of 33 regional, national and global drought M&EW providers (Bachmair et al., 2015b).
The Standardised Precipitation Index (SPI; McKee et al., 1993) is one of the most
10
widely used drought indicators. It enables consistent comparison across both time and space as well as providing the flexibility to assess precipitation deficits over user-defined accumulation periods. The advantages and flexibilities of the SPI have led to an endorsement by the World Meteorological Organization as the indicator of choice for monitoring meteorological drought (Hayes et al., 2011). A growing trend in drought
15
M&EW research is the application of the same standardisation principles to other hy-drological data types (soil moisture, streamflow, groundwater etc.) producing a family of standardised indices for all compartments of the hydrological cycle (Bachmair et al., 2015b).
In the UK, there is no nationwide, drought-orientated M&EW system in place.
Reg-20
ular hydrological reporting, published by the National Hydrological Monitoring Pro-gramme in monthly Hydrological Summaries (http://nrfa.ceh.ac.uk/nhmp), uses simple rank-based approaches to place current hydrological conditions in their historical con-text. Although it is a valuable resource, it is not used for drought planning and does not trigger actions in drought plans. Drought M&EW is carried out individually by
reg-25
ulators (such as the Environment Agency in England, who produce Water Situation Reports; Environment Agency, 2015) and water companies, who also typically use simple rank-based indicators to examine drought status according to their own drought plans. While there is already very effective consultation between different stakeholders
HESSD
12, 12827–12875, 2015 From meteorological to hydrological drought using standardised indicators L. J. Barker et al. Title Page Abstract Introduction Conclusions References Tables Figures J I J I Back CloseFull Screen / Esc
Printer-friendly Version Interactive Discussion Discussion P a per | Discussion P a per | Discussion P a per | Discussion P a per
in drought planning, there are inevitably differences in interpretation and communica-tion of droughts. There is a recognised need to develop more consistent approaches to monitoring (Collins et al., 2015), highlighting the potential benefit of a large-scale drought M&EW system tailored to a range of end-user needs.
The absence of a coherent drought-focused M&EW system across the UK is, in part,
5
due to the lack of consensus on appropriate drought indicators or drought definitions for the UK. A number of drought analyses have been applied using a range of different, non-standardised, indicators (e.g. Marsh et al., 2007; Rahiz and New, 2012; Watts et al., 2012) but the SPI and other standardised indicators have been used in only a few research studies (for example: Hannaford et al., 2011; Lennard et al., 2014; Folland
10
et al., 2015). Such indicators are generally not used operationally; although the Scottish Environment Protection Agency (SEPA) use a variant of standardised indicators for drought M&EW (Gosling, 2014) and Southern Water use SPI in their drought plan (Southern Water, 2013).
Recently, there has been growing interest in applying the standardised family of
indi-15
cators at the national scale in the UK. A Drought Portal (https://eip.ceh.ac.uk/droughts) has been developed to visualise past meteorological drought using gridded SPI data (Tanguy et al., 2015); and a version of the Standardised Streamflow Index (SSI), for hydrological drought, has been developed (Svensson et al., 2015b). Despite these ad-vances, a major obstacle to the development of a drought-focused M&EW system is
20
a lack of understanding of the link between meteorological and hydrological drought and how droughts propagate from one to the other. Folland et al. (2015) explored prop-agation between meteorological, hydrological and groundwater drought using stan-dardised indicators. However, the study focused on regional averages for a single large region in south-east England and the authors acknowledged that there is likely to be
25
significant spatial variability in propagation as a result of the diverse climate and geol-ogy across the UK. Several studies have demonstrated the importance of catchment properties in modulating precipitation signals in UK streamflow (Laizé and Hannah, 2010; Chiverton et al., 2015a) and this has been shown specifically for drought (Fleig
HESSD
12, 12827–12875, 2015 From meteorological to hydrological drought using standardised indicators L. J. Barker et al. Title Page Abstract Introduction Conclusions References Tables Figures J I J I Back CloseFull Screen / Esc
Printer-friendly Version Interactive Discussion Discussion P a per | Discussion P a per | Discussion P a per | Discussion P a per |
et al., 2011). As such, there is a need for a fuller understanding of regional variability in drought characteristics, how this variability is affected by the propagation from meteo-rological to hydmeteo-rological drought and which climatic and catchment properties influence these relationships.
Many studies investigating hydrological drought characterisation and drought
prop-5
agation have done so at the national, continental or global scale using modelled data (e.g. Vidal et al., 2010; Van Lanen et al., 2013), or at a smaller scale using a lim-ited number of sites and observed data (e.g. Fleig et al., 2011; Lorenzo-Lacruz et al., 2013b; Haslinger et al., 2014). Furthermore, few studies have used standardised in-dicators for both meteorological and hydrological droughts, which enables consistent
10
characterisation across components of the hydrological cycle (and thereby potentially forming the foundation of a more integrated drought M&EW system). Very few obser-vational studies have addressed the influence of climate and catchment properties on drought characteristics and propagation in a wide range of catchments demonstrating climatic and geological diversity. Studies have also tended to focus on a few
charac-15
teristics representing geology or climate (e.g. Vidal et al., 2010; Lorenzo-Lacruz et al., 2013b; Haslinger et al., 2014) rather than a wide range of physiographic and land use properties, with the exception of the study by Van Loon and Laaha (2015) that used 33 catchment properties.
This study exploits the long streamflow and precipitation records held by the National
20
River Flow Archive (NRFA) for 121 catchments distributed across the heterogeneous landscape and climate of the UK. Using observed data, the utility of standardised in-dicators, the Standardised Precipitation Index (SPI) and the Standardised Streamflow Index (SSI), for characterising drought characteristics and propagation behaviour is assessed; specifically addressing the following key questions:
25
1. How do drought characteristics vary spatially across the UK?
2. What are the relationships between meteorological and hydrological droughts and over which timescales are they related?
HESSD
12, 12827–12875, 2015 From meteorological to hydrological drought using standardised indicators L. J. Barker et al. Title Page Abstract Introduction Conclusions References Tables Figures J I J I Back CloseFull Screen / Esc
Printer-friendly Version Interactive Discussion Discussion P a per | Discussion P a per | Discussion P a per | Discussion P a per
3. Which climatic and catchment properties influence drought characteristics and the propagation from meteorological to hydrological drought?
Addressing these questions will supplement the existing knowledge of the baseline drought hazard and propagation behaviours across the UK, in a set of catchments with diverse properties, representative of hydro-climatic and landscape variations. This
5
knowledge is an important foundation for the development of improved drought M&EW systems (Folland et al., 2015; Van Loon, 2015) which, in turn, allow preventative mea-sures to be implemented resulting in reduced vulnerability and increased resilience to drought.
2 Data
10
The UK has one of the densest hydrometric networks in the world. Hydrometric data is archived and curated by the NRFA (http://nrfa.ceh.ac.uk), which holds data for around 1400 gauging stations (Dixon et al., 2013). The Benchmark catchments (Bradford and Marsh, 2003) are a subset of these stations with good hydrometric performance and near-natural flow regimes (Bradford and Marsh, 2003). It was necessary to limit the
15
study to these catchments as major artificial influences could confound the identifica-tion of links between meteorological and hydrological drought; regulated catchments have been shown to be distinctly different in terms of drought characteristics (e.g. Lorenzo-Lacruz et al., 2013b).
The selected Benchmark catchments were required to have at least 30 years of daily
20
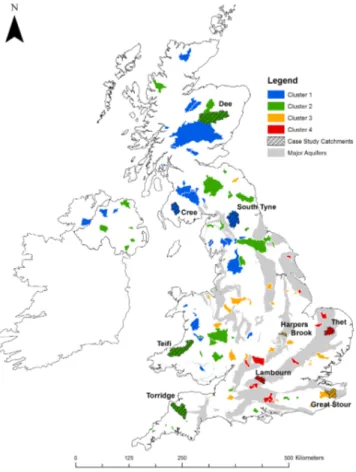
streamflow records between 1961–2012 and each month was required to have at least 25 days of valid observations (in order to calculate mean monthly flow). Two ephemeral streams were excluded from the selection, as the truncation of the flows at zero would have been unhelpful when studying drought propagation. The selection criteria resulted in 121 catchments, providing good spatial coverage of the UK and a range of catchment
25
types (Fig. 1). The selection of Benchmark catchments used here differs slightly to other published studies (such as Hannaford and Marsh, 2006; Chiverton et al., 2015a)
HESSD
12, 12827–12875, 2015 From meteorological to hydrological drought using standardised indicators L. J. Barker et al. Title Page Abstract Introduction Conclusions References Tables Figures J I J I Back CloseFull Screen / Esc
Printer-friendly Version Interactive Discussion Discussion P a per | Discussion P a per | Discussion P a per | Discussion P a per |
because of differing selection criteria and the ongoing evolution of the Benchmark net-work. The NRFA also holds catchment average monthly precipitation data for each catchment, all of which had at least 30 years of precipitation data available between 1961 and 2012. Not all catchments had mean monthly precipitation or streamflow data available for the whole period 1961–2012; in some cases, the mean monthly streamflow
5
and the catchment average monthly precipitation period of record differed in length, but all catchments had at least 30 years of data overlapping. However, less than 10 % of catchments had a difference in record length of five or more years, and less than 3 % of catchments had a difference in record length of 10 or more years.
Catchments were grouped using a previously developed classification system
10
(Chiverton et al., 2015a) based on the temporal dependence in daily streamflow (char-acterised by calculating semi-variograms), enabling calculated drought characteristics to be analysed regionally. Where the catchments overlapped with those used in Chiver-ton et al. (2015a), the same cluster allocations were used. The 15 catchments that did not overlap between the two studies were assigned to the cluster for which the
semi-15
variogram was closest to the mean semi-variogram of the cluster. Figure 1 shows the distribution of clusters across the UK for the 121 catchments. Clusters one and two are predominantly located in the upland north and west of the UK, have steeper slopes, less storage, are less permeable and have a higher amount of precipitation than the catchments in clusters three and four which are mostly located in the south and east
20
of the UK. Predominant soil types differ between all four clusters. Clusters one and two can also be differentiated by elevation whilst clusters three and four can be diff erenti-ated by their geology (Chiverton et al., 2015a).
Nine catchments covering a range of catchment types and sizes, as well as each cluster, were selected as case study catchments to allow more detailed,
catchment-25
scale results to be displayed. The following catchments were selected: the Dee and the Cree in Scotland, the South Tyne in north-east England, the Teifi in Wales, Harpers Brook and the Thet in East Anglia, the Great Stour and the Lambourn in south-east England and the Torridge in south-west England (Fig. 1).
HESSD
12, 12827–12875, 2015 From meteorological to hydrological drought using standardised indicators L. J. Barker et al. Title Page Abstract Introduction Conclusions References Tables Figures J I J I Back CloseFull Screen / Esc
Printer-friendly Version Interactive Discussion Discussion P a per | Discussion P a per | Discussion P a per | Discussion P a per
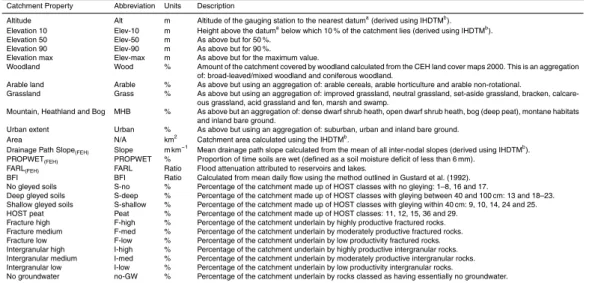
In order to investigate the influence of the physical catchment on drought propaga-tion, catchment properties were extracted for each catchment. The selected catchment properties (Table 1) have been found in previous studies to be significant for modify-ing climate-streamflow associations and in determinmodify-ing the temporal dependence of flows (Laizé and Hannah, 2010; Chiverton et al., 2015a). Comparable properties have
5
been found to influence drought duration and severity in other countries (Vidal et al., 2010; Haslinger et al., 2014; Van Loon and Laaha, 2015). Base flow index (BFI), calcu-lated from streamflow data (Gustard et al., 1992), although not technically a catchment property, has been found to reflect catchment geology, storage and release properties and so was used as an indicator of catchment storage (Bloomfield et al., 2009;
Hid-10
sal et al., 2004; Van Loon and Laaha, 2015). Catchment properties were derived from spatial data held by the NRFA (Marsh and Hannaford, 2008) and the British Geologi-cal Survey, and in some cases extracted from the Flood Estimation Handbook (FEH) (Bayliss, 1999). The catchment average standard-period average annual rainfall 1961– 1990 (SAAR) was used as a descriptor of the precipitation climate. The SAAR values
15
were derived from a 1 km gridded map based on Met Office data (Spackman, 1993).
3 Methods
3.1 Drought characteristics
The Standardised Precipitation Index (SPI) is calculated by first aggregating precipi-tation data over a user-defined accumulation period (often 1, 3, 6, 12 or 24 months).
20
A probability distribution function is then fitted to the aggregated precipitation data for each calendar end-month (of the accumulation period) individually; it is then trans-formed to the standard normal distribution with a mean of zero and a standard deviation of one. This transformation makes the SPI comparable over time and space. The cal-culated SPI value represents the number of standard deviations away from the typical
25
proba-HESSD
12, 12827–12875, 2015 From meteorological to hydrological drought using standardised indicators L. J. Barker et al. Title Page Abstract Introduction Conclusions References Tables Figures J I J I Back CloseFull Screen / Esc
Printer-friendly Version Interactive Discussion Discussion P a per | Discussion P a per | Discussion P a per | Discussion P a per |
bility of occurrence, with more negative values indicating more severe, but less likely droughts (McKee et al., 1993; Guttman, 1999; Lloyd-Hughes and Saunders, 2002). For SPI calculation, a Gamma distribution is often fitted to precipitation data. Several studies have tested the most appropriate probability distribution to fit to precipitation data and in many cases found Gamma to be acceptable (e.g. Guttman, 1999; Stagge
5
et al., 2015). The Standardised Streamflow Index (SSI) uses the same principle as the SPI, aggregating streamflow data over the given accumulation periods (Vicente-Serrano et al., 2012b; Lorenzo-Lacruz et al., 2013a). In contrast to precipitation and SPI calculation, there is no widely adopted probability distribution fitted to streamflow data for SSI calculation and previously, numerous distributions have been used (e.g.
10
Vicente-Serrano et al., 2013a). Here, we use the Tweedie distribution for both precipita-tion and streamflow, which has been shown to fit the same catchments well (Svensson et al., 2015b). The Tweedie distribution is a flexible three-parameter distribution that has a lower bound at zero (Tweedie, 1981; Jørgensen, 1987). The “SCI” package for R (Gudmundsson and Stagge, 2014) was used to calculate SPI and SSI for the
pe-15
riod 1961–2012 and accumulation periods of 1–24 months. A new function enabled the parameter estimation in the package “tweedie” (Dunn, 2014) to be called within the SCI package (Svensson et al., 2015b). Accumulation periods are denoted as follows: SPI-x and SSI-x, for example, SPI-6 and SSI-3 correspond to a six month precipitation accumulation period and a three month streamflow accumulation period, respectively.
20
Drought events were defined as periods where indicator values were continuously negative with at least one month in the negative series reaching a given threshold (McKee et al., 1993; Vidal et al., 2010). Thresholds of −1 (moderate drought), −1.5 (severe drought) and−2 (extreme drought; Lloyd-Hughes and Saunders, 2002) were used to identify drought events. The number of events was calculated for each
catch-25
ment, accumulation period and threshold in addition to the mean, median and maxi-mum event duration and severity. The duration of each individual event was calculated for the given catchment at a monthly resolution. The severity was calculated by
sum-HESSD
12, 12827–12875, 2015 From meteorological to hydrological drought using standardised indicators L. J. Barker et al. Title Page Abstract Introduction Conclusions References Tables Figures J I J I Back CloseFull Screen / Esc
Printer-friendly Version Interactive Discussion Discussion P a per | Discussion P a per | Discussion P a per | Discussion P a per
ming the SPI/SSI values across all constituent months of each identified event in each catchment (Vidal et al., 2010) and as such has no units.
3.2 Drought propagation
Streamflow, and so the SSI, integrate catchment scale hydrogeological processes. As such, a comparison with the SPI provides an indication of the time taken for
precip-5
itation deficits to propagate through the hydrological cycle to streamflow deficits. SPI accumulation periods of 1–24 months and SSI-1 time series were cross-correlated us-ing the Pearson correlation coefficient to analyse the most appropriate accumulation period of precipitation to relate to SSI-1. The duration of the SPI accumulation period with the strongest correlation with SSI-1 was denoted SPI-nand was used as an
indi-10
cator for drought propagation. Where SSI-1 was most strongly correlated to short SPI accumulation periods, the propagation time is also short, and vice versa. To determine whether there is a lag between the SPI (accumulation periods of 1–24 months) and SSI-1, cross-correlations were calculated for SSI-1 series which were lagged by zero to six months after the SPI series. In this case, the duration of the SPI accumulation
15
period with the strongest correlation with SSI-1 was denoted as the lagged SPI-n. Independence of data is a requirement for many statistical analyses. However, be-cause of temporal dependence, or autocorrelation, in the SSI-1 and in all the series of SPI accumulation periods exceeding one month, data are not independent. Correla-tions between two autocorrelated time series have fewer effective degrees of freedom
20
than is assumed in a standard significance test. As such, using a standard signifi-cance test can result in an increased chance of concluding correlations are statistically significant (i.e. increased rate of Type 1 error) (Pyper and Peterman, 1998). In order to address and control Type 1 error rates, the “modified Chelton” method outlined in Pyper and Peterman (1998) was adapted to account for missing data, and used for
calculat-25
ing the effective degrees of freedom for a given data series. Details of the “modified Chelton” method are provided in the Supplement (S1).
HESSD
12, 12827–12875, 2015 From meteorological to hydrological drought using standardised indicators L. J. Barker et al. Title Page Abstract Introduction Conclusions References Tables Figures J I J I Back CloseFull Screen / Esc
Printer-friendly Version Interactive Discussion Discussion P a per | Discussion P a per | Discussion P a per | Discussion P a per |
3.3 Links with climate and catchment properties
Drought characteristics were plotted against standard-period average annual rainfall (SAAR) and the corresponding correlation coefficients calculated. Spearman’s corre-lation was used because of the non-linear recorre-lationships between the drought char-acteristics and SAAR. Clusters one and two were grouped together because of their
5
location in the windward mountainous north and west of the country, whilst clusters three and four were grouped together because of their location in the sheltered low-land south-east. Spearman’s correlations were also used to quantify the relationship between drought characteristics and catchment properties.
4 Results
10
4.1 Drought characteristics
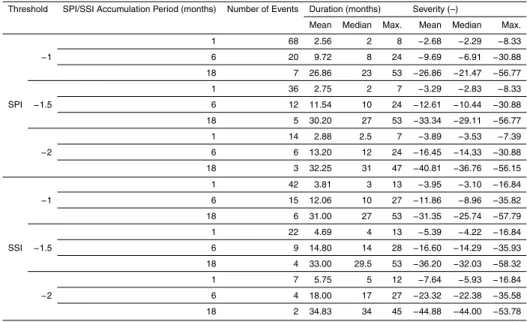
For each accumulation period and catchment, drought events were identified using thresholds of−1,−1.5 and −2 (moderate, severe and extreme drought, respectively). For both SPI and SSI, unsurprisingly, more drought events were identified at shorter accumulation periods and thresholds closest to zero. Then, as the accumulation period
15
lengthens and the threshold moves away from zero, the number of events decreases, duration lengthens and severity worsens (Table 2). Spatial patterns for the SPI and SSI maximum duration and severity characteristics were similar for all three thresholds, and as such, only results for the−2 threshold (extreme drought) are shown. Results for the
−1 and−1.5 thresholds can be found in the Supplement (S2; Figs. S1, S2, S3 and S4).
20
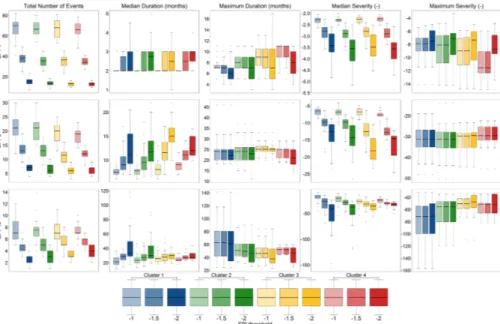
For SPI-1, SPI-6 and SPI-18, there is little variation between the four clusters of catchments for the number of events and the median duration/severity characteristics (Fig. 2). This indicates that meteorological drought characteristics vary only modestly across the country over shorter accumulation periods once the precipitation has been standardised. The maximum duration/severity characteristics showed more differences
HESSD
12, 12827–12875, 2015 From meteorological to hydrological drought using standardised indicators L. J. Barker et al. Title Page Abstract Introduction Conclusions References Tables Figures J I J I Back CloseFull Screen / Esc
Printer-friendly Version Interactive Discussion Discussion P a per | Discussion P a per | Discussion P a per | Discussion P a per
between clusters, often showing a gradual change from cluster one to four. The max-imum duration of droughts in cluster one were generally short (between four and nine months) whilst those in cluster four were longer (between 4 and 11 months). Similarly, for the maximum severity, droughts in cluster one were less severe than those in cluster four. In contrast to SPI-1 and SPI-6, for SPI-18 the median of the maximum duration
5
decreases when moving from clusters one to three; the median of cluster four is higher than that of cluster two. Similarly, the median maximum severity shows a different pat-tern for SPI-18 than for the shorter accumulation periods – median severity increases (becomes less severe) moving from cluster one to three, cluster four has a lower (more severe) median severity than cluster three. Over these longer accumulation periods,
10
inter-annual variability starts to become more influential; however, as will be discussed below (Sect. 5.1), the findings are somewhat surprising given that cluster one (mostly north-west Britain, the wettest and most upland part of the country) displays the longest drought durations and most severe events.
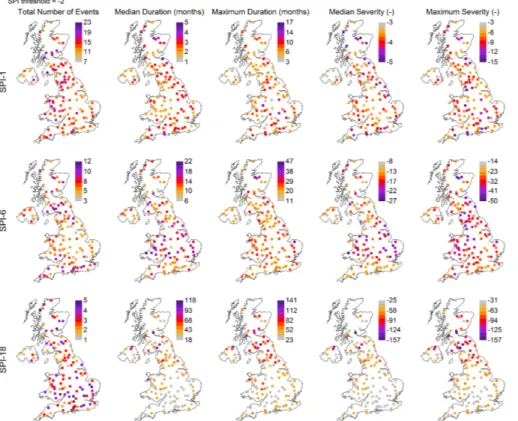
Maps of SPI-1 and SPI-6 drought characteristics (Fig. 3) again show little spatial
15
variability in either the total number of events or event duration and severity. Similarly, the number of events at the 18 month accumulation period shows little spatial variability; however, the duration and severity maps show longer, more severe drought events occurring in northern England and Scotland.
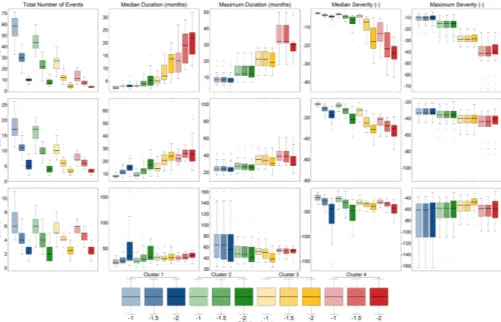
For SSI (Fig. 4), there is a larger difference between the clusters for SSI-1 and SSI-6
20
than is seen in SPI for the same accumulation periods (Fig. 2). As was the situation for SPI-1 and SPI-6, the differences between clusters occurs gradually from cluster one to four. For SSI-1 fewer, but longer and more severe, events are identified in cluster four than cluster one. However, as the SSI accumulation period increases to 18 months, there is less difference between the clusters (Fig. 4); much like the spatial trends seen
25
for SPI-18 (Fig. 2), whereby cluster one has a much greater range in maximum duration and severity than the other three clusters.
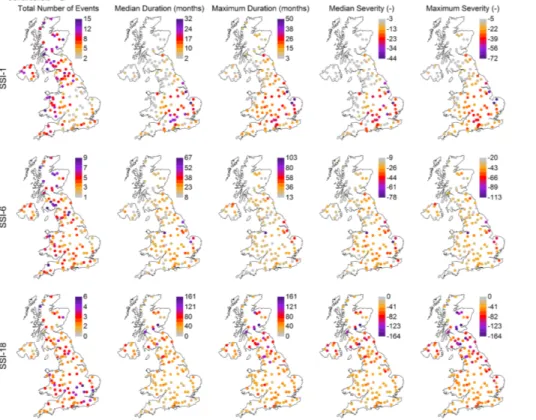
In contrast to SPI, maps of SSI event characteristics show more spatial variability (Fig. 5). For SSI-1 and SSI-6, fewer, longer, more severe events occur in the south and
HESSD
12, 12827–12875, 2015 From meteorological to hydrological drought using standardised indicators L. J. Barker et al. Title Page Abstract Introduction Conclusions References Tables Figures J I J I Back CloseFull Screen / Esc
Printer-friendly Version Interactive Discussion Discussion P a per | Discussion P a per | Discussion P a per | Discussion P a per |
east. As the accumulation period lengthens to 18 months, longer, more severe events occur in Scotland and the north of England. Despite this, the number of events remains fewer than 10 throughout the UK with the most events occurring in the south-east of England.
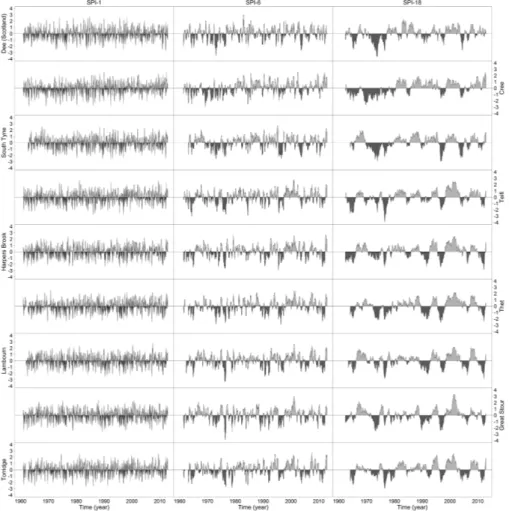
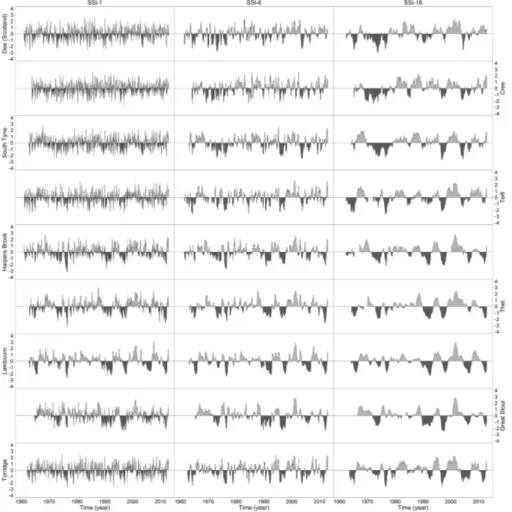
Time series plots of SPI for selected accumulation periods in Fig. 6 and SSI in Fig. 7
5
show the highly variable time series for the one month accumulation period. As the accumulation period increases to six and 18 months, the time series become smoothed with both wet and dry periods becoming more prolonged. Figure 6 also shows that at the longer accumulation period (SPI-18) for the two Scottish case study sites (River Dee and River Cree), the early time series is dominated by dry events, whilst the later
10
time series is dominated by wet events. This is in contrast to the remaining case study sites in England and Wales which show more regular fluctuations between wet and dry events throughout the SPI time series. Similar long-term trends can be seen in the SSI time series for the case study catchments in Fig. 7. The implications of these patterns for application of the SPI and SSI will be returned to in the discussion (Sect. 5.1).
15
4.2 Drought propagation
Pearson correlations between SSI-1 and different accumulation periods of SPI (1–24 months) showed that for the majority of catchments, the strongest correlations (giving the duration of SPI-n) were found with SPI accumulation periods of one, two and three months (50, 38 and 10 catchments respectively, Fig. 8). The longest SPI-n duration
20
was 19 months (r value associated with SPI-n=0.85) followed by 16 months (r value associated with SPI-n=0.83), both located in south-east England.
Figure 8 shows that for catchments in the north and west of the UK SSI-1 was most strongly correlated with short SPI-ndurations of one to four months, whilst longer
SPI-ndurations were more strongly correlated in the south and east. The most northerly
25
catchment where the strongest correlation is with an SPI-nof more than four months was found on the east coast where SSI-1 was most strongly correlated with SPI-12 (r=0.80). In Wales, the longest SPI-n duration was 5 months (r=0.78); remaining
HESSD
12, 12827–12875, 2015 From meteorological to hydrological drought using standardised indicators L. J. Barker et al. Title Page Abstract Introduction Conclusions References Tables Figures J I J I Back CloseFull Screen / Esc
Printer-friendly Version Interactive Discussion Discussion P a per | Discussion P a per | Discussion P a per | Discussion P a per
Welsh catchments had an SPI-n duration of three months or less. The location of catchments with longer SPI-ndurations in the south and east mostly coincide with the location of major UK aquifers (Fig. 8); the relationship between this indicator of drought propagation and physical catchment properties will be explored further in Sect. 4.3.
Figure 9 shows the correlations between all SPI accumulation periods (1–24 months)
5
and SSI-1. The strength of the correlations reflects the spatial variability seen in Fig. 8. Catchments in the north and west show the strongest correlations at accumulation periods of 6 months or less, a majority of which (particularly in western Britain) show the maximum correlation at SPI-1, compared with those in the south and east where strong correlations are found at the full range of SPI accumulation periods (1–24 months).
10
Some catchments however, do not fit this geographical generalisation. For example, some catchments in Scotland and Wales show strong correlations between SPI and SSI-1 across a range of SPI accumulation periods whilst several catchments in south-east England show the strongest correlation at short SPI accumulation periods and weaker correlations at longer SPI accumulation periods.
15
When SPI values (for accumulation periods of 1–24 months) were correlated with lagged SSI-1, the strongest correlation was found at a lag of zero months (i.e. no lag) for all catchments. One would expect the SPI-naccumulation period most correlated with lagged SSI-1 (lagged SPI-n) to be a function of the autocorrelation in the SSI-1 time series. To examine this, the longest n-month period for which there is significant
20
autocorrelation in SSI-1 (autocorrelation max) is also shown in Fig. 10 on the y axis for the SSI-1 with zero lag. For the nine case study catchments the autocorrelation max is very close to (in all cases within 4 months) of the lagged SPI-nduration. The autocorrelation max for the Cree occurs at zero months (and so is not shown in Fig. 10) showing there is no month-to-month autocorrelation in the flows. When looking at all
25
catchments (as in Fig. 9), the SPI-nduration and the autocorrelation max was the same or one month different for over 80 % of catchments.
Case study catchments in the south and east (Harpers Brook, Thet, Lambourn and Great Stour) show stronger and significant (α=0.05) correlations across a range of
HESSD
12, 12827–12875, 2015 From meteorological to hydrological drought using standardised indicators L. J. Barker et al. Title Page Abstract Introduction Conclusions References Tables Figures J I J I Back CloseFull Screen / Esc
Printer-friendly Version Interactive Discussion Discussion P a per | Discussion P a per | Discussion P a per | Discussion P a per |
both SPI accumulation periods and lags than those in the north and east (Dee, Cree, South Tyne, Teifi and Torridge; Fig. 10). These northern and western catchments show strong, significant correlations at shorter SPI accumulation periods and lags and as lag increases the strength and significance of correlations decreases. Case study catch-ments in the north and west (south and east) can be characterised by generally low
5
(high) BFI values. For all catchments, there was a strong correlation between the
SPI-nand BFI (r=0.79,α=0.001). Although BFI showed a strong correlation with SPI-n, because of the climatic, geological and land-surface heterogeneity in the UK, other cli-mate and catchment properties are also likely to be influential; these are discussed in the following section (Sect. 4.3).
10
4.3 Links with climate and catchment properties
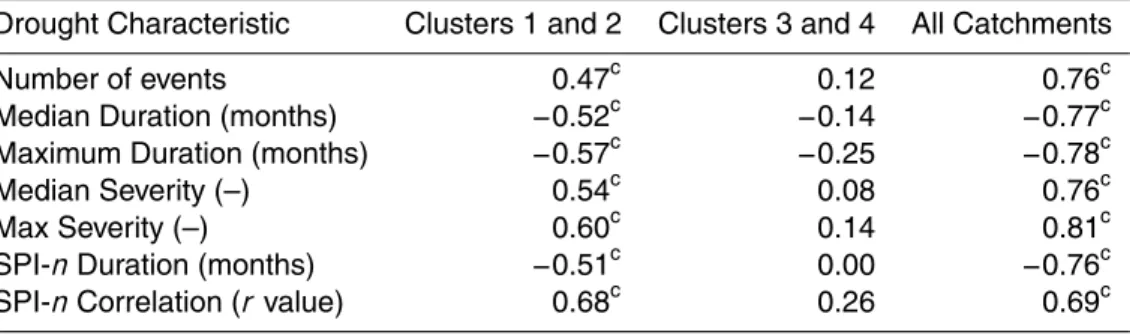
Table 3 shows the Spearman correlation between hydrological drought characteristics (based on SSI and include a propagation indicator, SPI-n) and SAAR for clusters one and two, clusters three and four and all catchments grouped together. The Spear-man correlations for all catchments showed stronger, highly significant correlations
15
(α=0.001) between SAAR and the drought characteristics. Correlations for clusters one and two are stronger, and significant (α=0.01), than those for clusters three and four which were weak and non-significant. This suggests that the general precipitation climate is more influential in determining drought characteristics and propagation in clusters one and two than it is in clusters three and four, where the within-cluster
pre-20
cipitation climate is more uniform and the geology is more heterogeneous. However, the significance of these correlations is likely to be a result of (a) the strong precipita-tion gradient between the north-west and the south-east of the UK; and (b) the unequal number of catchments in each group – there are 71 catchments in clusters one and two, whilst clusters three and four have 50 catchments.
25
Figure 11 shows the relationship between SAAR and drought characteristics for all catchments, with points coloured by BFI value to give an indication of the relation-ship between the drought characteristics and catchment storage. The plots show BFI
HESSD
12, 12827–12875, 2015 From meteorological to hydrological drought using standardised indicators L. J. Barker et al. Title Page Abstract Introduction Conclusions References Tables Figures J I J I Back CloseFull Screen / Esc
Printer-friendly Version Interactive Discussion Discussion P a per | Discussion P a per | Discussion P a per | Discussion P a per
decreasing as SAAR increases, a reflection of the fact that most high BFI, i.e. high stor-age, catchments are located in lowland south-east England that receives less precipi-tation. Figure 11 illustrates positive relationships between SAAR and the total number of events, median/maximum severity and ther value associated with SPI-nand a neg-ative correlation between SAAR and median/maximum duration and SPI-n duration.
5
The strong, significant (α=0.001) relationships for all catchments between SAAR and the drought characteristics are shown in Table 3.
Figure 12 shows the relationship between precipitation, drought characteristics and propagation but for catchments in clusters three and four only (the results for clusters one and two are not shown as they are broadly similar to the results for the full dataset).
10
The relationship with SAAR for these clusters, as shown in Table 3, is weaker than those for all catchments (Table 3, Fig. 11). Instead it is clear that catchments can be split into two groups, those with higher BFI values and those with lower BFI values (Fig. 12); catchments were split based on the median BFI for clusters three and four. Each group separately follows the same relationship with SAAR, as described for the
15
full data set in Table 3 and Fig. 11. This is with the exception of ther value associated with SPI-nand SAAR, which shows opposite relationships – positive (negative) for low (high) BFI catchments. These results indicate that the catchment storage, indexed by BFI, is more influential in determining drought characteristics and propagation than precipitation for catchments in clusters three and four. However, BFI is an index based
20
on base flow separation using streamflow data; we next consider whether any of the catchment properties, including those that influence storage, can explain drought and propagation characteristics.
Figure 13 shows that when clusters three and four are grouped together, both the median and maximum duration have a strong positive correlation with catchment
prop-25
erties related to storage, such as the percentage of highly productive fractured rock (r=0.78 and 0.59, respectively) and BFI (r=0.73 and 0.56, respectively). Correla-tions of catchment properties with severity characteristics were generally of a similar strength, but as would be expected, where duration characteristics showed positive
HESSD
12, 12827–12875, 2015 From meteorological to hydrological drought using standardised indicators L. J. Barker et al. Title Page Abstract Introduction Conclusions References Tables Figures J I J I Back CloseFull Screen / Esc
Printer-friendly Version Interactive Discussion Discussion P a per | Discussion P a per | Discussion P a per | Discussion P a per |
correlations, severity characteristics showed negative correlations (and vice versa). The number of events was most strongly correlated to the percentage of highly pro-ductive fractured rock (r=−0.70) and BFI (r=−0.68), both of which were significant (α=0.001). These two catchment properties were also most strongly correlated to the SPI-nduration (r =0.81 and 0.83, respectively). The percentage of highly
produc-5
tive intergranular rocks showed significant relationships with all drought characteristics, whilst the percentage of moderately productive intergranular rocks showed weaker and less significant relationships. The percentage of low productivity intergranular rocks on the other hand, showed negative correlations where the percentage of highly and mod-erately productive intergranular rocks showed positive correlations, and both duration
10
characteristics and SPI-nduration correlations were significant (α=0.1).
PROPWET has significant correlations with all the drought characteristics (except ther value associated with SPI-n). Positive relationships were found between PROP-WET and the number of events, severity characteristics and ther value associated with SPI-n. The remaining drought characteristics had negative correlations with
PROP-15
WET. The percentage of shallow gleyed soils were third most strongly correlated with the number of events, median duration and median severity. It showed similar cor-relations to those of PROPWET, but corcor-relations were generally stronger and more significant. The percentage of peat soils showed similar, if weaker and less significant, correlations to the percentage of shallow gleyed soils and PROPWET. The percentage
20
of no gleyed soil shows correlations of a similar strength and significance to the per-centage of shallow gleyed soils but of the opposite sign (i.e. where the perper-centage of shallow gleyed soils correlations were positive, the percentage of no gleyed soils were negative, and vice versa). In contrast the percentage of deep gleyed soils showed very weak or no correlation with the drought characteristics.
25
The percentage of arable land and grassland were significantly (α=0.1, 0.01 or 0.001) correlated for all drought characteristics, with the exception of ther value as-sociated with SPI-n. The percentage of grassland showed correlations of the opposite sign, where the percentage of arable land had a positive correlation with drought
char-HESSD
12, 12827–12875, 2015 From meteorological to hydrological drought using standardised indicators L. J. Barker et al. Title Page Abstract Introduction Conclusions References Tables Figures J I J I Back CloseFull Screen / Esc
Printer-friendly Version Interactive Discussion Discussion P a per | Discussion P a per | Discussion P a per | Discussion P a per
acteristics the percentage of grassland had a negative correlation. The percentage of woodland showed significant correlations, of the same sign as the percentage of grassland, between the number of events, median duration, median severity, maximum severity (α=0.1) and SPI-nduration (α=0.01).
All drought characteristics were weakly correlated to catchment properties such as
5
area, slope, the percentage of mountain, heathland and bog and elevation properties (generally non-significant). The use of “near natural” Benchmark catchments meant that they are little influenced by urban areas or regulation, as such the catchment prop-erties urban extent and FARL were excluded from the analysis.
5 Discussion
10
5.1 Drought characteristics
Overall, the results show that, for shorter accumulation periods, there is comparatively little difference between catchment types (as shown by the clusters, Fig. 2) or around the country in SPI drought characteristics (Fig. 3). Although the UK has an order of magnitude precipitation gradient across the country, there is little difference in the
me-15
dian of the meteorological drought characteristics using the SPI. Similarly, Van Loon and Laaha (2015) also found little spatial variation in the number and average duration of meteorological events between clusters of Austrian catchments. However, in this study there are pronounced regional differences in the maximum drought duration and severity, which is supported by Folland et al. (2015) who note that the north-west has
20
a more variable climate and the south-east is subject to longer dry spells, and that in practice the two regions experience droughts in opposition.
In contrast to SPI, SSI drought characteristics show distinct regional variations and differences between catchment types. SSI-1 and SSI-6 results for the UK show fewer, longer, more severe droughts occurring in southern and eastern regions of England,
25
HESSD
12, 12827–12875, 2015 From meteorological to hydrological drought using standardised indicators L. J. Barker et al. Title Page Abstract Introduction Conclusions References Tables Figures J I J I Back CloseFull Screen / Esc
Printer-friendly Version Interactive Discussion Discussion P a per | Discussion P a per | Discussion P a per | Discussion P a per |
and 5). These results parallel those seen in Vidal et al. (2010), who found fewer, but longer, more severe events in gridded, modelled streamflow data in northern France, which is dominated by groundwater-fed rivers and large aquifer systems, than in south-ern France. These results show that although standardisation is carried out for each month, the month-to-month autocorrelation in streamflow means that droughts defined
5
for a given SSI threshold can take on very different characteristics around the country, according to hydrological memory.
Given the climatological gradient in the UK, the long, severe droughts identified us-ing SPI-18 and SSI-18 in Scotland were unexpected (Figs. 3 and 5). Previous studies characterise droughts in Scotland as being shorter and less severe than those in the
10
south and east of England (Jones and Lister, 1998; Marsh et al., 2007). These appar-ent long droughts are a result of strong long-term increasing temporal trends in run-off, primarily driven by the inter-decadal variability in the North Atlantic Oscillation, as have been widely reported (e.g. Hannaford, 2015). As there is a strong trend, the standardi-sation approach makes it appear that there is one long drought early in the record, and
15
pronounced wetness at the end (Figs. 6 and 7). In one sense, this is a perfectly valid finding, the dryness of the early period is important in some applications – e.g. if trying to look nationally or on a European scale at long meteorological droughts. However, in another sense, it is misleading, as “droughts” (in terms of triggering a particular im-pact) of 18 months duration are less influential on reservoir levels and water resources
20
planning in north-west Britain. This is, in part, due to the lack of sub-surface storage in these responsive catchments. A short and intermittent wet spell can “reset” the catch-ment to normal conditions as there is limited storage in which to build up deficits. The dangers of using standardised indicators in the presence of non-stationarity and multi-decadal variability have been highlighted elsewhere; Nuñez et al. (2014) found that, in
25
Chile, higher drought declaration recurrence based on the SSI-3 was associated with cool periods of the Pacific Decadal Oscillation (PDO). Similarly, in the USA McCabe et al. (2004) found over half the spatial and temporal variability in long-term drought frequency was caused by the PDO and the Atlantic Multidecadal Oscillation.
HESSD
12, 12827–12875, 2015 From meteorological to hydrological drought using standardised indicators L. J. Barker et al. Title Page Abstract Introduction Conclusions References Tables Figures J I J I Back CloseFull Screen / Esc
Printer-friendly Version Interactive Discussion Discussion P a per | Discussion P a per | Discussion P a per | Discussion P a per 5.2 Drought propagation
The mapping of SPI-n(SPI accumulation period most strongly correlated with SSI-1) in Fig. 8, identified a strong spatial pattern reflecting the north-west to south-east pre-cipitation and geological gradient found in the UK. Many of those catchments in the south and east where the SPI-nduration is longer are located in regions underlain by
5
major aquifers. In 14 boreholes in England and Wales, Bloomfield and Marchant (2013) found that the Standardised Groundwater Index (SGI) was most strongly correlated to SPI accumulation periods of 6–28 months. The SPI accumulation period most related to the SGI was site specific and related to hydrogeological properties of the aquifers. Similar results were found in southern Germany and central Netherlands, where the
10
maximum correlation between SGI and SPI was found at SPI accumulation periods of 3–24 months (Kumar et al., 2015). In a study of Iberian catchments, Lorenzo-Lacruz et al. (2013b) found SSI-1 was more strongly correlated to SPI-12 in southern Spain, where many catchments have limestone headwaters, contrasting with catchments on less permeable geologies which showed stronger correlations for short SPI
accumu-15
lation periods. In a catchment in the central Spanish Pyrenes, Vicente-Serrano and López-Moreno (2005) found that SPI was strongly correlated to standardised stream-flow over accumulation periods of one to three months. At longer accumulation periods (greater than three months, particularly so for accumulation periods greater than 12 months) the usefulness of the SPI to monitor hydrological drought was questionable in
20
this mountainous catchment where, in the headwaters, there is little storage and runoff generation is very quick.
Figure 9 shows the strong correlations of SSI-1 with a range of SPI accumulation periods. Although, in general, catchments in the south and east can be said to be per-meable, there is a range of geologies and not all catchments are highly permeable
25
or are largely influenced by groundwater. In less permeable catchments, the strong correlations at long SPI accumulation periods are likely to be partially a result of the stronger seasonality in the south and east where evapotranspiration is higher (Kay
HESSD
12, 12827–12875, 2015 From meteorological to hydrological drought using standardised indicators L. J. Barker et al. Title Page Abstract Introduction Conclusions References Tables Figures J I J I Back CloseFull Screen / Esc
Printer-friendly Version Interactive Discussion Discussion P a per | Discussion P a per | Discussion P a per | Discussion P a per |
et al., 2013). Where this enhanced seasonality in effective rainfall (precipitation minus evapotranspiration) induces a stronger relationship between streamflow on successive days, autocorrelation in streamflow increases (Chiverton et al., 2015b). This autocor-relation favours the longer SPI accumulation periods.
The lagged correlations for the Lambourn, Thet and the Great Stour all show strong
5
correlations across both a range of lags and SPI accumulation periods (Fig. 10) just as the lagged correlations of SPI do with the SGI (Bloomfield and Marchant, 2013). While we find (along with Folland et al., 2015) the strongest correlation with stream-flow occurs when SPI is not lagged, the presence of strong correlations even at lags of several months (up to six months, in some cases) demonstrates potential for early
10
warning of hydrological drought based on persistence of meteorological anomalies. In-deed, this characteristic is already used for making successful seasonal streamflow forecasts based on persistence in the UK (Svensson, 2014). This forecasting method currently estimates whether flows are likely to be in high, medium or low bins, but the results presented here suggests further work could focus more specifically on drought
15
indicators. The rivers in the north and west, however, do not benefit from the slow re-lease of stored groundwater; instead, methods that reflect the expected meteorological conditions are needed for making skilful streamflow forecasts (Svensson et al., 2015a). The closeness of the lagged SPI-n and the largest lag for which there is significant autocorrelation in SSI-1 (autocorrelation max) suggests that SPI-nis dependent on the
20
autocorrelation in monthly flows – indeed, lagged SPI-nand the autocorrelation max are significantly correlated (r=0.85,α=0.001).
5.3 Links with climate and catchment properties
Analysis of precipitation and drought characteristics showed that for upland catchments (clusters one and two), the general precipitation climate (characterised by SAAR) was
25
much more important in influencing drought characteristics (Table 3) than in lowland catchments (clusters three and four; Table 3, Fig. 12). Table 3 and Fig. 11 also show the strong relationship between SAAR and the drought characteristics for all catchments
HESSD
12, 12827–12875, 2015 From meteorological to hydrological drought using standardised indicators L. J. Barker et al. Title Page Abstract Introduction Conclusions References Tables Figures J I J I Back CloseFull Screen / Esc
Printer-friendly Version Interactive Discussion Discussion P a per | Discussion P a per | Discussion P a per | Discussion P a per
together, a result of the prominent precipitation gradient seen between the north-west and the south-east of the UK. Similarly, Haslinger et al. (2014) found that climate was more influential than catchment properties in Austrian catchments where small-scale geological differences could not explain the variation in correlation significance be-tween streamflow and meteorological drought indices across four geologically similar
5
regions. Precipitation was also found to be necessary to formulate a significant model of median hydrological drought duration, in addition to catchment properties, in Austrian catchments (Van Loon and Laaha, 2015). A combination of the weather type (based on the objective Grosswetterlagan weather classification) and catchment properties was found to contribute to the hydrological response time in catchments across the UK
10
and Denmark (Fleig et al., 2011). On a broader scale, in a study of 808 near-natural streamflow records in Europe and the USA, Tijdeman et al. (2015) found that climate classification systems that included absolute precipitation were best for differentiating catchments based on drought duration. In addition, BFI, the seasonality of precipita-tion and the occurrence of hot summers were important individual controls on drought
15
duration.
For clusters three and four, mainly located in the lowland south and east of the UK, SAAR was weakly correlated to drought characteristics (Table 3, Fig. 12). A small range of, and generally lower, average annual precipitation, and the presence of permeable aquifer outcrops, means that catchment properties, particularly those related to
catch-20
ment storage (for example, BFI, percentage of highly productive fractured rock and PROPWET), are more influential than SAAR in determining the drought and propaga-tion characteristics (Fig. 13). Groundwater storage and responsiveness has been found to be important in determining drought duration and severity. In Austrian catchments, Van Loon and Laaha (2015) found that the mean duration of streamflow droughts had
25
a strong positive correlation with BFI as was found in this study for clusters three and four (Fig. 13). Van Loon and Laaha (2015) also found that other catchment properties representative of catchment storage, such as aquifer depth and the presence of lakes and wetlands, had weak correlations with mean discharge drought duration. In the
HESSD
12, 12827–12875, 2015 From meteorological to hydrological drought using standardised indicators L. J. Barker et al. Title Page Abstract Introduction Conclusions References Tables Figures J I J I Back CloseFull Screen / Esc
Printer-friendly Version Interactive Discussion Discussion P a per | Discussion P a per | Discussion P a per | Discussion P a per |
present study, stronger positive correlations were found between drought duration and the percentage of highly productive fractured rock and the percentage of the catchment with no gleyed soils. The weaker relationships in the Austrian study were thought, how-ever, to be a result of missing data for some of the catchment properties, rather than a lack of influence (Van Loon and Laaha, 2015).
5
Laizé and Hannah (2010) found slope, BFIHOST (a measure of catchment respon-siveness derived using the HOST classification; Boorman et al., 1995), percentage of arable land, elevation and bedrock permeability to significantly influence seasonal flows in Benchmark catchments. They classified catchments into upland impermeable, low-land permeable and lowlow-land impermeable groups. In lowlow-land permeable catchments,
10
regional climate was a poorer predictor of streamflow due to the climate buffering pro-vided by the permeable catchment. Chiverton et al. (2015a) found that BFIHOST, the percentage of highly productive fractured rock, the depth to the gleyed soil layer, the percentage of arable land, slope and PROPWET were all significant catchment prop-erties influencing the temporal dependence of flows in UK Benchmark catchments.
15
Temporal dependence can be thought of as indicative of the average lag between meteorological and hydrological signals; catchments in clusters one and two (three and four) showed less (more) temporal dependence in flows (Chiverton et al., 2015a). A similar pattern was found here in the SPI-nduration, with shorter (longer) SPI accu-mulation periods being most strongly correlated in clusters one and two (clusters three
20
and four).
Chiverton et al. (2015a) found the percentage of arable land to be the best catch-ment property to distinguish clusters based on the temporal dependence of streamflow. However, they argued that this was likely due to the positive relationship with the per-centage of highly productive fractured rock and the negative relationship with other
25
catchment properties such as high elevations and PROPWET. Arable land, in effect, characterises permeable, lowland well-drained catchments with high storage. In Aus-trian catchments, forest cover was positively, but weakly, correlated to both discharge drought mean duration and mean deficit (Van Loon and Laaha, 2015). In the present
HESSD
12, 12827–12875, 2015 From meteorological to hydrological drought using standardised indicators L. J. Barker et al. Title Page Abstract Introduction Conclusions References Tables Figures J I J I Back CloseFull Screen / Esc
Printer-friendly Version Interactive Discussion Discussion P a per | Discussion P a per | Discussion P a per | Discussion P a per
study, the percentage of woodland was significantly (α=0.1), although weakly, corre-lated to the percentage of no gleyed soils, BFI, the percentage of highly productive fractured rock and area (r=−0.37, −0.37, −0.33, −0.28, respectively). As such, it is more likely that the significant relationships between woodland and drought character-istics is a result of the soil and geology types associated with the woodland land cover
5
rather than the presence (or absence) of woodland itself.
5.4 Implications for drought monitoring and early warning
The SPI is widely used in existing drought M&EW systems, but the SSI is less widely adopted (Bachmair et al., 2015b). This may be a result of the poorer availability of streamflow data in comparison to precipitation data, especially at the short time scales
10
involved in producing useful drought M&EW products. However, the monitoring of hy-drological variables and the incorporation of hyhy-drological drought indices is beneficial for effective drought planning and management, and it is particularly useful for commu-nication purposes if both precipitation and streamflow are monitored in a comparable way. In locations where streamflow data is available, the SSI can be used directly in
15
drought M&EW. While this is preferable, SPI could potentially provide a surrogate for hydrological impacts, provided appropriate response times are known.
The correlation results, Fig. 8, exploring relationships between SSI-1 and SPI-n, give an indication of accumulation periods that could stand as proxies for hydrological droughts in monthly precipitation data. This allows the more widely available, up-to-date
20
precipitation data to be used for identifying potential hydrological droughts. The identifi-cation of these relationships could also allow estimation in areas where no streamflow data exists, based on precipitation data; the most suitable timescales for monitoring could be estimated based on widely available climate and catchment descriptors (in particular SAAR and BFIHOST which is available at ungauged locations; Boorman
25
et al., 1995).
The results also highlight some of the problems with using the SPI and SSI when calculated for long accumulation periods for locations that have seen an increasing, or
HESSD
12, 12827–12875, 2015 From meteorological to hydrological drought using standardised indicators L. J. Barker et al. Title Page Abstract Introduction Conclusions References Tables Figures J I J I Back CloseFull Screen / Esc
Printer-friendly Version Interactive Discussion Discussion P a per | Discussion P a per | Discussion P a per | Discussion P a per |
decreasing, long-term trend in precipitation or streamflow such as Scotland. Although being able to calculate SPI or SSI for any user-defined accumulation period makes the indicators more flexible, it is essential that meaningful accumulation periods should be chosen to capture the drought characteristics typical of current meteorological or hydrological conditions (Vicente-Serrano and López-Moreno, 2005). For example, the
5
long, severe droughts shown in Scotland for both SPI and SSI for the 18 month accu-mulation period (Figs. 3 and 5) are not typical of the droughts that have been observed (Marsh et al., 2007). The shorter droughts that have been most influential for water re-sources in Scotland are better captured by shorter accumulation periods that are less confounded by the long-term increased precipitation and streamflow trends. Moreover,
10
the findings reaffirm that chosen accumulation periods should be based on likely im-pacts; Bachmair et al. (2015a) observed that short SPI periods are linked to impacts in northwest Britain while longer SPI periods trigger impacts in the southeast.
5.5 Further research
With the importance of groundwater, particularly in the south and east of England for
15
water supply, to understand fully drought characteristics and propagation, it is nec-essary to include a groundwater component to the analysis. Furthermore, although catchment storage plays a key role in determining drought characteristics and prop-agation in the south and east, the seasonality and autocorrelation of streamflow, as a result of evapotranspiration, will also be influential. Undertaking propagation analysis
20
though the hydrological cycle, using the Standardised Precipitation Evapotranspiration Index (SPEI, Vicente-Serrano et al., 2010), the Standardised Streamflow Index (Ser-rano et al., 2012b; Lorenzo-Lacruz et al., 2013a) and the Standardised Groundwater Index (SGI, Bloomfield and Marchant, 2013a) would therefore give a clearer picture of the climate and catchment properties influential on drought duration, severity and
25
propagation, paving the way for even more integrated drought M&EW.
The use of near-natural Benchmark catchments in this study has allowed the in-vestigation of drought characteristics and propagation processes without results being
HESSD
12, 12827–12875, 2015 From meteorological to hydrological drought using standardised indicators L. J. Barker et al. Title Page Abstract Introduction Conclusions References Tables Figures J I J I Back CloseFull Screen / Esc
Printer-friendly Version Interactive Discussion Discussion P a per | Discussion P a per | Discussion P a per | Discussion P a per
confounded by artificial influences. However, it is often man-made systems that the human population is most reliant upon for water supply, agriculture etc. Understanding these processes in catchments affected by anthropogenic activities is crucial for truly effective drought M&EW systems. Further work on the drought and propagation char-acteristics in these modified systems will be much more challenging (Van Loon, 2015).
5
It is likely that the combination of human activities, alongside natural catchment and climate characteristics, will produce more divergent results. However, the results from this study could be used to stratify catchments based on their climate and catchment properties when tackling in the challenges of quantifying drought hazard in catchments with anthropogenic modifications.
10
6 Conclusions
Meteorological and hydrological drought characteristics and propagation behaviours of 121 near-natural UK catchments were analysed using SPI and SSI over a range of accumulation periods. Meteorological drought duration and severity characteristics showed little spatial variability, whilst hydrological drought characteristics showed many
15
(few), short (long), less (more) severe events in the north and west (south and east) of the UK. Catchments underlain by aquifers tended to show more of a delay in the propagation of drought from meteorological to hydrological drought, with longer SPI accumulation periods most strongly correlated with SSI-1. Standard-period annual av-erage rainfall was found to be important for drought duration, severity and propagation
20
in the north and west of the UK where catchment storage is generally low, whilst in the south and east, catchment storage and other catchment properties are more in-fluential on drought duration, severity and propagation. The greater understanding of the UK drought hazard provided by this study can be used as a foundation for future developments of M&EW in the UK, paving the way for better drought preparedness and
25