Intelligence Solution
José Luís Pereira1 and Marco Costa1,1 Universidade do Minho, Departamento de Sistemas de Informação, Campus de Azurém, Guimarães, Portugal
[email protected], [email protected]
Abstract. In the last few years we all have witnessed an enormous growth in the production of data. According to some estimates, ninety percent of the existing world’s data was created over the past two years! Indeed, we are in the era of Big Data which is characterized by the continuous creation of vast amounts of data, originated from different sources, and with different formats. First, with the rise of smart devices, mobile applications, cloud computing, and social networks and, more recently, with the advent of the Internet of Things (IoT), data with enormous potential for organizations is being continuously generated. In order to be more competitive, organizations want to access and explore all the richness that is present in those data, which is the main purpose of Business Intelligence. In this paper we continue the presentation of an experiment in which data obtained from a NoSQL database (database technology explicitly developed to deal with the specificities of Big Data) is used to feed a Business Intelligence solution.
Keywords: Big Data, NoSQL, Business Intelligence, Dashboard, Pentaho.
1 Introduction
According to IDC, ninety percent of the existing world’s data was created over the past two years [1]. IBM confirms these figures stating that, as of 2012, every single day 2.5 Exabyte (2.5 X 1018 bytes) of data were generated. Due to the explosion in the use of smart devices, mobile applications, cloud computing, and social media, we have witnessed an increase in the volume of data that is produced by organizations and by people in their daily life activities. In the latter case, as a result of the boom occurred with social networks, increasing amounts of data are being generated by people. Of course, these new data have great potential for organizations as a source of insight about people needs, opinions, market tendencies, and so on.
In the near future, with the so-called Internet of Things (IoT), in which virtually any electronic device with processing capacity will be integrated in the Internet, generating and consuming data, the amount of data we will have to deal with will increase dramatically.
ÓSpringer International Publishing Switzerland 2016
Á. Rocha et al. (eds.),New Advances in Information Systems and Technologies,
Advances in Intelligent Systems and Computing 444, DOI 10.1007/978-3-319-31232-3_93
These new data come in larger amounts, at higher rates, from different sources, and with distinct features. In this context one might distinguish among three kinds of data to store and process [2]:
• Structured data – data with a rigid and previously known structure, in which all elements share the same format and size. This is the kind of data, traditionally found in business applications, that has been stored in relational databases;
• Semi-structured data – data with a high degree of heterogeneity, which is not easily represented in fixed data structures. Typically, these kind of data have been stored using specific languages such as XML (Extensible Markup Language) data, RDF (Resource Description Framework) data, and so on; • Unstructured data – data without a structure, such as text, video, or
multimedia content. In this group one can find the kind of data which has grown exponentially in the last decade, with some estimates pointing that, nowadays, as much as 90% of the generated data is unstructured data. Examples include documents, images, photos, email messages, webpages, and so on.
Although, much of the data growth has been in unstructured data, IDC estimates that by 2020, business transactions on the Internet – B2B and B2C – will reach 450 billion per day [3].
In a few words, this is what characterizes the era of the Big Data: huge amounts of both structured and unstructured data, produced and consumed at increasing higher rates. These new features constitute an enormous challenge to the more traditional relational database technology. To answer to the new challenges created by Big Data, a new family of database technologies has emerged – the NoSQL databases.
In the present there are four families of NoSQL databases (Document, Column, Key/Value and Graph databases), each one of them with their own characteristics, strengths and weaknesses, but all sharing the same goal: to deal with the new challenges brought by Big Data [4], [5].
Despite their youth, NoSQL databases are becoming major players in the database market. For instance, DB-Engines (http://db-engines.com/en/ranking), a well-known ranking site which ranks databases according to their popularity, puts three NoSQL databases in the top 10: MongoDB, Cassandra and Redis1.
With Big Data organizations understood the enormous potential underlying those vast amounts of available data. Indeed, Big Data is only as valuable as the insights organizations gather from it to make better decisions. They only have to use the right tools to treat those data, in order to better understand their business and their market. Business Intelligence (BI) tools are what organizations need to access those data and extract the insights needed to make the best decisions and outshine their competition.
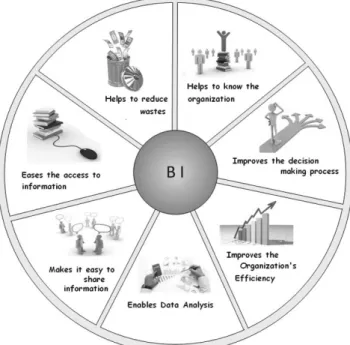
Organizations can benefit in several ways when they decide to develop and use BI solutions. Ranging from a better understanding of their business operations, to an easier sharing of information among decision makers, or improving the decision making process, there are multiple advantages (see Fig. 1).
1 Site accessed in December, 2015.
Fig. 1. Organizational Benefits of a BI Solution
In this paper, we continue the presentation of the development of a BI solution, which is being used by a Portuguese firm, that we have initiated in another paper [6]. This firm deals with the detection and monitoring of people movements in closed spaces, using a very common and disseminated technology – GSM (Global System for Mobile Communications), which we all use, nowadays, in our mobile phones. In this project, client movements in a shop of a large shopping mall was used as an example. The purpose of the BI solution is to provide decision makers with information about the habits of the shoppers, time spent in shopping, shop zones visited, etc., which is needed for them to decide how to better organize the shopping space.
Concerning the structure of the paper, after a very brief presentation of the main concepts around Big Data and the database technology that promises to solve its major challenges – NoSQL databases, we made a very concise introduction to the area of Business Intelligence, stressing its value to support decision-making in organizations. In the next sections, we describe a development project in which data captured from a NoSQL database is used to feed a specific BI solution. To begin with, we describe the real context in which the BI solution is to be used and then we quickly advance to its development. We divided this project in two parts: the first part deals with the extraction, transformation and loading (ETL) of the NoSQL data into a local database; the second part of the project involves the construction of a dashboard to present data in order to support decision-making. In this paper we present some components of the developed dashboard, that complement the set of components presented in our previous paper [6]. Finally, some conclusions about the project are offered and future work is envisaged.
2 Description of the Project Context
In order to better manage a shopping mall, decision makers would like to know simple facts such as “how many visitors walk by a shop?”, “how many visitors enter a shop?”, “how many visitors made acquisitions?”, “which are the busiest and the quietest hours?”, “How much time shoppers spend in the shop?”, “which are the zones most visited in a shop?”, and so on. In order to accomplish that, a system for the detection and monitoring of people movements in space must be in place. Luckily, nowadays almost everyone use mobile phones so, making use of the GSM technology, in particular using the IMEI (International Mobile Equipment Identity) and the IMSI (International Mobile Subscriber Identity), one can easily trace the movements of people in a monitored space. This is a very convenient solution as those “mobile identifiers” are never switched off (mobile phones only stop emitting a signal if their battery is removed). Therefore, with a convenient distribution of GSM sensors in a given space one can trace the movements of people in that area.
The data used in this project were obtained mostly through sensors installed in a sporting goods store located in a large shopping mall. Data are collected and stored in a NoSQL database (in this case, a Cassandra system), all day long, every day of the week, non-stop, thus generating large amounts of data. Using an API (Application Program Interface), the Cassandra database provides access to the data in the JSON format (JavaScript Object Notation), which is a very simple a convenient format. These data are used to feed the developed BI solution.
The development of the BI solution involved two parts. In the first part, data are retrieved from Cassandra using the provided API and, after some processing tasks, are stored in a local database. In the second part a suitable dashboard is developed, according to the needs of decision makers.
Regarding the technologies used in the development of the BI solution, in addition to the PostgreSQL used to manage the data repository, we used the Pentaho family of products. In particular:
• Pentaho Data Integration (Kettle) – the solution offered by Pentaho for ETL. In this project Kettle was used to extract data from the provided Cassandra API, do the necessary treatments, and store the resulting data in the PostgreSQL database [7];
• Pentaho BI Platform – A platform that allows us to take the data from the repository and turn it into useful information for decision makers, by providing tools for creating reports, information panels, or dashboards [8]. In the next section, the first part of the project is briefly described.
3 The Business Intelligence Solution – Part I
By definition, BI is the collection of methods and tools that allow organizations to transform data into valuable information to support decision-making [9]. Since data may come from different sources and in a multitude of formats, BI tools need to have the capacity to Extract data from those sources, to Transform those data (selecting,
cleaning, joining, calculating, coding/decoding, etc.) according to the purpose of the solution, and to Load the data into a repository commonly known as Data Warehouse (DW) (see Fig. 2).
Fig. 2. The Extracting, Transformation and Loading (ETL) Process
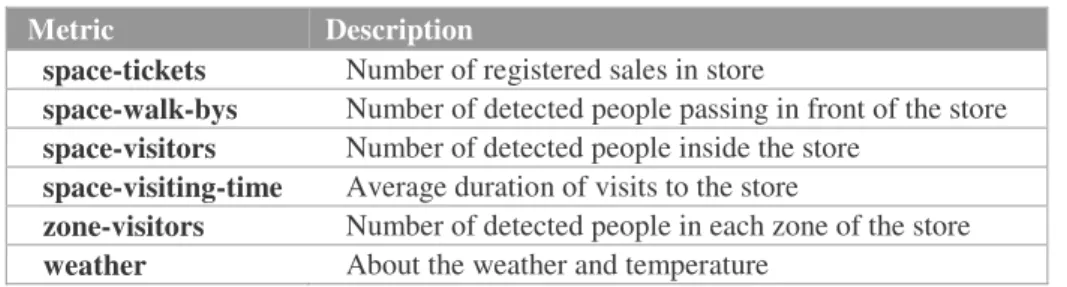
In this specific project, in order to develop a BI solution adequate to the needs of decision makers, regarding the management of a sporting goods store located in a shopping mall, we need to access data from which we may extract some metrics.
The following table (Table 1) summarizes those data.
Table 1. Data needed for Decision-Making.
Metric Description
space-tickets Number of registered sales in store
space-walk-bys Number of detected people passing in front of the store space-visitors Number of detected people inside the store
space-visiting-time Average duration of visits to the store
zone-visitors Number of detected people in each zone of the store weather About the weather and temperature
To get those data using the provided API, a request such as the following has to be made:
https://(...)/days/2015-08-15T00:00:00Z/2015-08-16T23:00:00Z?metrics=space-visitors:hour:series
In this example we issued a request to search for data about the number of visits to that store from 15 of August to 16 of August of 2015.
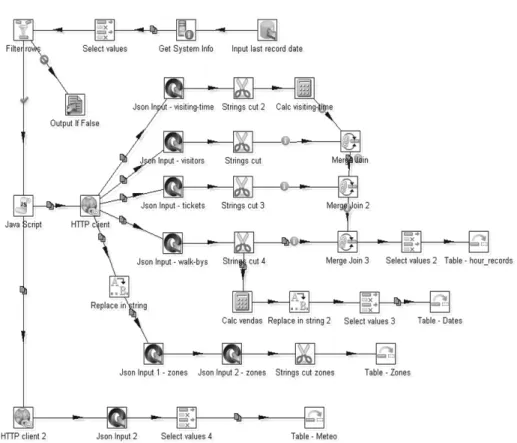
To obtain data from Cassandra, and to process and store them into a local database (PostgreSQL) a set of ETL steps were developed in Kettle. This specific ETL was developed in order to be autonomous, that is, it does not require the user to enter the dates in the requests to the API provided. In Fig. 3 we can see the developed ETL steps, used to extract data from the provided API, do the necessary transformations, and finally load/refresh the data in the local database (tables Zones, Dates, Hour_records and Meteo).
Fig. 3. The ETL used to load and refresh the local PostgreSQL database tables
Unfortunately, due to space limitations, this is not the place to explain each one of the steps in the ETL above. Anyway, the experience using the graphical interface of Kettle (named Spoon) to develop ETL has been quite interesting and rewarding. Spoon has a wide range of steps, such as Data Input and Output, Statistics, Validation, Mapping, Utilities, and so on, which may be added to the workspace in a drag-and-drop fashion.
4 The Business Intelligence Solution – Part II
In addition to the ETL capabilities, BI tools provide the mechanisms to build suitable information delivery front-ends for decision makers, such as reports and dashboards (see Fig. 4). Thus, the second part of the development of the BI solution involves the exploitation of the Pentaho BI Platform tool to visually display the data previously collected through a dashboard. This dashboard is composed of several components, such as graphics, tables and even a map of the store. It was developed using a tool named CDE (Community Dashboard Editor), an open source tool designed to simplify the creation and editing of dashboards.
Fig. 4. The BI Solution Information Delivery Front-Ends
The first thing to do in the development of a dashboard is to identify “what” information we would like to have and “how” it should be displayed. In this specific case, it was decided that the dashboard should include the following elements, among others [6]:
• Element 1 - The value of the metrics ‘space-walk-bys’, ‘space-visitors’ and ‘space-tickets’, compared to the maximum recorded in a previous month; • Element 2 – The relation between the metrics visitors’ and
‘space-walk-bys’ in the form of an area chart;
• Element 3 - Proportion of the metrics ‘space-walk-bys’, ‘space-visitors’ and ‘space-tickets’;
• Element 4 - Overview of the metric ‘space-visiting-time’ over a given day; • Element 5 – Map of the store indicating the ‘zone-visitors’.
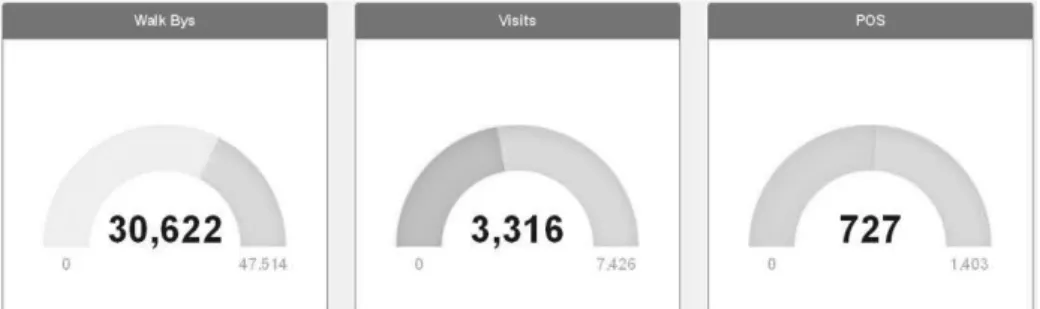
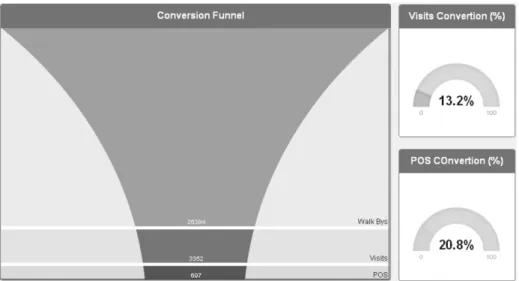
Regarding the Element 1 of the dashboard, a ‘Gauge Component’ to visualize each of the three metrics required was used (Fig. 5). This element allows decision makers to know “how many visits the store received in a given day, and how does it relates to the maximum recorded in a month?”. With this component the metric value is displayed within a range, thus giving the user a better sense of the magnitude of its value. The range is set between 0 and the maximum value recorded in the current month. These components receive eight values: the title, the value of the metric, the minimum value of the scale, the maximum value of the scale, the main color of the component, and the colors of the minimum, medium, and maximum values.
An example of a component to illustrate the Element 2 of the dashboard appears in Fig. 6. An area chart which allows us to relate the metrics visitors’ and ‘space-walk-bys’ in a given day, along with three text components, highlighting the hours and the maximum and minimum values recorded for the metric ‘space-walk-bys’ and the average value of the selected day.
Fig. 6. The relation between the metrics ‘space-visitors’ and ‘space-walk-bys’ in a given day
The Element 3 of the dashboard gives users of the BI solution a more comprehensive analysis of the metrics walk-bys', visitors' and 'space-tickets', showing the proportion between these three metrics (Fig. 7). This element allows decision makers to know “Which is the proportion between the people who has passed in the front of the store, the people who had entered the store, and the people who had actually shopped something?”.
The Element 4 of the dashboard was implemented using the component in Fig. 8, below. This element allow us to know “how long the costumers remain inside the shop during the day?”.
Fig. 8. Overview of the metric ‘space-visiting-time’ over a given day
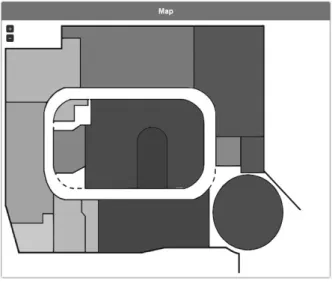
Finally, the Element 5 of the dashboard intends to illustrate the areas of the store that are most visited by shoppers (Fig. 9). This element allows decision makers to know “Which store areas are receiving more attention by people?”
Fig. 9. The most visited areas of the store
This ends the second part of the BI solution development project, with a dashboard which includes five components (among others that we have already presented in another paper). The main purpose is to allow decision-makers to better understand what happens in the store and so, making them more able to manage their business.
5 Conclusions
With this paper we have concluded the presentation of a project involving the development of a Business Intelligence (BI) solution which gets its data from a
non-traditional source. The purpose of the project was to experiment the use of BI tools in a context close to those known as Big Data, in which a new kind of database technology is used to store data – NoSQL databases.
The setting of the project comprises a sporting goods store located in a large shopping mall, in which the movement of visitors, around and inside the store, as long as the time spent in each zone of the store is constantly monitored and the corresponding data registered in a NoSQL database (in this case, a Cassandra system). Those data, completed with data about sales, allowed the definition of several metrics in order to understand the behavior of visitors.
As we have claimed in a previous paper, BI solutions allow decision-makers to easily understand what is going on with their business, in order to make the best decisions. In the era of Big Data, with the enormous amounts of data which are available to organizations, BI solutions are even more relevant to their success. This project showed us that, using suitable BI tools, one can develop solid BI solutions, very quickly and with a small amount of resources.
Regarding the dashboard developed during the project, despite the wide range of components available to the Pentaho community, not all of the desired functionality was available in the components we have used. This has not proved to be an obstacle since, as usually happens with open source environments, it was possible to change existing components in order to create the new desired functionalities.
References
1. Vesset, D., Woo, B., Morris, H.D., Villars, R.L. et. al. (2012). Worldwide Big Data Technology and Services 2012-2015 Forecast (IDC, March, 2012).
2. Halper, F., & Krishnan, K. (2014). TDWI Big Data Maturity Model Guide Interpreting Your Assessment Score. TDWI Benchmark Guide 2013–2014.
3. Reinsel, D. & Gantz, J. (2012). The Digital Universe in 2020: Big Data, Bigger Digital Shadows, and Biggest Growth in the Far East (IDC, December, 2012).
4. Cunha, J.P., & Pereira, J.L. (2015). Column-Based Databases: Estudo Exploratório no Âmbito das Bases de Dados NoSQL. Proceedings da 15ª Conferência da Associação Portuguesa de Sistemas de Informação. CAPSI 2015. Lisboa.
5. Sousa, G., & Pereira, J.L. (2015). Document-Based Databases: Estudo Exploratório no Âmbito das Bases de Dados NoSQL. Proceedings da 15ª Conferência da Associação Portuguesa de Sistemas de Informação. CAPSI 2015. Lisboa.
6. Costa, M., & Pereira. J.L. (2015). From a NoSQL Data Source to a Business Intelligence Solution: An Experiment. Proceedings of the 4th International Conference on Virtual and Networked Organizations, Emergent Technologies and Tools. ViNOrg 2015. Póvoa de Varzim – Portugal.
7. PDI. (2015). “Pentaho Data Integration - Kettle ETL tool” ( http://etl-tools.info/en/pentaho/kettle-etl.htm; accessed in April of 2015). 8. PBIP. (2015). “Pentaho Business Intelligence Platform”
(http://www.pentaho.com/product/business-visualization-analytics; accessed in June of 2015).
9. Kimball, R., & Ross, M. (2013). The Data Warehouse Toolkit: The Definitive Guide to Dimensional Modeling, 3rd Edition, Wiley.