Florida International University Florida International University
FIU Digital Commons
FIU Digital Commons
FIU Electronic Theses and Dissertations University Graduate School
10-12-2018
A Neuroimaging Web Interface for Data Acquisition, Processing
A Neuroimaging Web Interface for Data Acquisition, Processing
and Visualization of Multimodal Brain Images
and Visualization of Multimodal Brain Images
Gabriel M. LizarragaFlorida International University, [email protected]
Follow this and additional works at: https://digitalcommons.fiu.edu/etd
Part of the Biomedical Commons, Computer and Systems Architecture Commons, Data Storage Systems Commons, and the Neurosciences Commons
Recommended Citation Recommended Citation
Lizarraga, Gabriel M., "A Neuroimaging Web Interface for Data Acquisition, Processing and Visualization of Multimodal Brain Images" (2018). FIU Electronic Theses and Dissertations. 3855.
https://digitalcommons.fiu.edu/etd/3855
This work is brought to you for free and open access by the University Graduate School at FIU Digital Commons. It has been accepted for inclusion in FIU Electronic Theses and Dissertations by an authorized administrator of FIU Digital Commons. For more information, please contact [email protected].
FLORIDA INTERNATIONAL UNIVERSITY Miami, Florida
A NEUROIMAGING WEB INTERFACE FOR DATA ACQUISITION, PROCESSING AND VISUALIZATION OF MULTIMODAL BRAIN IMAGES
A dissertation submitted in partial fulfillment of the requirements for the degree of
DOCTOR OF PHILOSOPHY in COMPUTER SCIENCE by Gabriel Lizarraga 2018
ii To: Dean John Volakis
College of Engineering and Computing
This dissertation, written by Gabriel Lizarraga, and entitled A Neuroimaging Web Interface for Data Acquisition, Processing and Visualization of Multimodal Brain Images, having been approved in respect to style and intellectual content is referred to you for judgment.
We have read this dissertation and recommend that it be approved.
_______________________________________ Naphtali Rishe _______________________________________ Giri Narasimhan _______________________________________ Mercedes Cabrerizo _______________________________________ David A Loewenstein _______________________________________ Malek Adjouadi, Major Professor
Date of Defense: October 12, 2018.
The dissertation of Gabriel Lizarraga is approved.
_______________________________________ Dean John L. Volakis College of Engineering and Computing
_______________________________________ Andrés G. Gil Vice President for Research and Economic Development and Dean of the University Graduate School
iii
© Copyright 2018 by Gabriel Lizarraga All rights reserved.
iv DEDICATION
v
ACKNOWLEDGMENTS
First, I want to express my gratitude to my mentor, Dr. Malek Adjouadi, director of the CATE lab in Florida international University. He has guided me every step of the way: from my work as an undergraduate student to my Ph.D. endeavors. I became a member of the Center for Advanced Technology and Education (CATE lab) ten years ago and have worked in many projects with other members of the lab. His constant guidance and support have allowed me to develop my potential as a researcher. It is thanks to him that I was able to find a topic of study, and meet other researchers who have provided me with support in my career endeavors.
I also want to thank the other members of my committee, Dr. Naphtali Rishe, Dr. Giri Narasimhan, Dr. Mercedes Cabrerizo, and Dr. David A Loewenstein for the counseling and support they have provided to me during my Ph.D. studies. Dr. Cabrerizo provided me with insights into epilepsy research and Dr. Loewenstein provided me with great help in assessing neuroimaging data in Alzheimer’s disease. Furthermore, I would like to thank Dr. Ranjan Duara and Mr. Warren Barker, with the Mount Sinai Medical Center (MSMC) in Miami Beach. They have provided me with invaluable guidance through their feedback and suggestions regarding medical data and all clinical aspects involving Alzheimer’s disease.
I am grateful for the continued support from the National Science Foundation (NSF) under NSF grants CNS-1532061, CNS-1551221, HRD- 0833093, CNS-1429345 and CNS-1338922. We greatly appreciate also the support of the Ware Foundation. This research is also supported through the Florida Department of Health, Ed and Ethel
vi
Moore Alzheimer's Disease Research Program, and the 1Florida ADRC (Alzheimer’s Disease Research Center) (1P50AG047266-01A1) and R01 AG047649-01A1 (David Loewenstein, PI).
Data collection and sharing for this project was funded by the Alzheimer's Disease Neuroimaging Initiative (ADNI) (National Institutes of Health Grant U01 AG024904) and DOD ADNI (Department of Defense award number W81XWH-12-2-0012). ADNI is funded by the National Institute on Aging, the National Institute of Biomedical Imaging and Bioengineering, and through generous contributions from the following: AbbVie, Alzheimer’s Association; Alzheimer’s Drug Discovery Foundation; Araclon Biotech; BioClinica, Inc.; Biogen; Bristol-Myers Squibb Company; CereSpir, Inc.; Cogstate; Eisai Inc.; Elan Pharmaceuticals, Inc.; Eli Lilly and Company; EuroImmun; F. Hoffmann-La Roche Ltd and its affiliated company Genentech, Inc.; Fujirebio; GE Healthcare; IXICO Ltd.; Janssen Alzheimer Immunotherapy Research & Development, LLC.; Johnson & Johnson Pharmaceutical Research & Development LLC.; Lumosity; Lundbeck; Merck & Co., Inc.; Meso Scale Diagnostics, LLC.; NeuroRx Research; Neurotrack Technologies; Novartis Pharmaceuticals Corporation; Pfizer Inc.; Piramal Imaging; Servier; Takeda Pharmaceutical Company; and Transition Therapeutics. The Canadian Institutes of Health Research is providing funds to support ADNI clinical sites in Canada. Private sector contributions are facilitated by the Foundation for the National Institutes of Health (www.fnih.org). The grantee organization is the Northern California Institute for Research and Education, and the study is
vii
coordinated by the Alzheimer’s Therapeutic Research Institute at the University of Southern California. ADNI data are disseminated by the Laboratory for Neuro Imaging at the University of Southern California.
viii
ABSTRACT OF THE DISSERTATION
A NEUROIMAGING WEB INTERFACE FOR DATA ACQUISITION, PROCESSING AND VISUALIZATION OF MULTIMODAL BRAIN IMAGES
by
Gabriel Lizarraga
Florida International University, 2018 Miami, Florida
Professor Malek Adjouadi, Major Professor
Structural and functional brain images are generated as essential modalities for medical experts to learn about the different functions of the brain. These images are typically visually inspected by experts. Many software packages are available to process medical images, but they are complex and difficult to use. The software packages are also hardware intensive. As a consequence, this dissertation proposes a novel Neuroimaging Web Services Interface (NWSI) as a series of processing pipelines for a common platform to store, process, visualize and share data.
The NWSI system is made up of password-protected interconnected servers accessible through a web interface. The web-interface driving the NWSI is based on Drupal, a popular open source content management system. Drupal provides a user-based platform, in which the core code for the security and design tools are updated and patched frequently. New features can be added via modules, while maintaining the core software secure and intact. The webserver architecture allows for the visualization of results and the downloading of tabulated data. Several forms are
ix
available to capture clinical data. The processing pipeline starts with a FreeSurfer (FS) reconstruction of T1-weighted MRI images. Subsequently, PET, DTI, and fMRI images can be uploaded.
The Webserver captures uploaded images and performs essential functionalities, while processing occurs in supporting servers. The computational platform is responsive and scalable. The current pipeline for PET processing calculates all regional Standardized Uptake Value ratios (SUVRs). The FS and SUVR calculations have been validated using Alzheimer's Disease Neuroimaging Initiative (ADNI) results posted at Laboratory of Neuro Imaging (LONI). The NWSI system provides access to a calibration process through the centiloid scale, consolidating Florbetapir and Florbetaben tracers in amyloid PET images. The interface also offers onsite access to machine learning algorithms, and introduces new heat maps that augment expert visual rating of PET images. NWSI has been piloted using data and expertise from Mount Sinai Medical Center, the 1Florida Alzheimer’s Disease Research Center (ADRC), Baptist Health South Florida, Nicklaus Children's Hospital, and the University of Miami. All results were obtained using our processing servers in order to maintain data validity, consistency, and minimal processing bias.
x
CHAPTER PAGE
1. Introduction ... 1
1.1 Neuroimaging Web Services Interface and Research Significance ...1
1.2 General Statement of the Research Area ...5
1.3 Research Purpose ...5
1.4 Significance of the Research ...6
1.5 Structure of the Research ...6
2. Related Work and Retrospective on Neuroimaging in AD ... 8
2.1 Existing Neuroimaging Databases ...8
2.2 Retrospective on Multimodal Imaging for AD Classification and Prediction and Measures of Caution to be Considered ...9
3. Architecture of the Neuro-Imaging Web Services Interface (NWSI) ... 17
3.1 NWSI Interface ...17
3.2 NWSI Hardware Architecture...23
3.3 Image Viewer ...25
3.4. Visual Rating Platform ...28
3.5. SVM Classification Interface ...32
3.4. Data ...35
3.4.1. The 1Florida ADRC ... 35
3.4.2. ADNI... 36
3.4.3. GAAIN (Centiloid Project) ... 36
3.4.4. Baptist Health South Florida ... 37
3.4.6. SVM Classifier Data ... 38
3.5. Cost Analysis ...39
4. Neuroimaging Capabilities ... 40
4.1 Volumetric and Cortical Thickness Calculations from Anatomical MRI ...40
4.2 PET Imaging Analysis with 18F-Florbetapir PET / 18F- Florbetaben ...41
4.3 FDG-PET in Epilepsy ...46
4.4 Diffusion Tensor Imaging (DTI) ...47
4.5 Data Conversion...48
4.6 The Co-Registration Tool (CRT) and Apply Matrix forms ...49
4.7 Brain Extraction Tool (BET) ...51
4.8 Image Display Normalization ...51
4.9 White Matter Contours on PET images ...53
4.10 Heat maps...55
4.11 Image Restoration ...61
4.11.1 Introduction ... 61
4.11.2 Problems arising from Shading ... 65
4.11.3 Methodology for Image Restoration ... 66
4.11.4 Restoration and Dependence to Type of MRI Scanner ... 69
4.11.5 Merits of the Proposed Image Restoration Methodology ... 71
4.12 SVM Classification ...71 CONTENTS
xi
4.12.1 Control vs. AD, RBF Kernel, corrected for ICV ... 72
4.12.2 Control vs. AD, Linear Kernel, corrected for ICV ... 72
4.12.3 Control vs. aMCI, Linear Kernel, corrected for ICV ... 72
4.12.4 Control vs. AD, Linear Kernel, corrected for ICV, and using MMSE ... 74
5 Validation Tests ... 77
5.11 MRI Values Validation ...77
5.12 18F-Florbetapir PET Validation ...78
5.13 18F-Florbetaben PET Validation ...78
6 Conclusion and Future Work ... 80
6.11 Retrospective...80
6.12 Main Findings ...80
6.13 Future Work ...86
LIST OF REFERENCES ... 88
xii
LIST OF TABLES
TABLE PAGE
Table 3-1: Datasets Considered. ...38 Table 4-1: Control vs. AD, with RBF Kernel, Linear Scaling, correcting for ICV. ...72 Table 4-2: Control vs. AD, with linear kernel, linear scaling, correcting for ICV. ...73 Table 4-3: Control vs. aMCI, with Linear Kernel, Linear Scaling, correcting for ICV. ...73 Table 4-4: Control vs. AD, with Linear Kernel, Linear Scaling, correcting for ICV, using MMSE. * SV: Subcortical Volumes, HS: Hippocampal Subfields, CV: Cortical volumes, TA: Thickness, SA: Surface Areas. ...74 Table 4-5: Performance average comparison of AD/Control Classification. ...76 Table 5-1: MRI Processing by Neuroimaging Web Services Interface (NWSI) Quality Control Comparisons. ...78 Table 5-2: T-Test-Paired comparing NWSI and ADNIMerge 18F-Florbetapir PET Global SUVR values. ...79 Table 5-3: T-Test-Paired comparing NWSI and CL 18F-Florbetaben PET Global SUVR values. ...79
xiii
LIST OF FIGURES
FIGURE PAGE
Figure 3-1: MRI upload form. ... 19
Figure 3-2: PET upload form. ... 20
Figure 3-3: DTI upload form. ... 21
Figure 3-4: Clinical data upload form. ... 22
Figure 3-5: Field mapping. ... 22
Figure 3-6: Virtual Architecture. ... 23
Figure 3-7: Architecture of the NeuroImaging Web Interface System. ... 24
Figure 3-8: Interactive viewer, showing surface reconstruction and anatomical MRI. ... 26
Figure 3-9: Image shows MRI, DTI and PET cross sections, ... 26
Figure 3-10: ROI Explorer: visualizing FreeSurfer Segmentation. ... 27
Figure 3-11: ROI Explorer: showing the left and Right Hippocampus and Amygdala... 28
Figure 3-12: PET rating configuration form. ... 30
Figure 3-13: Project selection as displayed to raters. ... 30
Figure 3-14: PET rating interface and individual PET to rate. ... 31
Figure 3-15: Classifier form... 33
Figure 4-1: Sample Tabulated Output for Subcortical Regions... 41
Figure 4-2: Page Listing PETs in the Account, with Links to the MRI used as reference. ... 42
Figure 4-3: Graph Showing the Distribution of all Uploaded 18F-Florbetapir PETs. .... 42
Figure 4-4: Higher Concentration of 18F-Florbetapir Shown in Warmer Colors of the Spectrum Look Up Table (LUT). ... 43
Figure 4-5: PET Image Overlaid with White Matter Surface (shown in white) and Gray Matter Surface (shown in black). The selected region’s SUVR and Name are shown. ... 43
Figure 4-6: PET Results Page Showing All SUVR Values, Links To Download Tabulated Results, and a Graph Comparing the Result to he Averages Determined in the System. ... 44
Figure 4-7: Sample Processed AD DTI. V1 Modulated by FA. ... 47
Figure 4-8: Data Convert Tool. ... 49
Figure 4-9: Co-registration Tools: Brain Registration Form. ... 50
xiv
Figure 4-11: PET Shown in the Papaya Viewer after Correcting ... 52
Figure 4-12: Left is the PET Image without White Matter Contour, and Right Image is the Same PET with the White Matter Contour; Red Circles Indicate Areas where the Tracer has Spread to the Cortical Regions. ... 53
Figure 4-13: Full Papaya Viewer with White Matter Contour, showing SUVR Value, and Anatomical Region Name. ... 54
Figure 4-14: Heat map of Cortical and Subcortical of Right and Left Hemisphere. ... 56
Figure 4-15: Heat Map of AD (Amyloid Positive) Subject. ... 57
Figure 4-16: Heat Map of Control (Amyloid Negative) Subject. ... 57
Figure 4-17: Represents the cortical volumes. Each region was assigned the value of its volume. Regions colored with deeper shades of red have larger volumes. For this Figure a Yellow/Red color map was used instead. ... 58
Figure 4-18: Slice of a heat map Epilepsy subject showing asymmetry between homologous regions. The volume of the left temporal lobe is smaller when compared to the right. ... 60
Figure 4-19: The 3D source solution (b) is also indicating the superior temporal region as the source of the seizure; the volume asymmetry (a) is also evident in the same region. ... 60
Figure 4-20: Volume of the Superior frontal region (a) also shows asymmetry and it also coincides with some 3D results (b). ... 61
Figure 4-21: Aliasing Artifact Overlapping the Occipital Region. This Image is not Usable as the Two Signals Overlap Resulting in Erroneous Results... 64
Figure 4-22: Shading in the Occipital and Frontal Regions Prevent FreeSurfer from Segmenting the Image Correctly. The Blue and Red Lines Represent the White and Gray Matter Respectively. ... 64
Figure 4-23: Subject 1 Processed by FreeSurfer with Underestimated Brain Size (Shading is Indicated by the region highlighted in Green). The Blue and Red Lines Represent the White and Gray Matter, Respectively. ... 66
Figure 4-24: Extracted Brain, with visible shading in the occipital region. ... 68
Figure 4-25: Slide where the Average Values of Gray and White Matter are within 5% of the Ones Reported by FSL FAST. ... 68
Figure 4-26: Subject 1 on the left with no correction, ICV= 1277405.93 mm3. On the right Subject 1 with the corrections, ICV 1367832.66 mm3 (diff=6.6%) The red and blue lines cover the whole brain volume. The blue and red lines represent the white and gray matter... 69 Figure 4-27: Restoration dependency on Scanner Type: with older-MRI-based ICV (Model 1) being ICV: 1367832.66104 and new ICV from the more recent MRIs
xv
(Model 2) found to be increased to 1369666.25147 (diff=1.34%) The red and blue lines are the gray and white matter. ... 70
xvi
HIPPA: Health Insurance Portability and Accountability Act
ICV: intracranial volume
LMCI: Late Mild Cognitive Impairment
LONI: Laboratory of Neuro Imaging
MCI: Mild Cognitive Impairment
MPRAGE: Magnetization-Prepared Rapid Gradient-Echo
MRI: Magnetic Resonance Imaging
NIF: Neuroscience Information Framework
NIfTI: Neuroimaging Informatics Technology Initiative
NWSI: Neuroimaging Web Services Interface
OHBM: Organization for Human Brain Mapping
OS: Operating System
PACS: Picture Archiving and Communication System
PET: Positron Emission Tomography
PHP: Hypertext Preprocessor
ROI: Region of Interest
RS: Replica Server
SUV: Standardized Uptake Values
SUVR: Standardized Uptake Value ratio
SVM: Support Vector Machine
VM: Virtual Machine
1
1. Introduction
1.1 Neuroimaging Web Services Interface and Research Significance
This dissertation introduces a new web interface and a set of computational and machine learning algorithms to store and process neuroimaging data. Non-invasive brain imaging modalities contribute considerably to the understanding of brain structure and functionality [1]. MRI (Magnetic Resonance Imaging), Positron Emission Tomography (PET), Diffusion Tensor Imaging (DTI), and Functional Magnetic Resonance Imaging (fMRI) scans, among others, allow clinicians and experts to advance their research and take informed decisions on the diagnosis and the planning of clinical and therapeutic interventions that could follow. The images obtained by these scans must first be pre-processed in order to convert them into numeric values that can be objectively assessed and analyzed. Hospitals and other research institutions can then capture, store, and view brain scans on their own picture archiving and communication system (PACS); but performing additional processing is often computationally taxing, requiring specialized software, hardware infrastructure, and image processing expertise that our Neuroimaging Web Services Interface (NWSI) is designed to offer.
In addition to the need of individual investigators to test and validate results, there is a larger neuroscience community in hospitals, clinics and medical institutes that can benefit from this integrated processing platform. Data mining and data sharing present many challenges and opportunities to visualize and assess brain activity maps that can be viewed as a form of “neural choreography” [2]. Data sharing, which remains limited due to the different institutional and privacy constraints, should be encouraged within the
2
scientific community to increase the value of research. The Governing Council of the Organization for Human Brain Mapping (OHBM), the primary international organization dedicated to neuroimaging research, highlighted in 2001 certain challenges in the field of databases in neuroimaging, most of which we still face, such as (a) management of the volume and the variety of forms in which the data is presented, (b) methods for the processing of brain images, (c) accessibility of data, and (d) the lack of access to neuroimaging results to investigators [3, 4].
The proposed Neuroimaging Web Services Interface (NWSI) serves as an automated, responsive and scalable neuroimaging database solution. This new design serves also as a cyber physical system in that it offers users access to neuroimaging algorithms through the internet and provides the needed computational resources with all the required processing, storage capabilities, security and operational maintenance. It is comprised of a Web-Interface, and a set of replica Linux servers that perform specific tasks. Interacting with the system requires minimal computing knowledge, equivalent to what is expected from social media or similar type web interface [5].
NWSI is equipped with various useful tools, such as Brain Extraction Tool (BET), brain image registration, and image format conversion. The current implementation includes: (1) automatic quantification of volumes from anatomical MRIs, (2) 18F-Florbetapir and 18F-Florbetaben for Alzheimer’s disease (AD), (3) FDG PET analysis for Epilepsy, and (4) DTI image processing for both AD and epilepsy. All the data results are collected in files and into a MySQL database, and can be exported into tabulated files and image files.
3
The accumulated data can be used in future pipelines as input to multimodal and longitudinal studies.
NWSI utilizes an embedded modified version of the Papaya viewer (a JavaScript medical research image viewer), developed by University of Texas Health Science Center. The viewer allows interactive display of cerebral regions, diffusion images, and PET data. All images are co-registered to the anatomical MRI as part of the pipeline; they can be displayed on the same viewer in stacked layers. Moreover, results have been validated by comparison to existing processed data, such as from the ADNI database, which provides an excellent source of raw and post-processed data for validating the various functions of NWSI.
NWSI has created options to display the PETs in grayscale or spectrum color schemes. It also provides a white and gray matter contour that clearly separates the gray matter from the white matter. This contour provides a more accurate way to rate the PETs as explained on chapter 4.
Neuroimaging Web Services Interface (NWSI) provides an interface to process medical images of the brain. It applies the same processing pipelines to all images of the same modality and provides the capability of performing concurrent quality control via the interface by multiple experts. The full output of FreeSurfer, including images, is provided as a download. NWSI also provides access to intermediate steps. For example, while calculating the SUVR values the regional averages are calculated before they are normalized by a region of reference. This intermediate output is also provided to the user. The transparency and options given by NWSI is not matched, to the best of our
4
knowledge, by any existing system. NWSI provides a system of alerts and messages that notify the user when their asynchronous processing has been completed. A help system for general usage is also provided. These complement the design of the forms that are built embedded with explanations and help on how to use NWSI. The NWSI Forum provides a space for other researchers to connect and share knowledge.
NWSI results were validated by comparing its output with data obtained from ADNI and the Centiloid Project: Global Alzheimer’s Association Interactive Network (GAAIN). Both validations indicated that the difference in the data processed by NWSI and the data from GAAIN or ADNI is not statistically significant. NWSI is being actively used by researchers from multiple universities and hospitals in the US. NWSI provides the SUVR values in the centiloid scale, which allows the merging of results from different tracers (Florbetapir and Florbetaben) for PET imaging.
Image restoration is also an important issue with neuroimaging. The images are obtained from machines that create a representation of the inside of the human body. Removing noise and other artifacts is an important pre-processing step. We propose a new method to remove shading, caused by an aliasing artifact. The method corrects the images and allows the processing steps to extract accurate parameters, such as the intracranial volume (ICV) for estimating head size.
The SVM classification interface in NWSI provides the user with a simple but powerful way to conduct a variety of classification experiments on the data. Many options are selectable by the user: SMV kernel, data normalization methods, use of neurophysiological data, among others. The interface provides user-friendly interaction,
5
where the user does not have to be familiar with the supporting algorithms. Our Web Platform is designed for easy access to medical doctors and clinicians, who are interested in brain research, but do not necessarily, have a computer science background.
Given that the causes of AD are unknown, and a cure is not yet available, early detection is essential. When patients are cautioned that they have a possibility to develop AD, they can prepare better for the future and plan for treatment and plan early therapeutic/curative interventions. One way of detecting the possibility of AD development is to compare the patient to a population of AD, MCI, and cognitively normal (CN) individuals. Classifications algorithms, such as SVM (Support Vector machine) are suitable for such a task. Once the SVM is trained with existing data, a new data point can be placed in the context of existing subjects, and a classification into one of the prodromal stages of AD can be obtained.
1.2 General Statement of the Research Area
This research seeks to provide a methodology for medical image processing through algorithms that provide results validated to current standards. The intent is to implement a web-based interface that allows 24-hour access to neuroimaging data. Users of the interface will be able to share their datasets, promoting collaboration among researchers.
1.3 Research Purpose
The research aims to create a web-based multimodal neuroimaging platform. The data processed on the interface is curated and ready for discovery. NWSI provides a bridge between the image, as obtained from the scanner, and the numeric values that can be used
6
in classification algorithms and statistical analysis software. This is a fundamental step in the discovery process, providing researchers with results that are validated and can be trusted. NWSI creates standardized databases and allows the merging of data from different sources eliminating some of the biases that plague processing in the medical imaging realm.
1.4 Significance of the Research
Medical image processing is a field that emerged as computer hardware and software evolved. By doing a multimodal analysis of medical images researchers can learn about conditions of the brain in its normal and diseased states. NWSI addresses key issues of image registration, image processing, segmentation, image restoration, and data fusion (such as for Florbetapir and Florbetaben in PET and Centiloid scaling) and ensures correctness of the implemented algorithms through quality control and validation processes. NWSI also proposes a method to improve PET scans binary reading by using white matter contours. There is no other system, to our knowledge, capable of taking uploaded medical images and processing them into tabulated data that also provides easy sharing of information. The image restoration method proposed corrects the images and allows for accurate processing and parameter extraction.
1.5 Structure of the Research
In Chapter two, relevant research endeavors related to the research work of this dissertation are described. Chapter 3 introduces the design and architecture of the NeuroImaging Web Services Interface (NWSI). A detailed description of the system is
7
provided, including: (1) the hardware architecture, (2) design aspects of the interface, (3) and a cost analysis. The data from our research collaborators, including the technical details regarding its acquisition, and the number of subject for each type of scan is also provided. This Chapter also describes the design of the SMV classification form.
Chapter 4 is dedicated to research issues involving image processing, and the software pipelines embedded in the NWSI; these are addressed in Sections 4.1 through 4.7. Sections 4.8 and 4.9 discuss the advantages of automatic normalization of PET scans and the importance of white matter contour overlays in binary ratings. Section 4.10 describes a general method to create heat maps of grain regions. Chapter 4.11 describes and algorithm for medical image restoration. Section 4.12 describes a classification algorithm implemented on the web-interface Results are then presented, including many of the experiments that researchers can conduct with the interface. In Chapter 5 results derived from the system are presented, and several parts of the systems are validated by processing external data and comparing the results.
Finally, Chapter 6 concludes with a retrospective of this work together with the key findings of this research. It also outlines all the essential improvements that were made possible for the effective use of the interface and suggests future developments that could augment the proposed web interface.
8
2. Related Work and Retrospective on Neuroimaging in AD
2.1 Existing Neuroimaging Databases
Among the most established and widely recognized efforts to create shared neuroimaging databases is the Alzheimer's Disease Neuroimaging Initiative (ADNI) database [6], which currently contains data (some of which are longitudinal) from over 1900 subjects, encompassing over 4000 MRI and PET scans, as well as clinical, cerebrospinal fluid (CSF), genetic and biochemical biomarkers, which have been made available to researchers worldwide, who have made over 14 million downloads. Many other databases with more specialized audiences exist and have been cataloged in Neuroscience Information Framework [7]. These include: the Minimal Interval Resonance Imaging in Alzheimer's Disease database (MIRIAD) [8], the OpenfMRI database [9], NeuroVault [10], the Virtual Brain (TVB) [11], Neuroimaging Data Model (NI-MD) [12], and the Vanderbilt University Institute for Imaging Science Center for Computational Imaging (VUIIS-CCI), XNAT (Extensible Neuroimaging Archive Toolkit)-based repository [13].
The Open Access Series of Imaging Studies (OASIS), made available by the made available by the Washington University Alzheimer’s Disease Research Center, Harvard University, the Neuroinformatics Research Group (NRG) at Washington University School of Medicine, and the Biomedical Informatics Research Network (BIRN), stores brain MRI data. OASIS currently contains 1098 subjects, 2118 MRI and 1500 PET images. The dataset is a retrospective compilation of collected from several ongoing
9
projects through the ADRC over the course of 30 years. OASIS does not allow users to upload their own images for processing.
The Collaborative Informatics and Neuroimaging Suite (COINS) [14], is a suite developed to allow data storage and sharing. The interface allows uploading the neuroimaging data, but does not provide visualization or data processing capabilities.
2.2 Retrospective on Multimodal Imaging for AD Classification and Prediction
and Measures of Caution to be Considered
According to the Alzheimer Association (www.alz.org): Alzheimer’s disease is the sixth-leading cause of death in the United States, and the only cause of death in the top 10 in the United States that cannot be prevented, cured, or slowed down, killing more than breast and prostate cancer combined. While death from other diseases has decreased significantly, from 2000 to 2013, death from Alzheimer’s disease has increased by 71%. In 2015 alone, the United States will spend 226 Billion dollars to care for people with Alzheimer’s. It is estimated that by 2050 the national cost could reach a trillion dollars, unless something is done to improve early diagnosis of the disease and propose new therapeutic interventions that could slow down the progression of AD. Today 5.3 million Americans live with Alzheimer’s disease. Someone in the United States will develop the disease within the next 33 seconds. It is one of the factors contributing to bankrupt Medicare. AD is not simply memory loss, AD kills. In 2013, 84,000 Americans died of AD. In 2014, 15.7 million family and friends provided 17.9 billion hours of unpaid care to AD patients, valued at $218 billion. Nearly half the population over 85 years old will
10
have developed AD [15]. While a cure for Alzheimer’s disease will be an ideal solution, early diagnosis remains a primary requirement in prospective treatment.
Mild Cognitive Impairment (MCI) is a condition which affects the individual’s abilities to perform certain thinking tasks, while the individual is still able to perform everyday activities. There are two subtypes of MCI: amnestic MCI (aMCI) and non-amnestic MCI (na-MCI). It is believed that a-MCI is actually an early stage of AD; memory loss related to the MCI subgroup, are likely to progress into AD. No single test exists to diagnose MCI in the most effective way.
Originally, AD was diagnosed without utilizing imaging or biomarkers. In 2007 the International Working Group (IWG) for New Research Criteria for the Diagnosis of Alzheimer’s disease changed the basis for diagnosing AD. The new criteria also allowed diagnosing earlier stages of AD [16]. Brain Medical Imaging is a group of techniques to create visual representation of the interior of the living brain. These techniques are minimally invasive or non-invasive and allow researchers to observe the state and evolution of a diseased or healthy brain.
Brain medical images from multiple modalities as described below are obtained daily in hospitals around the world. However, not all images collected are suitable for processing. Historically doctors have looked at these images and derived visual knowledge from them, such as rating PET images by doing a binary reading. To save scanning time, some of the images are taken at low resolution (for T1 MRI images, this typically means that there are less than 64 slides per scan). The resolution of these images is so poor that they do not reveal any pertinent information when processed in a computer. Other images only
11
show parts of the brain and cannot be fed to the algorithms that expect a full brain in order to estimate volumes and surface areas. Amyloid PET scans are rated based on the spreading of the tracer to the cortical regions. This will show in the images as a brightening of the voxels in those areas. The gold standard is to look at these images in grayscale.
Magnetic Resonance Imaging (MRI) uses a large magnet to polarize the nuclei of hydrogen in water molecules inside the body and creates images that are representative of the anatomical features inside the brain, such as volumes and surface areas. MRI was invented in the 1970s and has proven to be very reliable in showing the anatomy of the brain. MRI allows the creation of many sequences, including but not limited to T1 and T2 weighted images (obtained by changing the relaxation time after the magnetic polarization), Fluid Attenuated Inversion Recovery (FLAIR) images (used in analyzing lesions in white matter, similar to T2 images but with much longer relaxation times), Diffusion weighted images (DWI) (used in analyzing the diffusion of water molecules in the brain, and the tracks of the neurons), and Functional MRI (fMRI), which measures brain functional activity based on the blood-oxygen-level dependent (BOLD) effect. MRI has improved since its invention, coming from 0.5 Tesla to the current 3 Tesla standard. Newer 7 Tesla scanners, with their larger signal to noise and contrast to noise ratios, create higher resolution images of the brain and will potentially allow to capture more detailed images, and introduce newer processing techniques. A special kind of DWI is the Diffusion Tensor Imaging (DTI), which maps the white matter tracks and connectivity of the brain.
12
Computed Tomography Scan (CT) combines X-ray measurements from different angles producing cross-sectional images of the brain. CT is typically used to detect infarcts, tumors, and calcifications, but provides less anatomical information than the MRI disciplines. Besides the X-ray based CT, other forms of CT exist, such the Positron Emission Tomography (PET), and Single-Photon Emission Computed Tomography (SPECT). PETs are of particular interest in AD research because of their capacity to measure metabolic processes. When creating a PET image, the subject is injected with a tracer that emits pairs of gamma rays indirectly emitted by the tracer. PET images are obtained with the aid of a previously obtained CT image. PETs measure blood flow in areas of high metabolic activity, capturing brighter pixels where there is more activity. They are useful in differentiating AD from other types of dementias, and localizing the focus of epilepsy seizures, among other applications in oncology and other medical disciplines.
Typical image processing pipelines involve initially processing a T1 MRI image, to obtain the anatomical data. This anatomical data contains the measurements extracted from brain structures, such as volumes of cortical and subcortical regions, surface areas of brain regions, and white matter regions. MRIs are segmented into groups of connected voxels, each representing a region. The output of processing a T1 MRI includes text files, containing the numeric measurements, and images that are registered to the T1 and represent a mapping of the brain, or specific regions of interest (ROIs). For example, in FreeSurfer the aparc+aseg.mgz file substitutes the intensity for each voxel by a number that represents the region a given pixel belongs to. This way, it is possible to use it as a
13
map of the segmented brain regions. Counting the pixels and multiplying for the voxel size provides an approximate of the region’s volume. FreeSurfer defines the term “segmentation” to the partition of the subcortical cerebral regions, while calling “parcellation” to the cortical regions partition.
Given an MRI segmentation and parcellation, it is possible to register to it an image created in a different modality. PET and DTI images are diffuse and of lower resolution than MRI, they don’t have enough information to be segmented by anatomical regions, but with the help of the MRI analysis it becomes possible to map a voxel from a PET image to a voxel in an anatomical region. This process also allows registering dissimilar modalities by bringing them all into the space of the T1 MRI, thus been able to display the PET and the DTI as a single registered image, allowing for the integrated analysis of assorted modalities.
Image registration, or co-registration, describes the process of aligning in space two sets of images from a same imaging modality or a set of images form two different imaging modalities. Accurate and correct image registration is essential in brain medical image analysis. Cortical brain regions make up the cerebral cortex, made entirely of gray matter; gray matter is made up of neuronal bodies. These regions form a ribbon enveloping the white matter (which contains mainly axons and extra cellular space). This ribbon is very thin, and any deviation while registering the image will produce incorrect results.
There are many software packages available with options for image registration and MRI segmentation. Among them: FreeSurfer, FSL, Mango, BrainSuite, Statistical Parametric Mapping (SPM), and 3D Slicer. The quality of the output depends largely on the quality
14
of the input image (including resolution, noise present in the image, contrast, and artifacts). These software packages use a combination of knowledge about the structure of the brain, combined with some sort of optimization algorithm. After the analysis is complete, a visual inspection and quality control process must ensure that the software did not make a mistake. A common error with FreeSurfer is to assume a missing region as atrophied. This causes to map regions that are not really there to white matter or other parts of the brain, producing volumetric values for areas which should have a zero-volume value.
When PETs are registered to MRI it is necessary to make sure that anatomical features visible on the PET mapped correctly to their MRI counterparts. Unfortunately, many of these software packages are based on the Linux operating system and do not provide an easy way to visualize the output. FreeSurfer provides a viewer, but in order to open it the user must use the UNIX (a family of operating systems) command line interface to load the images. This is cumbersome for many researchers and medical personnel, who have the imaging knowhow but lack the computer skills. Besides the complexity inherent to the usage of the software, these software packages require extensive computing power. FreeSurfer takes many hours to finish processing a T1 MRI on a typical server cloud environment, taking much longer in a personal computer.
Current literature also describes the difficulties of mixing imaging data from heterogonous sources. There are obvious limitations in mixing data obtained from a 1.5 Tesla scan with a 3 Tesla scan. The 3 Tesla coils produce higher quality images. A more detailed image will allow the software to better detect the edges of the regions and hence
15
producing more accurate structural values. But even if the intracranial volume (ICV) does not change from the 1 Tesla scan to the 3 Tesla scan, the size of regions can vary, which could misleadingly indicate a reduction or increase in size of certain regions.
Systematic artifacts and motion artifacts can bias a dataset. Younger participants in a study might have a tendency to move more than older participant, introducing artifacts that can be interpreted by the software as region size variations. Even the operator of the MRI or the scanning environment can introduce biases to the scan acquisition. Another bias may come from the processing software itself. FreeSurfer has many built-in libraries, and code created specifically by the FreeSurfer developers, but it also depends on libraries located on the host computer. That means that if there is a difference in these libraries it will be reflected on the volumetric values reported by FreeSurfer. This is known by the FreeSurfer developers, and they warn their users to not use FreeSurfer-derived data obtained from different software processing platforms in the same study. Biases sometimes will not affect the results. AD researchers look for variations in specific brain regions, such as the hippocampus, and don’t look at all at other regions. But if processing bias affects one of the brain regions under scrutiny, erroneous conclusions can be drawn. Some biases may affect entire datasets.
When researchers or doctors need their images processed, they typically don’t do it themselves. The images are sent to private companies or research centers. The processing facility returns the output as tabulated data rarely disclosing the processing method or providing the processed images. The researchers and doctors cannot corroborate the correctness of the output, as quality control is performed by looking at the output images,
16
to make sure that the algorithms performed correctly. Two sets of images might also be processed differently, introducing biases into the dataset.
When looking at the advancement of a disease and the atrophy it produces on brain regions, the changes are sometimes imperceptible. Cerebral atrophy can be severe in AD patients, but patients with subtle changes such as in MCI are more difficult to differentiate from controls. Data biased by processing can introduce changes that might be interpreted as signs of degeneration (or even regeneration) but are in reality due to the selected processing pipeline. Having a system that applies the same algorithm to all the data is key to uniformity and in solving these sorts of problems, which the NWSI is set out to achieve.
17
3. Architecture of the Neuro-Imaging Web Services Interface (NWSI)
3.1 NWSI Interface
The web-interface driving NWSI is based on Drupal, a popular open source content management system (CMS), which is the platform for BBC, University of Oxford, the U.S. Department of Energy, and other well-established organizations. Drupal provides a user-based platform, in which the core code for the security and design tools are updated and patched frequently to address vulnerabilities, as well as to add new functionalities. New features can also be added to Drupal via modules which can be integrated with Drupal core code, allowing new code to run on Drupal, while maintaining the core software secure and intact.
The web-interface of NWSI has a simplified design, utilizing forms and uploaded files for most of the data input. Users of the interface who are not familiar with Linux or its command line arguments will be able to upload, view, or delete existing data. Figure 1 shows the MRI upload form. All data is de-identified prior to being uploaded to the server and the user determines whether or not the data on NWSI will be shared with other users. Access to the site is provided by password protected accounts. Each account represents a study, and data uploaded under that account can only be viewed by the owner of such accounts, which can be shared among members of the study.
While the user interaction occurs through the web-interface, a set of replica servers (RSs), which run on Linux, perform a variety of asynchronous tasks, such as running FreeSurfer [17] on anatomical MRIs, or registering structural MRI to PET or DTI images. To keep
18
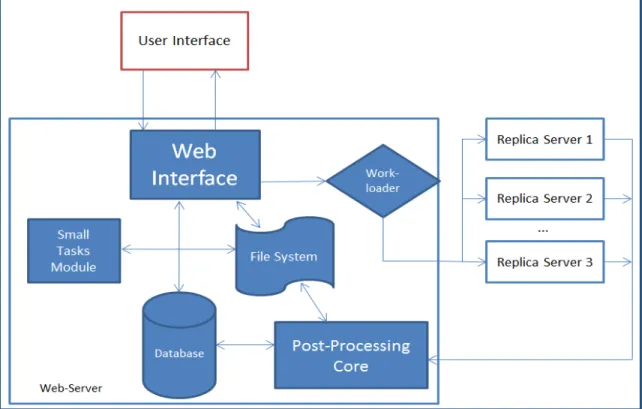
the interface responsive, new tasks are sent to a work-loader on the web interface, which is based on current workload of each RS, sends tasks to one or more available RS(s). Once the data is copied back to the Web-Server, the Post-Processing Core incorporates it into the system’s Database and File System. The architecture is scalable, such that new RSs, which are easy to maintain clones with identical software and capable of performing all available tasks, can be added on demand to the system.
The asynchronous communication between the web-interface and the RSs is achieved by securely copying files. Some of these files are data to be processed, while others are status reports and workload balance data. MRI, PET, DTI, and fMRI images are processed on the replica servers; but smaller tasks, such as Brain Extraction or registration, are done synchronously on the Web-Server by the Short Task Module. Tasks that are selected to run on the Small Task Modules must be brief, no longer than a few minutes in duration, so as to keep the Web-Server responsive.
The interface provides a uniform approach to all forms and data tables. For example, becoming familiar with uploading MRIs and viewing uploaded data provides insight into uploading other modalities as well. Figure 3-1 shows the MRI upload form, which contains fields for Record ID, Date, and the MRI file. Figures 3-2 and 3-3 display the PET and DTI upload pages, respectively. The PET and DTI uploads require an existing MRI to be processed. The PET upload form provides an option to upload a previously registered PET.
19
20
21
Figure 3-3: DTI upload form.
The Clinical form takes a CSV file with any number of rows and columns. NWSI only requires that the fields "MRI_SITE_ID" and "SUBJECTID" be present. Upon upload, the fields can be linked to the correct MRI record using the MRI_SITE_ID column. NWSI uses a number of fields to display subject information throughout the site. The user can map these fields to the ones present in the uploaded CSV. Figure 3-4 shows the clinical data upload form, and Figure 3-5 shows an example of the field mapping. The design of the clinical form allows uploading arbitrary clinical data to the interface.
22
Figure 3-4: Clinical data upload form.
23
3.2 NWSI Hardware Architecture
Virtual technology, VMware ESXI 5.5 with SAN (Storage area networks) and HPE MSA P2000 G3 Modular Smart Array Systems are used to host the NWSI Web-interface’s and the replica servers. The cluster-aware infrastructure has two ProLiant DL 380 G7, with 2 CPUs x 3.332GHz, and 147 GB of RAM (Each), forming a centralized pool of resources that is used to create virtual machines (VMs) which run their own operating system. Figure 3-6 illustrates the virtual architecture.
Figure 3-6: Virtual Architecture.
The Web interface runs on a Virtual Machine (VM) running Ubuntu 14.04.5 LTS (Trusty Tahr), Apache (2.4.16), PHP (5.5.28), and MySQL (5.6.26.) and is managed by Drupal 7 (latest version). The replica servers are two VMs running on Centos (6.6 el6.x86_64.) with FreeSurfer (v5.3.0 16), each configured with 8 cores CPU and 16GB of RAM. The processing time for a single MRI is from 8 to 12 hours; however, as many as 16 MRIs can be processed simultaneously, using 2 replica servers with 8 cores each. PETs and
24
DTIs are processed in fifteen and ten minutes, respectively. The use of a virtual server environment adds availability, security and scalability to the Neuroimaging Web-Interface application.
Figure 3-7: Architecture of the NeuroImaging Web Interface System.
Furthermore, new VMs can be added to the current design to increase the capability and performance of the system. Replica servers can reside in a private cloud or the Internet, as long as files can be securely copied between them and the interface. The web-interface can be accessed anywhere in the world with a fast Internet connection and a browser. It is both device and operating system (OS) independent. The Drupal Theme is responsive and tablet/phone friendly. Figure 3-7 above shows the architecture of the neuroimaging web-interface system, wherein the user interacts with the Web Server through the Web browser. Results from completed tasks are readily viewable. New tasks
25
are sent by the Work-loader, to an available Replica Server, which sends the completed task to the Post-Processing Core, from which new values are entered into the Database and raw and new images are stored on the File System. Registration, Brain Extraction, and other smaller tasks are processed on the Web-Server by the Small Tasks Module.
3.3 Image Viewer
Papaya, developed by the University of Texas Health Science Center at San Antonio, is a powerful open source, interactive, JavaScript based image viewer incorporated within NWSI. The web-interface accepts the three most common medical image formats as input: single and multi-frame DICOM, ANALYZE, and NIfTI [18], but converts all files to NIfTI, which is versatile, more compact and widely used. It should be noted that some supporting software, such as FSL [19], only accepts NIfTI as input.
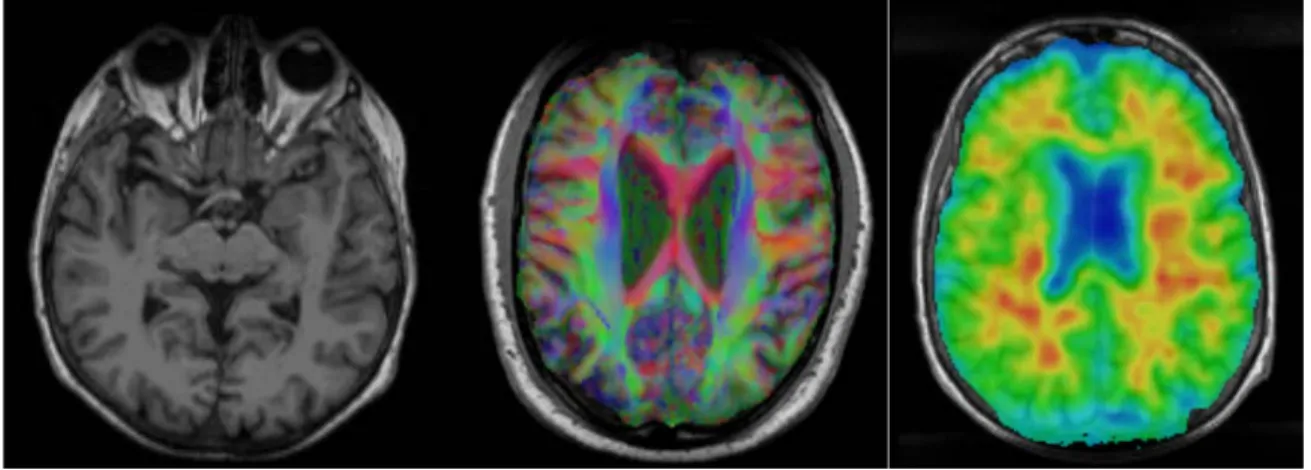
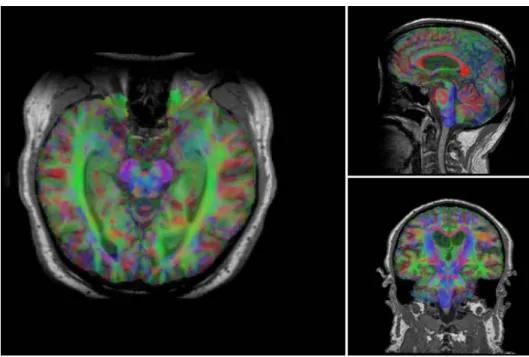
The version of Papaya in NWSI has been modified to display FreeSurfer labels and custom color tables. The Web Interface is also capable of displaying specific color-coded FreeSurfer regions, whole brain segmentation, interactive surfaces, PET, fMRI and DTI images. As part of our processing pipeline, all image files are registered to the structural MRI scan, making it possible to display several modalities as layers in the same viewer. Among the tools embedded on the web interface and available to the user by Papaya are color selection, a measuring tool, axis viewer, and image transparency modification, all of which are standard in many other viewers. The user can display these images online without having to save any files to the local hard disk. See Figures 3-8 and 3-9 below for illustrative examples.
26
Figure 3-8: Interactive viewer, showing surface reconstruction and anatomical MRI.
Figure 3-9: Image shows MRI, DTI and PET cross sections, as shown by the Papaya viewer.
27
Furthermore, the ROI explorer page displays a color-coded segmentation of FreeSurfer regions. This is especially useful for researchers who are not familiar with FreeSurfer labels but are familiar with human brain anatomy. Pertinent information can be visualized by clicking on specific regions to scrutinize what different regions reveal. See Figures 3-10 and 3-11.
Figure 3-10: ROI Explorer: visualizing FreeSurfer Segmentation. By default, all regions are shown.
28
Figure 3-11: ROI Explorer: showing the left and Right Hippocampus and Amygdala.
3.4. Visual Rating Platform
The gold standard for Amyloid PET rating is visual ratings. Expert raters inspect the PET images and catalog them into positive, negative, or intermediate. When performing an experiment, the raters will (1) look at the PET images, (2) rate each individual image, (3) and record these values into a table. These recorded values will then have to be sent to someone who will analyze them. This process creates many issues regarding the logistic of people located in different parts of the city, or different parts of the world, looking at these images with their own viewer (not necessarily the same viewer for all raters), saving these values into a Word or Excel document, and sending the values to the processing expert. There is also the image display normalization issue, as explained in
29
section 4.8), where users will have to adjust the image to account for flares outside the brain within the limitations of their image viewer of choice.
NWSI provides a system to rate PETs. Images are presented to all users using the same normalization, in the same viewer, and the results are collected and stored in the same format. Furthermore, an interface was built for the processing expert to either export the data or process the data within the NWSI platform.
NWSI provides a form to create PET rating projects. These projects can be enabled or disabled, which mean whether or not they will be shown to the raters. They also contain a page size field (indicating how many PETs will be presented to the rater at each iteration), and a list of PET ids to be rated. The creator of the projects has control over how large the dataset presented to the user is. See figure 3-12.
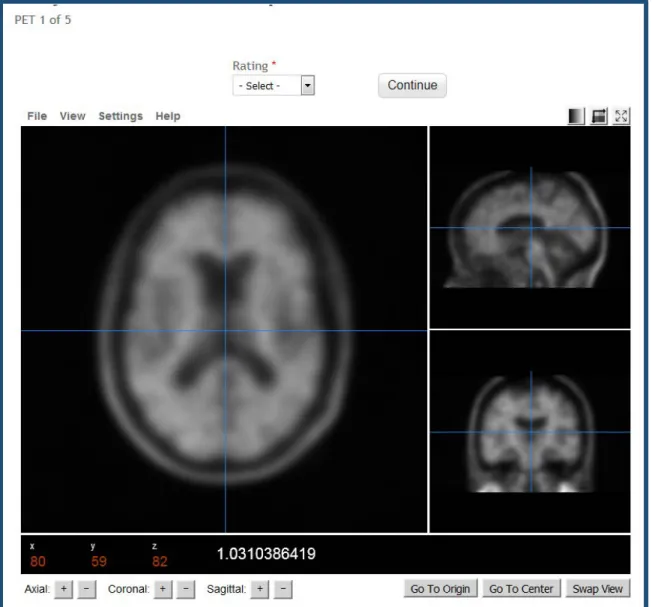
Once a project has been created and enabled, it will show in the rater’s interface. Raters can select the project and rate the images. Figures 3-13 and 3-14 show the rating interface.
30
Figure 3-12: PET rating configuration form.
31
Figure 3-14: PET rating interface and individual PET to rate.
Finally, the processing expert can export the values and analyze them using a statistical software, or simply use the statistics provide by the interface. NWSI calculates the Fleiss Kappa, which is a common measure to compare ratings by multiple raters: interrater reliability. It is also possible to measure intra-rater reliability by creating projects that will be rated more than once by the same rater at different times.
32
3.5. SVM Classification Interface
The classifier, based on the libSVM (3.20) library [20], is accessible to the user as a form in the website’s interface. The interface is simple yet provides many options to the user. The SVM algorithm builds a model from a set of training samples by mapping an n-dimensional array of vectors to an n-n-dimensional space and finding a hyperplane that separates the classes. It is a type of supervised learning, in which the training data is labeled. By default, SVM performs a linear classification, but it is possible to perform non-linear classifications by employing what is known as the “kernel trick”. The SVM classification provided in the form allows selecting a linear kernel, or a Radial basis function kernel (RBF). RBF kernels at times perform better than linear kernels, but they typically don’t scale well to large training samples or a large number of features. Features refer to how many dimensions the n-dimensional input space has for classification purposes, which could include structural, functional and neuropsychological measures, among others.
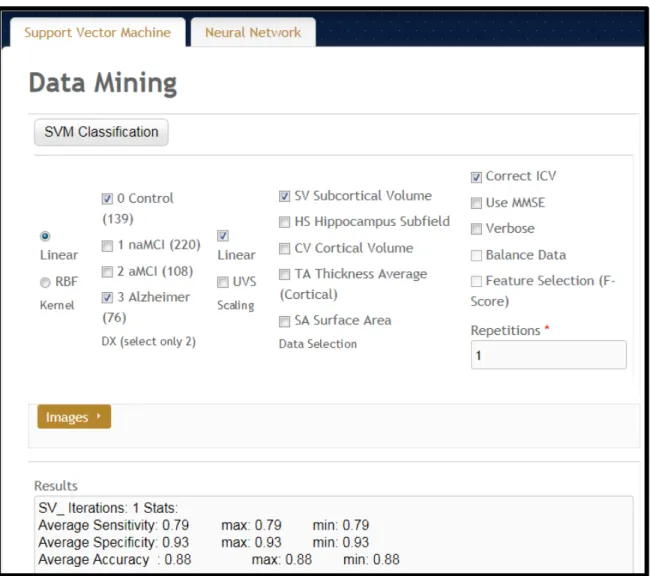
The form, shown in Figure 3-15, provides an option to select the classes: Control (these are subjects labeled as cognitively normal), non-amnestic MCI (naMCI: subjects with mild cognitive impairment but no memory related symptoms), amnestic MCI (aMCI: subjects with memory loss related symptoms), and AD (subjects with a diagnosis of Alzheimer’s disease). Only two of the classes can be selected. Implementing an SVM algorithm with more than one class is possible but given the subtle differences in brain regional volumes that naMCI and aMCI subjects have compared to the cognitively normal group, having two classes at a time performs better than in multiclass separation
33
algorithms, although the advent of new machine learning algorithms could prove otherwise.
Figure 3-15: Classifier form.
The Scaling must be selected next. Scaling makes each dimension have zero mean and unit variance. It prevents attributes with a larger range to dominate the classification as kernel values depend on the inner product of the vectors. Our method provides two types of scaling: Linear, in which the values are in the interval [0, 1], and unit variance scaling,
34
in which each value is replaced by the difference from the mean, divided by the standard deviation. We found that both scaling methods work well and provide similar results.
Finally, the user must select the data features to use: the cortical volumes, hippocampal subfields, cortical volumes, thickness average, and surface areas. Each of the sets of regions is related to AD to some extent, and they are also related to each other. For example, a large regional volume will have a large surface area. We found that the hippocampal subfields (a FreeSurfer’s segmentation of the hippocampus), and subcortical volumes provide a better separation of the data, as presented in the results below. Given the regions that AD typically affects, although this result was expected, it was worth validating.
Other options in the form provide additional configurations. For example, the values can be (1) corrected for intracranial volume (ICV): regional brain volumes measurements are corrected for variations in head size. (2) Use MMSE [21]: include the MMSE score in the classification, although not encouraged since MMSE is initially used at baseline, to see if the results have merits with and without inclusion of MMSE. (3) Balance data: when selecting the input select the same number vectors for both classes. (4) Feature selection: select features that are more relevant to the classification, based on their P-score. Feature selection is reported to improve the performance of classification algorithms, but we found that while other classification algorithms might be susceptible to the type of features selected, feature selection was of little effect in our SVM implementation.
35
3.4. Data
3.4.1. The 1Florida ADRC
NWSI was piloted using a database of MRI, and amyloid PET images obtained from the Alzheimer’s disease Research Center (the 1Florida ADRC). For this pilot project, currently 303 structural MRI, 45 18F-Florbetapir PET scans, and 168 18F-Florbetaben are available from the 1Florida ADRC.
MRI images were obtained using a Siemens Medical System Skyra 3 Tesla Scanner with Software version: “Syngo MR E11”. Coil: “Siemens Head/Neck 20”. The Scanning Sequences used was: 3D T1-W Magnetization-Prepared Rapid Gradient-Echo (MPRAGE.) Sagittal, three dimensional images with resolution of 1 mm (~12 min., TR = 2150 ms, TE = 4.38 ms, TI = 1100 ms, 160 slices, 1x1x1 mm3) obtained from approximately 1 cm left of the skull to 1 cm right of the skull, allowing room for spatial reorientation along defined anatomic coordinates.
DTI scans were obtained from the same MRI scanner. The sequence takes approximately 5 minutes (TR = 7300ms, TE = 84 ms matrix: 128x128, slice thickness =2.2 mm, number of slices = 64, iPAT factor = 2). DTI scans were used to measure radial, axial, and mean diffusivity as well as fractional anisotropy (FA).
PET images were obtained from a Siemens Biograph 16 Hi-Rez, 2006, with software version: “SYNGO CT 2009E”. Image matrix 128x128, Zoom 2, Slice thickness 3.0 mm, Post reconstruction Filter: 3.0mm Gaussian. F18-Florbetapir scanning entails intravenous injection of 10mCi of tracer, a 50-minute period for tracer uptake, followed by 20-minute
36
scan period for image acquisition. For F18-Florbetaben imaging the dose injected was 8mCi, the uptake period between injection and image acquisition was 90 minutes and the image acquisition period was 20 minutes.
3.4.2. ADNI
Data used in the preparation of this article were obtained from the Alzheimer’s disease Neuroimaging Initiative (ADNI) database (adni.loni.usc.edu). The ADNI was launched in 2003 as a public-private partnership, led by Principal Investigator Michael W. Weiner, MD. The primary goal of ADNI has been to test whether serial magnetic resonance imaging (MRI), positron emission tomography (18F-Florbetapir PET), other biological markers, and clinical and neuropsychological assessment can be combined to measure the progression of mild cognitive impairment (MCI) and early Alzheimer’s disease (AD).
MRI scans were acquired from 1.5T or 3T scanners at multiple sites across the United States and Canada using MP-RAGE/IR-SPGR protocols for volumetric analyses. F18-Florbetapir PET acquisition time was 50 minutes following administration of 370 MBq (10 mCi) bolus injection of F18-Florbetapir, over a 20-minute scanning period, the images were reconstructed immediately afterwards. Details of MRI and F18-Florbetapir PET imaging data acquisition are available in the ADNI website.
3.4.3. GAAIN (Centiloid Project)
Data from GAAIN was made available by the researchers of the department of Molecular Imaging & Therapy in Melbourne Australia. This data was used in the Centiloid [22] project (CL). The centiloid method expresses SUVR values in a universal scale. In their
37
paper [23] the researchers use this data to derive the equation to convert uptake values from 18F- Florbetaben to CL values. They used 35 subjects that were scanned (MRI and 18F- Florbetaben PET): ten cognitively normal under 45 years old, and 25 AD, MCI, and frontotemporal dementia subjects. MRIs were obtained from a Siemens 3-T Trio camera with 1 × 1 × 1.2 mm voxels, and the PET scans from a Philips Allegro PET camera in 3D mode and processed with rotating Cs-137point source attenuation correction. This data was uploaded to NWSI to validate 18F- Florbetaben SUVR calculations.
Once the SUVRs were determined, the following formulas were implemented. For Florbetaben, the centiloid formula implemented and cross-validated with [24] is:
CLunits = 153.4 × SUVRFlorbetaben − 154.9 (3.1)
On the other hand, for Florbetapir, the centiloid formula is:
CLunits = 183.07 × SUVRFlorbetapir – 177.26 (3.2)
Equation 3.2 could not be validated since they do not show the results they have obtained. All the conversion does is move a numeric value into another one, with no observable visual change, but these two formulas consolidate the scale for the images taken with these two different imaging tracers.
3.4.4. Baptist Health South Florida
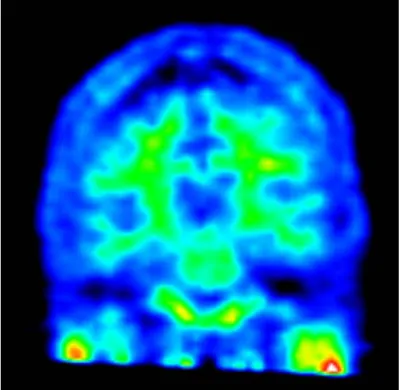
Subjects from Baptist Hospital were scanned with a Philips Medical Systems, NM Division, protocol Brain Perfusion Scintigraphy. Scanning protocol: Trans AC. Slide thickness 3.195mm, Image Matrix 128x128. Contrast: FDG – fluorodeoxyglucose.
38
3.4.5. Nicklaus Children's Hospital
Subjects from Nicklaus Children's Hospital were scanned with a GE Medical Systems, model: Discovery ST. Scanning protocol: PET AC 3D Brain. Slide thickness 3.27mm, Image Matrix 128x128. Contrast: FDG – fluorodeoxyglucose.
3.4.6. SVM Classifier Data
The classifier was linked to ADNI Data. ADNI provides a dataset for AD research. The input features were selected from the ADNIMERGE document, available for download on the LONI site. We also tested the algorithm with data from the Wien Center for Alzheimer's Disease and Memory Disorders at Mount Sinai Medical Center, Miami Beach. Our datasets are as described in Table 3-1. Volumetric measurements in ADNI data were obtained using FreeSurfer 5.1, processing the MP-RAGE protocol sequence, with 1.5 Tesla scanners. The
Wein Center data was obtained from T1 weighted MP-RAGE scans, from a Skyra 3 Tesla scanner. The results were processed in FreeSurfer 5.3 at the Center for Advanced Technology and Education (CATE), Florida International University. All subjects went through similar visual quality control processes.
Table 3-1: Datasets Considered.
Class ADNI Wien Center
Normal 139 subjects 127 subjects
Na-MCI 220 subjects 55 subjects
a-MCI 108 subjects 68 subjects
39
3.5. Cost Analysis
NWSI scalability allows for a large number of additional replica servers. The basic requirement is two servers: one hosting the web interface, and the other for processing images. This setup was the initial prototype and it worked well for small batches of less than 20 or 30 sets all uploaded at the same time. The cost of maintaining two dedicated servers is low: services such as Godaddy.com provide each server from $69.99 per month for a dedicated Linux server. The current prototype is installed on a distributed system located at Florida International University. This type of setup is more secure and easier to manage, having a larger price tag. FIU paid $62,000.00 including hardware and software licenses. If all the resources are utilized the FIU setup can service many requests, with the capability to process hundreds of MRIs and PETs per day. The prototype only uses 3 servers from up to 15 servers which can be created on this distributed system with 8 cores and 32GB each.
40
4. Neuroimaging Capabilities
4.1 Volumetric and Cortical Thickness Calculations from Anatomical MRI
The basic functionality of NWSI depends on using FreeSurfer to reconstruct cortical surface models (gray-white boundary surface and pial surface) from structural MRIs and to output regional cortical and subcortical volumes, cortical thickness, and other values derived from input image segmentation (see FreeSurferWiki (fswiki) for a complete list of such measures). FreeSurfer also outputs image files that define the segmentation and replaces intensity on these files by numeric values representing the segmented regions. These files are used in the calculation of PET Standardized Uptake Values (SUV).
NWSI processes all structural MRIs on a local server, rather than using the option of uploading existing FreeSurfer values, because it was determined on testing the system that FreeSurfer results were affected by the OS version adopted, even when the same FreeSurfer version was used [25]. This outcome serves as a measure of caution, especially for comparative studies and analyses. FreeSurfer specifies in the fswiki that when processing a group of subjects, it is essential to use the same FreeSurfer version on the same OS platform and vendor, because certain OS level libraries might affect the results. As new replica servers are added to the system, it is imperative to test them before deployment to make sure the results are validated against established ones.
An important issue, which can be resolved by NWSI, is the merging of data from different sources, which is a non-trivial task due to factors such as scanner bias, scanner field strength, among others [26]. This problem is best addressed by processing all values
41
with the same hardware and software, once enough data from different sources is present on the server. Results from subjects from one institution (e.g., control subjects) can be merged with subjects from another institution, downloaded and tabulated in a format. Figure 4-1 shows a sample comma separated values output.
Figure 4-1: Sample Tabulated Output for Subcortical Regions.
4.2 PET Imaging Analysis with 18F-Florbetapir PET / 18F- Florbetaben
Regional quantification of regions of interest (ROI) is still defined manually, but automatic Standardized Uptake Value ratio (SUVR) calculations and segmentation of PET images have become the gold standard [4]. NWSI implements several PET analysis pipelines for FDG and 18F-Florbetapir images. Prior to uploading a PET scan, a structural MRI must already exist in the system; the user is presented with a form in which an existing MRI must be selected. After the PET scan is uploaded, it is copied to one of the RSs for processing and can be accessed through a form that lists all uploaded records, as shown in figure 4-2. This form also contains graphs showing the distribution
42
of all PET scans uploaded by the user as in Figure 4-3. Once a PET scan is processed, it can be displayed on the interactive image viewer, as shown in Figure 4-4 and Figure 4-5, and then quantitative data can be downloaded from the PET scan page, as shown in Figure 4-6.
Figure 4-2: Page Listing PETs in the Account, with Links to the MRI used as reference.
43
Figure 4-4: Higher Concentration of 18F-Florbetapir Shown in Warmer Colors of the Spectrum Look Up Table (LUT).
Figure 4-5: PET Image Overlaid with White Matter Surface (shown in white) and Gray Matter Surface (shown in black). The selected region’s SUVR and Name are shown.