Transportation Research Procedia 14 ( 2016 ) 3119 – 3128
2352-1465 © 2016 Published by Elsevier B.V. This is an open access article under the CC BY-NC-ND license (http://creativecommons.org/licenses/by-nc-nd/4.0/).
Peer-review under responsibility of Road and Bridge Research Institute (IBDiM) doi: 10.1016/j.trpro.2016.05.252
ScienceDirect
6th Transport Research Arena April 18-21, 2016
Impact analysis of ecodriving behaviour using suitable
simulation platform (ICT-EMISSIONS project)
Eugenio Morello
a, Silvana Toffolo
a, Giorgio Magra
a,*
aIVECO S.p.A., via Puglia 35, 10156 Torino, Italy
Abstract
Eco-driving is a way to drive that allow to use less fuel. To be eco-driver you need to follow a set of simple rules such as: upshifting to avoid engine speeds over 2500 rpm, keep steady vehicle speed, anticipating traffic, accelerating and decelerating smoothly, and avoiding long idles.
The promotion of an energy-efficient driving style is a measure that can have an important impact on fuel consumption.
The eco-driving behaviour varies the attitude in setting speed and distance to the preceding vehicles. Speed and distance are parameters that influence, at the macroscopic level, the speed and density of traffic. To assess measure’s impact at road network level we need to simulate, first the microscopic level movement of vehicles and then scale up in a suitable way the result to the macroscopic level.
A suitable software platform has been developed using and enhancing the models adopted in the existing commercial tools in order to simulate traffic with drivers having different behaviour such as eco driver. The results shows that different behaviour, which imply different law for interaction between vehicle, can have different impact on emission when not a single vehicle is considered but the traffic on a real road network. Results show that Eco drive has more impact in free and normal traffic condition, but could be not useful when traffic condition is congested.
© 2016The Authors. Published by Elsevier B.V..
Peer-review under responsibility of Road and Bridge Research Institute (IBDiM). Keywords: ecodrive; assessement; CO2; mathematical models
* Corresponding author. Tel.: +39 011 0072593. E-mail address: [email protected]
© 2016 Published by Elsevier B.V. This is an open access article under the CC BY-NC-ND license (http://creativecommons.org/licenses/by-nc-nd/4.0/).
1.Scope
Scope of this paper is to show a way, throughout micro and macro simulation, for assessing possible impact of wide diffusion of Ecodrive application, looking at what happens when vehicles interact at network level (urban) in different traffic condition.
We have decided to use different scenarios as function of percentage of diffusion and average level of traffic, just to offer results as function of those input that are more difficult to forecast. In this view the software developed could be used as Decision Support System for the city planning.
Some restrictive hypothesis have been introduced to simulate behavior of drivers: all driver marked as
“ecodriver” strictly follows the rules of ecodrive mode (assisted ecodrive), for some extent we are in the situation where “ecodrive” mode, once selected, act as “automated” device, so we are assessing the maximum benefit
achievable.
Of course we don’t want, and there is no room, to discuss on real feasibility of such “automated ecodrive”, or discuss on real potential diffusion and fidelity of drivers for “assisted ecodrive”. On “fidelity” attitude of ecodrivers
we can just mention the analysis of Fiat “Eco:drive” tool which showed that there is a learning curve (with sigmoid function) that takes some days (10–15) to reach maximum value of “EcoIndex” and values reached are kept in average for 30 days, but the overall period of observation was only of 149 days.
2.Introduction
Eco-drivers have been modelled and simulated at both micro and macro level with a suitable simulation platform, developed within the FP7th ICT Emission project.
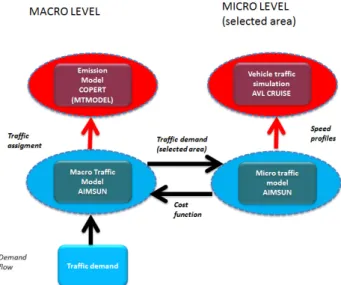
Picture below shows the platform components and relationship among them.
Fig. 1. The simulation platform.
Within the simulation platform the macroscopic model is in charge to simulate the allocation (assignment) of origin-destination trips to the road network (AIMSUN macro); to do that the O-D matrix, containing number of trips
and the “cost function”, which provides relationship between traffic flow and travel time are needed. Once traffic
flows are knew, emissions will be computed using the Emission Functions provided by COPERT.
It is clear that since behavior of driver in setting acceleration and speed is different for Normal and Eco driver, they will have different Cost Functions. The estimation of such cost function is done using microscopic simulation
model inside the Platform (AIMSUN micro); a “small area” with its road network is selected, and each vehicles
travelling inside this “small area” is micro-simulated with a time step around 1 sec.
A sample or all the trajectory of vehicles for both “normal” and “eco” drivers will be selected producing for each vehicle its “speed profile” inside the area, these “profiles” are then processed with the Vehicle simulator of the
Platform (CRUISE), which provide detailed results in terms of Fuel consumption and pollutant emission, allowing also calibration of cost function for both normal and eco driver.
3.Micro model enhanced
At the micro level, models that describe the process by which drivers follow each other in a traffic stream are
generally referred to as “car following” models. Gipps model is one of the most widely studied and applied models
for the microscopic simulation of traffic but to properly simulate the “normal” drivers and the “eco-drivers” it needs some improvements.
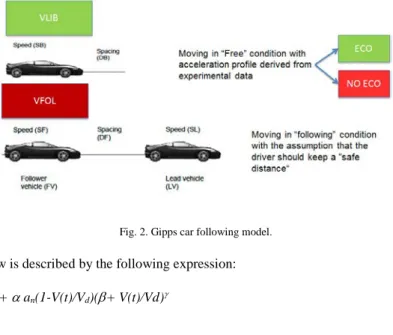
The original Gipps car-following law is divided in two parts: a first law, “free speed”, that manages the user’s
behaviour at free flow, when the interactions between the vehicles are low and a second law, “following speed”,
which manages the user’s behavior when it is engaged in following another vehicle, derived from the assumption
that the driver wants to keep a sort of safety distance with the preceding vehicle.
Fig. 2. Gipps car following model.
The “free speed” law is described by the following expression:
Vlib (t+T) = V(t) + D an(1-V(t)/Vd)(E+ V(t)/Vd)J (1)
where:
Vlib free speed
an max acceleration
Vd max speed (the speed the driver would get if there weren’t constraints)
The “following speed” law is described by the following expression:
Vfol (t+T) = bnT + [bn2 T2 - bn ( 2 ( xn-1 - sn - xn) – Vn(t)T + Vn-1(t)2 / bn-1))]0,5 (2)
where:
Vn(t) and Vn-1(t) are, respectively, the follower’s and the leader’s speed at time t
n follower vehicle n-1 preceding vehicle
xn , xn-1 vehicle n e n-1 positions
bn the most severe braking that the driver of vehicle n (i.e. the follower) wishes to undertake
bn-1 the follower’s estimate of the leader’s maximum braking rate
sn the length of vehicle n plus a safety margin
The vehicle length + safety margin s and the breaking ratio bn/bn-1 has been modelled with two sub-models able to better describe the driver behaviours.
sn = sn0 + JVG (effective length); (3)
bn/bn-1 = D0 (1-V/Vmax)O (breaking ratio); (4)
where:
sn0is the vehicle length
parameters JGDO, has been calibrated (see below) getting these values
W=1 sec O =0,3862
b=4 m/s2 s
0=11 m
Vmax =123 km/h J=2,561
D0=1,224 G =0,3446
The calibration of expression (1) and (2) has been done using FIAT Ecodrive experimental data.
In the following pictures the acceleration function used in (1) and deceleration functions used in (2) for “normal” and “eco” driver, based on analysis of FIAT Ecodrive data base:
Fig. 3. Acceleration (a) and deceleration (b) function for ecodrive and “normal” driver. The following parameters have been computed:
an = 5.21, α = 2.60, β=1.89, γ=-4.42 for Ecodrive users an= 2.95, α = 1.47, β = 1.91, γ = -2.47 for Normal users
The others parameters of expression (2) have been computed taking into account that micro behaviour (speed--distance law) must be coherent with traffic macro behaviour as described by the well known Fundamental Diagram which describe relation between traffic density and traffic flow.
The Fundamental Diagram (Kremer formulation) has been estimated using the experimental data of an “average lane” of a road section belonging to a two lane motorway described by the following expression:
v = vff [1 - (k / kj)α ] β (5)
where:
vff free flow speed
k Density kj Jam density
α; β parameters to be calibrated
The parameters for the traffic on two-lane highway are: vff = 123 Km/h;
kj = 91 Veic/km;
α = 1,4; β = 4
4.Test case simulated and results
The scenario selected for assessing at macro level the impact of eco-drive is the city of Turin with a road network modelled with a graph having 2500 nodes and 6200 links with an OD demand in peak hour of 254.000 trips with 300 centroids (zones). Data used for building scenarios are coming from the Traffic Management System operated by 5T which collect traffic data from more than 1000 traffic sensors and process them for estimate OD matrices for each hour of the day.
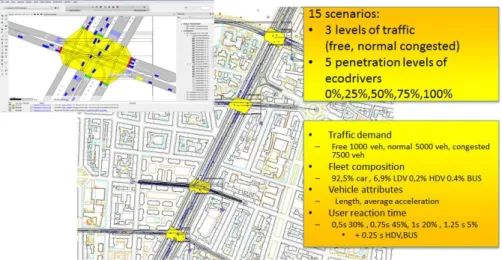
As far as the “small area” for microsimulation, it has been selected as part of a corridor of 1.6 km in Turin having the characteristics depicted in the following picture.
Fig. 4. The test site.
Analysis have been carried out considering three traffic conditions: free, normal and congested. For micro scenario this means that a demand (OD within the selected “small area”) respectively of 1,000, 5,000 and 7,500 veh/hour have been used, while for Macro scenario an OD demand respectively of 31,000, 168,000 and 254,000 trips have been used.
Moreover the analysis has used five ecodriver diffusion rate: 0%, 25%, 50%, 75%, 100%.
As mentioned before the micro simulation produce the speed profiles for each vehicle travelling inside the “small area”. This speed profiles for both “normal” and “eco” driver, have been used as input of the Vehicle emission
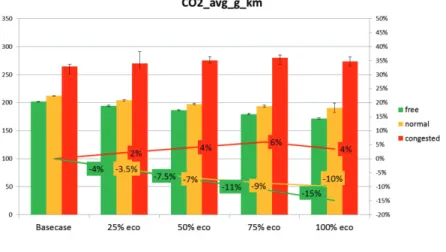
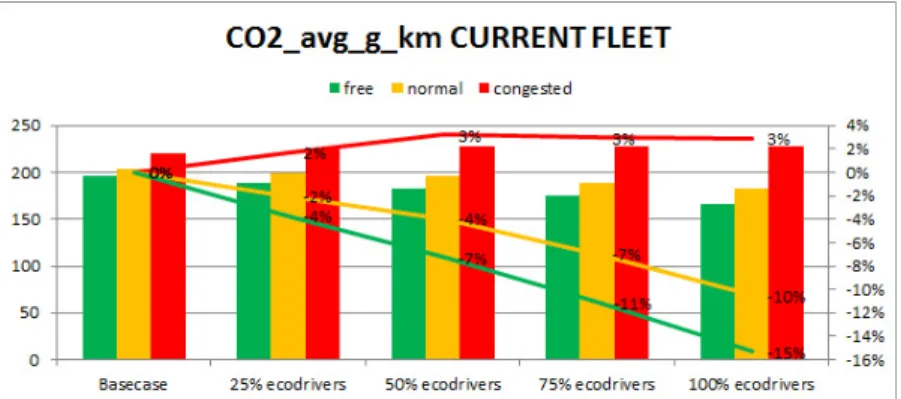
The following chart show the overall results from Micro scenarios in term of g/km of CO2, for each level of
traffic and each “ecodrive” diffusion rate.
Fig. 5. Relative emissions (g/km) in function of traffic level and diffusion rate.
We can see that in “free flow” condition, with all “eco” drivers the improvement is quite high reaching 15%. Changing the level of traffic the results change; in “normal” condition, with all eco-drivers, the percentage decreases from 15% to 10% and more or less in proportional way for the other “diffusion rate”.
In congested condition there isn’t any improvement but a slight worsening, even with low “diffusion rate”. This is due to less freedom in manouvering less acceleration and, as consequence, less average speed.
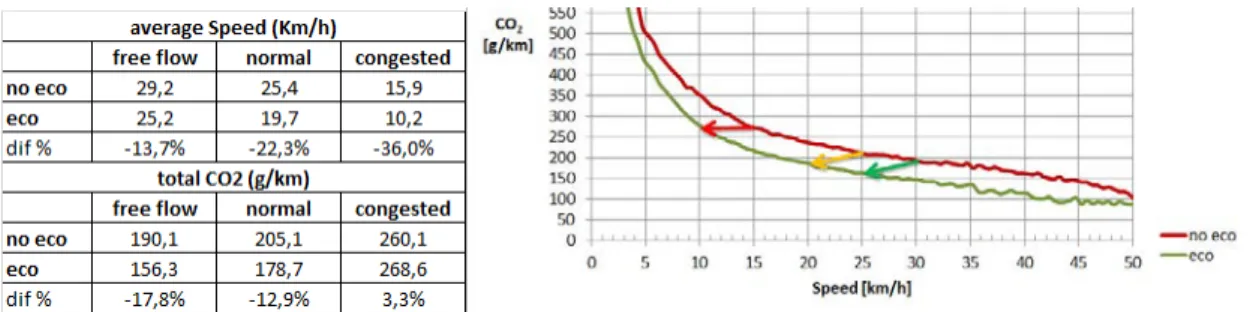
From the analysis of emission coming from Vehicle simulation model it is also possible to estimate the “emission function” (COPERT like), for vehicle driven by “normal” drivers and for vehicle driven by “eco” drivers, which provide CO2 emission in g/km as a function of the vehicle speed as depicted in the following picture:
Fig. 6. Eco drive and normal relative emissions.
As expected, the curve of emission function for “eco” vehicles is below those for “normal” vehicle.
CO2 reduction for single vehicle at the same speed is around 20–25% for speed between 10 and 45 km/h. The
As already said, because of the nature of the eco-drive which change the “rules” of interaction between vehicles,
the comparison between eco and normal scenario has to be done also considering not only effect on emissions but
also effect on “performance oftraffic”.
The table below shows number of trips (demand), average speed, total CO2 emitted and CO2 emitted in each trips, for the 6 scenarios considered.
Table 1. The comparison between eco and no eco drivers in function of the traffic level. Demand (num. of trips)
free flow normal congested
no eco 10157 45296 71481
eco 10253 45481 67532
dif % 0.9% 0.4% -5.5%
Average speed (km/h)
free flow normal congested
no eco 29.2 25.4 15.9
eco 25.2 19.7 10.2
dif % -13.7% -22.3% -36.0%
Total CO2 (kg)
free flow normal congested
no eco 2359.7 9960.2 21963.4
eco 1965.8 8573.2 20421.2
dif % -16.7% -13.9% -7.0%
Total CO2 (kg/trips)
free flow normal congested
no eco 0.232 0.220 0.307
eco 0.192 0.189 0.302
dif % -17.5% -14.3% -1.6%
As it is easy to see there is always a reduction in average speed, moreover in the case of “congested” scenario
there is also a reduction of number of trips, that means that not all vehicle can enter the scenario area within the scenario time window (just because of congestion and delay). Of course there is a reduction in CO2 emission, which
is decreasing significantly for “congested” scenario, and almost vanish considering reduction for single trips. If we use the “emission function” previously defined we can draw three arrows, one for each traffic condition: green =free, yellow=normal, red=congested, showing the correct reduction of CO2 emission, which must refer to the correct speed.
5.Scale up to the macro level
The simulation platform offer the possibility to scale up results to the macro level to assess effect of measure like eco-drive on large network. Macro Model used is a static Assignment Model which need the definition of the cost function (speed intensity curve), which are the relationship between the level of traffic, in terms of ratio between flow and capacity and the level of service, in term of travel time. The cost functions have been estimated for the road link of the “small area” used for micro simulation which provide needed data.
Fig. 8. The speed intensity curve.
The cost function are different for different percentage of Eco-drive vehicle inside the traffic flow. The picture above shows the “cost function” for 5 different share of eco-drive vehicle. The horizontal axe contains the rate between flow and capacity, the vertical axe contain the rate between time and time in free flow condition.
The presence of eco drivers change this ratio in a different way depending from the percentage of eco-drive: in free flow condition, near the diffusion rate equal 0%, increase less than in congested one near the capacity . Then the
“cost function” for different percentage of Eco-drive vehicle has been used in the macro traffic model evaluating the impact of emission at macro level.
6.Results at macro level
The analysis has been done investigating how the eco driver “diffusion rate” affects traffic and CO2 emission in
different traffic conditions.
Results at macro level are similar to those found for microsimulation of the “small area”; figure above must be compared with Fig. 5.
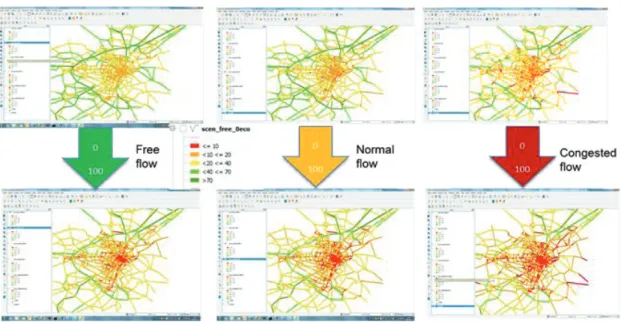
The following picture shows CO2 reduction on arcs of the Turin network for Free Flow and Normal traffic
scenarios:
Fig. 10. Emission at macro level.
Looking at the figure below, which reports the speed (colour scale) for each link of the Turin network for the three traffic conditions at 0% and 100% of Ecodrive diffusion rate.
We see what we have already seen in micro scenario: the presence of eco drivers reduces the average speed, worsens the level of service and in turn reduces the possibility to also reduce CO2 as more widespread are the
congestion condition .
7.Conclusions
The model enhanced and the simulation platform has been suitable for simulating the passenger car eco-drive in the different traffic condition and can be used as decision Support System for the City Planning.
We can conclude that the eco drive reduce the emissions locally (single vehicle) and globally (network) in free and normal traffic condition (10–15%), while in the congested condition the reduction vanish due to the global average speed decrease (that means increase in fuel consumption and CO2 emissions), which is due to the different
behavior of Ecodrive mode where acceleration are lower and inter-distance between vehicles are larger compared with normal drive mode.
It is worthwhile to remark that generally “congested traffic” conditions are only for 8–10% of daily time; this means that in more than 90% of daily traffic situation eco-drive mode can contribute significantly in reducing CO2
emissions.
References
Ciuffo B., Vincenzo P., Marcello M. (2012) ‘30 years of the Gipps’ car-following model: applications, developments and new features , TRB 2012 Annual Meeting.
FIAT ECO-DRIVE (2010) “Eco-Driving Uncovered- The benefit and challenges of eco-driving, based on the first study using real journey data”
http://www2.fiat.co.uk/ecodrive/#ecodrive/intro.
Gipps, P.G. (1981). A behavioural car-following model for computer simulation. Transportation Research Board Part B 15, pp. 105–111. Highway Capacity Manual (2000) Transportation Research Board. Washington, DC: National Research Council.
Horiguchi, R., Kuwahara, M., Oguchi, T., Oneyama, H. Hirai, H., Hayashi, S. Validation scheme for traffic simulation to estimate environmental impacts in ‘energy-ITS project’. Available at http://www.i-transportlab.jp/publications/papers/pdf/ITSWC2010Busan_E-ITS_20100731.pdf. Morello, E., Toffolo S., Giorgio M., Traffic Models Enhancements: Assessment of Eco-driving Behaviour , Dec. 2014, Volume 2, No. 2 (Serial
No. 3). Journal of Traffic and Transportation Engineering, ISSN 2328-2142, USA, pp. 97–106.
Morello, E. [et. al.] (2013) Methodology – Annex 2: Car Following Model Change First Analysis of Ecodrive Data, ICT-Emissions (Development of a methodology and tool to evaluate the impact of ICT measures on road transport emissions) project – FP7-ICT-2011-7, deliverable 2.1. Annex 2.
Ntziachristos, L., Samaras, Z., Toffolo, S., Valdes, Vock, Maier, Recent developments in vehicle regulations and emission modelling in Europe, MOVE Workshop, 25 June 2014, Hong Kong.
Vincenzo, P. (2012) Sensitivity analysis of microscopic traffic flow models through variance-based techniques: methodology and application to
the IDM and Gipps’ model, Transportmetrica 2012.
Taniguchi, M. (2007) A Study on the Effect of Eco-Driving Trainings to Fuel Consumption. SAE Paper 2007-08-0632.
Toffolo, S. [et. al.] (2013) Methodology, ICT-Emissions (Development of a methodology and tool to evaluate the impact of ICT measures on road transport emissions) project – FP7-ICT-2011-7, deliverable 2.1.
Toffolo, S., Morello, E., Samaras, Z., Ntziachristos, L., Vock, C, Maier, W,. Castro, A.G., ICT-emissions methodology for assessing ITS and ICT solutions, proceedings Transport Research Arena – Europe 2014, 14–17 April 2014, Paris.