Cotton Transportation and Logistics: A Dynamic System John R.C. Robinson, John L. Park, and Stephen Fuller
Robinson is Associate Professor and Extension Specialist/Cotton Marketing, Park is Associate Professor and Extension Specialist, and Fuller is Regents Professor, Department of Agricultural
Economics at Texas A&M University Abstract
The paper reviews the evolution of U.S. cotton transportation and logistics patterns over the last three decades. There have been many forces of change over this time period, with the largest change being a shift from primarily domestic market destinations to the international market. We describe the pre-1999 system and flow patterns when domestic consumption of U.S. cotton was dominant. We contrast this with current flow patterns as measured by available secondary export data and a sample of survey data from Texas cotton warehouses. The survey data show similar shipment destinations and modes of transportation for Texas cotton as observed in the Mid-1990s. The main difference is the increased percentage of export destinations, reflecting the transformation of the U.S. cotton industry into an export industry.
CONTACT LIST:
Dr. John Robinson is the paper presenter and the paper contact.
Dr. John Robinson, Department of Agricultural Economics, Texas A&M University, College Station, Texas. Phone: 979-845-8011. e-mail: jrcr@tamu.edu
Dr. John Park, Department of Agricultural Economics, Texas A&M University, College Station, Texas. Phone: 979-845-1751. e-mail: jlpark@tamu.edu
Dr. Stephen Fuller, Department of Agricultural Economics, Texas A&M University, College Station, Texas. Phone: 979-845-1941. e-mail: sfuller@tamu.edu
Cotton Transportation and Logistics: A Dynamic System John R.C. Robinson, John L. Park, and Stephen Fuller
INTRODUCTION
Cotton is one of the more important row crops in southern and southwestern states. The U.S. is the second-largest producer of cotton in the world and, in recent years, has produced about 20% of the world's annual supply. Texas has the largest share of U.S. cotton production at around 30% and a regional farming economy that is dominated by its production, processing, and shipment (Robinson and McCorkle, 2006). U.S. cotton industry has been in a state of change over the last three decades. As Table 1 shows, this change has been largely policy driven, though changes in technology and business innovations have played a major role. For example, U.S. transportation deregulation set the stage for a shift from interregional cotton shipments by rail to truck (see Results and
Discussion). The combined impact of twenty years of U.S. commodity policy has been to encourage large supplies of cotton for the export market, which in turn has implications for U.S. cotton flows (e.g., more shipments to Pacific coast ports). The successful applications of plant breeding and pest management have further encouraged the trend towards regular exportable supplies of U.S. cotton. Trade policy agreements have probably facilitated the outsourcing of U.S. textile manufacturing, first to Mexico, and then to the Far East. This has implications for the destination and flow pattern of U.S. raw cotton shipments in general, and Texas in particular.
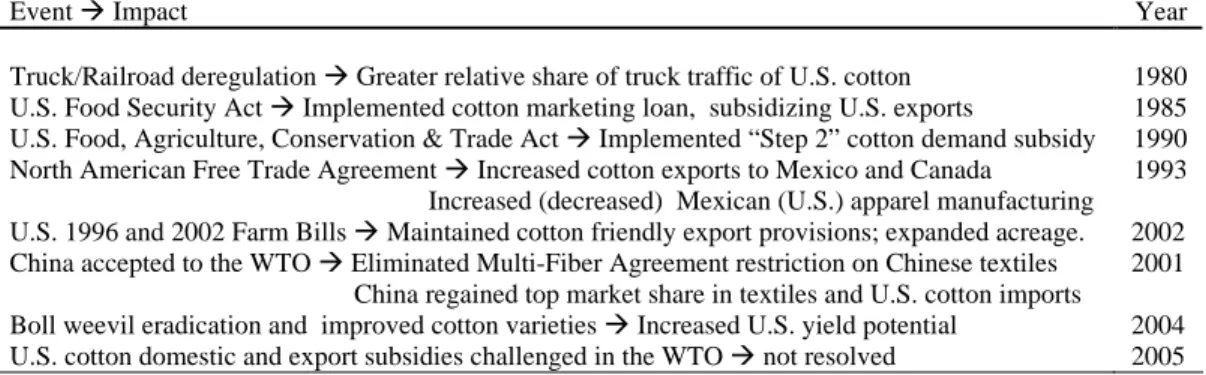
Table 1. Major Forces of Change in U.S. Cotton Flow Patterns, 1980-2006.
Event Impact Year
Truck/Railroad deregulation Greater relative share of truck traffic of U.S. cotton 1980 U.S. Food Security Act Implemented cotton marketing loan, subsidizing U.S. exports 1985 U.S. Food, Agriculture, Conservation & Trade Act Implemented “Step 2” cotton demand subsidy 1990 North American Free Trade Agreement Increased cotton exports to Mexico and Canada 1993 Increased (decreased) Mexican (U.S.) apparel manufacturing U.S. 1996 and 2002 Farm Bills Maintained cotton friendly export provisions; expanded acreage. 2002 China accepted to the WTO Eliminated Multi-Fiber Agreement restriction on Chinese textiles 2001 China regained top market share in textiles and U.S. cotton imports
Boll weevil eradication and improved cotton varieties Increased U.S. yield potential 2004 U.S. cotton domestic and export subsidies challenged in the WTO not resolved 2005
There are few secondary data sources and little public analysis of current U.S. cotton distribution patterns and transportation/logistics costs. During the 1970s-1990s, the USDA Economic Research conducted regular surveys of cotton warehouses to document U.S. cotton flow patterns. However, this research program was terminated in 1997. The lack of transportation and logistics information for U.S. cotton is unfortunate given the dynamics in cotton marketing within the U.S., e.g., changes in seed cotton storage and assembly systems, evolution of fewer gins of larger capacity, noteworthy decline in U.S. mills and the important growth in foreign demand for U.S. cotton. And, as a result of the orientation away from the domestic market to the foreign market, there has been an important change in the transportation and logistics of cotton.
This paper documents recent changes in U.S. cotton transportation and logistics, with a focus on Texas. We summarize the system and flow patterns when domestic consumption of U.S. cotton was dominant (i.e., 1970s-1990s). We then contrast with the present export-based system,
documenting and discussing important forces that changed the system such as the exiting of domestic textile mills and growing international demands, which is the result of globalization. We document the current situation using more recent secondary data on U.S. cotton exports as well as results from a Texas cotton warehouse survey project.
DATA SOURCES AND DEVELOPMENT
Secondary Data Review. Most of the information in this paper is from secondary sources on historical cotton flows and exports. The U.S. flow pattern for the mid 1970s and mid 1990s was characterized by data from two USDA flow study publications (USDA ERS, 1988 and 1997). We also reviewed U.S. cotton export data since the late 1990s (USDA Foreign Agricultural Service, 2006).
Survey Methodology. Preliminary primary data from ongoing survey work are included in this study. The first phase of this primary data collection targeted Texas cotton warehouse managers as the initial transportation point. A draft survey instrument was developed after considerable
consultation with and review by Texas cotton warehouse managers. The population being surveyed included the entire population of Texas cotton warehouses, who were identified from the USDA Commodity Credit Corporation list of approved cotton warehouses. The four page mail
questionnaire, cover letters, and stamped return envelope were mailed to South Texas cotton warehouses in September 2006 and West Texas in October 2006. Reminder post cards and follow-up surveys were mailed to late or non-respondents. The returned survey information was coded and compiled in MS Excel and summary statistics were estimated.
RESULTS AND DISCUSSION Review of Secondary Data
Table 2 summarizes cotton shipment information from Texas warehouses in the last two of a series of USDA publications on U.S. cotton distribution patterns (Glade and Johnson, 1988; Glade et al. 1997). Several trends can be highlighted from these historical data. First, the impact of
transportation deregulation can be seen as a decline in rail traffic of Texas cotton in favor of trucking. In the mid 1980s the share was 42% rail versus 58% truck, which changed to 25% rail versus 75% truck by the mid 1990s. However, the pattern in Texas differs from the national trend in that almost all southeastern U.S. and most south central U.S. cotton shipments had shifted to trucks by the mid 1990s (data not shown). In contrast, the large volumes of cotton in Texas, the relatively long distances to destinations, and the increasing importance of Pacific coast port destinations have maintained a role for rail traffic.
A second important point to make from these data involves the relative share of U.S. domestic mill destinations versus the export market. The total bales shipped from Texas to southeastern mill destinations increased from 37% in 1986/87 to 52% in 1993/94, Texas export shipments declined over the same period (Table 1). Shipments of U.S. cotton to domestic mill destinations followed a similar trend over a longer time frame with 45% in 1980/81, 52% in 1986/87 and 63% in 1993/94 (Glade et al., 1997). This apparent trend in increasing domestic U.S. cotton shipments is notable for how dramatically it was reversed after the mid 1990s. USDA data on U.S. cotton utilization over
Table 2. Cotton Shipments from Texas Warehouses by Destination and Mode of Transportation, 1986/87 and 1993/94. Rail (Bales) Truck (Bales) Total (Bales) % of Texas Total Destination 1986/87 1993/94 1986/87 1993/94 1986/87 1993/94 1986/87 1993/94
Southeast Mill Area: Alabama Georgia North Carolina South Carolina Virginia Total 52,886 23,151 188,355 62,505 3,134 330,031 13,571 29,336 78,304 89,010 9,834 220,055 107,415 206,146 275,173 149,825 4,999 743,558 179,771 314,428 500,091 377,658 65,202 1,437,150 160,301 229,297 463,528 212,330 8,133 1,073,589 193,342 343,764 578,395 466,668 75,036 1,657,205 5.6 8.0 16.1 7.4 0.3 37.4 6.1 10.9 18.3 14.8 2.4 52.5 New England 0 NR 2,169 NR 2,169 NR 0.1 NR Interior Concentration Points 1 270,921 220,757 3117,869 3187,643 188,790 208,400 6.5 6.6 Canada 1,386 32,496 9,869 3,549 11,255 36,045 0.4 1.1 Mexico NR 147,648 NR 80,516 NR 228,164 NR 7.2 Ports: Atlantic Coast Central Gulf West Gulf Pacific Coast 10,413 0 56,905 712,967 0 2,969 189,008 163,299 81,650 501 596,470 125,065 1,616 12,450 389,751 268,650 92,063 501 653,375 838,032 1,616 15,419 578,759 431,949 3.2 0.0 22.7 29.1 0.1 0.5 18.3 13.7 Other 4 10,075 0 5,784 0 15,859 0 0.6 0.0 Total Shipments 1,192,698 776,232 1,682,935 2,381,325 2,875,633 3,157,557 100.0 100.0 Percent Truck vs. Rail 41.5 24.6 58.5 75.4 100.0 100.0 NA NA 1
Nonconsuming points from which cotton is assembled and reshipped to final destination 2
For 1986/87: Mississippi, 6,255; Tennessee, 53,026; Texas, 11,640. For 1993/94: Tennessee, 17,667; Texas, 3,090 3
For 1986/87: Arkansas, 3,760; Louisiana, 3,576; Mississippi, 3,205; Missouri, 2,495; Tennessee, 14,510; Texas, 90,323. For 1993/94: Louisiana, 359; Mississippi, 3,420, Oklahoma, 22,794; Tennessee, 18,023; Texas, 143,047
4
Minor destinations and destinations designated as “other” by shipping warehouse. NR = Not reported NA = Not applicable
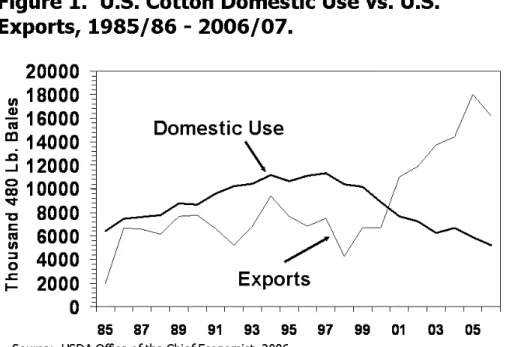
that period show a steep decline in U.S. mill use, matched by a significant rise in U.S. cotton exports (Figure 1). This coincides with the ascendancy of Chinese textile manufacturing, and the NAFTA and WTO trade agreements, all of which likely accelerated the decline of U.S. based textile manufacturing in favor of Mexican and then Far East competition. NAFTA gave Mexican textile manufacturing a temporary edge over Chinese and other competitors in the mid 1990s. However, Chinese investment in textile manufacturing and its favorable position in the WTO led to its re-establishment of dominance over Mexico in both imports of U.S. cotton and exports of textiles to the U.S. by 2001 (Gruben, 2006).
The dramatic decline in U.S. domestic cotton utilization, and the concurrent rise in U.S. exports, occurred after 1999. Table 3 documents the export trends from 1999 through 2005 using data from USDA Foreign Agricultural Service (2006). Some points from these data are notable. First, total U.S. cotton exports rose from over 3 million bales in 1999 to almost 15 million bales in 2005 (Column 11). Second, the ascendancy of China as a consumer of U.S. cotton is striking, rising from less than 1% to over 30% of the total share of U.S. cotton exports between 1999 and 2005 (Column 3). The leveling off of Mexican and Turkish imports of U.S. cotton (Column 6) reveal these countries as important but non dominating sources of demand. Rising (in most cases) cotton exports to Bangladesh, Indonesia, Thailand, and other Pacific Rim countries also emphasize the global market for U.S. cotton, and the specific importance of Far East markets.
Table 3. Exports (Running Bales) of U.S. Cotton to Major Country Destinations, 2003-2005.
Calendar Bangla- Mainland All Total
Year desh China EU-25 Indonesia Mexico Pakistan Thailand Turkey Other Exports 1999 21,096 28,137 63,730 217,483 997,167 4,678 85,502 189,792 1,470,013 3,077,598 2000 76,160 61,669 65,633 501,736 1,810,696 3,970 217,850 875,142 2,800,180 6,413,036 2001 210,274 131,196 57,197 655,882 1,798,793 152,342 330,775 772,565 3,772,774 7,881,798 2002 242,074 532,915 114,986 768,825 1,938,227 417,415 572,799 1,262,342 3,835,946 9,685,529 2003 177,241 2,107,821 156,459 768,697 1,909,159 416,191 531,444 1,612,752 3,752,155 11,431,919 2004 169,986 4,268,199 232,861 789,918 1,662,200 424,127 531,077 1,452,823 3,268,773 12,799,964 2005 143,211 5,198,346 173,338 951,804 1,624,424 401,480 681,177 2,205,219 3,184,908 14,563,907
Source: USDA Foreign Agricultural Service (2006).
In summary, recent utilization and export data reveal a major structural shift in the U.S. from a primarily domestic market to a majority export market. Some of the transportation implications of these structural shifts include the following.
• Since Mexico remains an important, albeit not dominant, demand source for U.S. cotton, there will likely be a continuation of cotton shipments from/through Texas to Mexico. • The discontinuance of the “Step 2” export subsidy in 2005 (Pan et al., 2006) could influence
the pattern of cotton shipments from/through Texas to Mexico. The nature of the “Step 2” subsidy perhaps encouraged some truck traffic across the Mexican border which might be replaced by rail or barge to interior Mexican textile mills.
• Turkish, EU-25, and (to some extent) Indian subcontinent cotton imports influence U.S. and Texas shipping patterns by creating demand for shipments from Atlantic and Gulf ports, including Houston and Galveston. The latter Texas ports are also important as delivery points for cotton futures contracts.
• The dominance of the Far East, and specifically China, as a demand source for U.S. cotton highlights the continued importance of rail traffic from Texas and other interior assembly points to Pacific coast ports (Figure 2), as well as intermodal shipments of truck trailers or containers on flatbed rail cars, dedicated unit trains, and special through-rate rail/ocean shipping rates by ocean carriers back-hauling to the Far East. All of these innovations have been employed in cotton shipping for decades (Glade and Johnson, 1988; Glade et al., 1997), but their prevalence is likely to rise with the Far East cotton trade.
Texas Cotton Distribution Survey Results
Sample Size. As of Dec. 1, 2006, the authors have received fifteen survey packets out of 30 mailed for a response rate to date of 50%. The fifteen surveys account for 43 separate warehouse facilities with, significantly, a total warehouse capacity of 4,371,664 bales. Over the 2005-06 crop year, these 43 warehouse facilities report receipt of 6,066,758 bales total and 404,450 bales on average and shipment of 6,251,596 bales total and 416,773 bales on average (Table 4). For comparison, respondents were asked to provide a three year average of bales received. From 2003-2005, these warehouses report combined average receipts of 4,592,853 bales. This level of volume is
significant as it represents two thirds of the average 6.8 million bales/year produced in Texas during 2003-2005. Thus these 43 warehouses are handling a majority of the volume of bales produced, stored, and shipped in Texas. The warehouse facilities surveyed so far reflect the geographical distribution of Texas cotton production.
Volume Distribution. When looking at the draw of the warehouse receipts, our survey indicates that 45% of bales were received from gins 33 miles away or less, 37% were received from gins between 33 and 67 miles away, 11% were received from gins between 67 and 100 miles away, and 7% were
Figure 2. Total Exports to the Far East
by Port 2003-2005
Los Angeles, CA 40% Norfolk, VA 1% Long Beach, CA 24% Houston, TX 2% Savannah, GA 19% Others 1% Oakland, CA 12% Charleston, SC 1%from gins more than 100 miles from the warehouse. The temporal distribution of bales received reflects the varied harvest/ginning periods across Texas. On average, respondents indicate 2.7% of their receipts occur in July, 12.4% in August, 12.4% in September, 13.1% in October, 19.4% in November, 20.8% in December, 13.6% in January, 3.4% in February, and 2.2% in March or later. In contrast, the reported distribution of bales shipped throughout the year is more evenly distributed. This distribution relates more to marketing patterns and the influence of the USDA price support program (which subsidizes storage). On average, respondents indicate 3.7% of shipments occur in August, 4.1% in September, 7.3% in October, 10.8% in November, 7.1% in December, 8.4% in January, 11.7% in February, 9.3% in March, 7.7% in April, 7.9% in May, 9.3% in June, and 5.7% in July.
Shipment Destination. On average, respondents indicate that more than 85% of total annual
shipments were to export markets in the 2005-06 crop year. This corresponds to the national trends where over two thirds of U.S. cotton is regularly exported (Figure 1). Respondents were asked to estimate the percentage of their export shipments leaving the US through various boarder crossings and ports. Average estimates show that 13.3% of export shipments are routed through the Mexican border, 19.8% through Houston/Galveston, 0.7% though other Gulf ports, 43.8% through the Pacific coast ports, 1.1% through Atlantic coast ports, 0.1% through Canadian border, and 9% through other boarder crossings or ports (Table 5). In general, exports leaving through Pacific coast ports were more likely to be trans-shipped through other warehouse facilities. The reason for this that Pacific coast shipments are often hauled in large quantities on unit trains, and accumulated at points like Dallas.
Export Shipments. Those warehouses shipping directly to export markets were asked to indicate modes of transportation used to move the cotton to specific points of departure at border crossings or ports. These results indicate a continuation of the historical trends shown in Table 2, i.e., current intrastate cotton shipments in Texas are mostly via truck while long haul shipments to the Pacific coast are mostly by intermodal rail (Table 5).Of those warehouses shipping to Mexico, 87.9% of those shipments were by truck, 0.5% by rail boxcar, and 11.6% by rail hauled container, on average. Of those warehouses shipping to Houston/Galveston, 66.7% of those shipments were by truck, 1.4% by rail boxcar, and 32.0% by rail hauled container, on average. Of those shipping to other Gulf ports, an average of 82% of those shipments were by truck, 14% by rail boxcar, and 4% by containers on flatbed rail cars. Of those shipping to the Pacific coast, 22.1% of those shipments were by truck, 2.3% by rail boxcar, and 75.6% by containers on flatbed rail cars.
Domestic Shipments. On average, respondents indicate that 14% of total annual shipments were to domestic markets in 2005-06 crop year. This is in sharp contrast to the 52% domestic shipments in 1994/94 (Table 2) and reflects the major structural shift of the U.S. cotton industry. Of the current domestic shipments, 35.2% were shipped to destinations in Alabama or Georgia, 49.2% in North Carolina or South Carolina, 0.2% in Virginia, 5% in Texas, and 2.6% in other locations. The differences between this domestic allocation and the historical one (Table 2) probably reflects the closure of textile mills in various parts of the Southeast. Methods of transportation used for domestic shipments were mostly trucking, which continues the historical trend, which is likely reinforced by continued economic backhaul incentives of trucks carrying goods, i.e., furniture, from the Southeast. Specifically, for shipments to Alabama or Georgia, 93.4% were by truck, 0.5% by rail boxcar, and 6.1% by container, on average. For shipments to North Carolina or South Carolina, 94.9% were by truck and 5.1% by containers on flatbed rail cars, on average. For the small amount of shipments to Virginia, all transportation was via truck. For shipments to Texas destinations,
98.4% were by truck and 1.6% by rail hauled container. Finally, for all other domestic destinations, 89.4% of shipments were by truck and 10.6% by rail hauled container.
Table 4. Summary Statistics for Operational Data from Texas Warehouses.
Item n Mean Median Min Max
Volume (Total Volume=4,371,664 bales)
Total storage capacity, 2005-2006 (bales) 15 291,444 120,000 3,300 2,040,050
Average number of bales received, 2003-2006 14 328,061 87,701 5,950 2,278,475
Number of bales received, 2005-2006 15 404,451 78,094 5,611 3,017,670
Number of bales shipped, 2005-2006 15 416,773 100,500 5,424 3,401,227
Warehouse Charges
Typical receiving charge, 2005-2006 ($/bale) 14 $2.87 $2.98 $2.00 $3.50
Typical storage charge, 2005-2006 ($/bale/month) 14 $1.63 $1.95 $0.07 $2.25
Typical loading charge, 2005-2006 ($/bale) 14 $5.52 $5.00 $4.50 $6.75
Typical compress charges, 2005-2006 ($/bale) 14 $8.58 $9.25 $3.40 $9.95
Typical late pick-up charge, 2005-2006 ($/bale) 7 $1.53 $1.88 $0.15 $3.00
Typical late pick-up charge, 2005-2006 ($/bale/day) 2 $1.63 $1.63 $0.25 $3.00
Table 5. Shipments to Export Markets by Border Crossing or Port.
Percent of Direct Export Shipments Border Crossing or
Port
Percent of all
Export Shipments By Truck By Rail Boxcar By Container
Mexican Border 13.3 87.9 0.5 11.6
Houston/Galveston 19.8 66.7 1.4 32.0
Other Gulf Ports 0.7 81 14 4
Atlantic coast 1.1 100 0 0
Pacific coast 43.8 22.1 2.3 75.6
Other 9.1 52.5 2.5 45.0
SUMMARY
The U.S. cotton market has undergone a major shift from having considerable domestic demand to primarily supplying foreign demand. The distribution of this foreign demand is diverse, but most concentrated in the Far East. This has accentuated the transportation patterns within the U.S. and Texas that supply cotton to ports of exit. The major Texas patterns continue to involve truck shipments to interior concentration/trans-shipment by rail to the Pacific coast, truck shipment to western Gulf ports for export, and truck shipments to the Mexican border.
REFERENCES
Glade, E. H., and M. D. Johnson. 1988. U.S. Cotton Distribution Patterns, 1986/87. Statistical Bulletin No. 796. USDA Economic Research Service.
Glade, E. H., M. D. Johnson, and L. A. Meyer. 1997. U.S. Cotton Distribution Patterns, 1993/94. Statistical Bulletin No. 940. USDA Economic Research Service.
Gruben, W. C. “NAFTA, Trade Diversion and Mexico’s Textiles and Apparel Boom and Bust.” Southwest Economist (5):11-13. Federal Reserve Bank of Dallas.
National Ag Law Center. 2006. United States Farm Bills.
Pan, S., Mohanty, S., D. Ethridge, and M. Fadiga. 2006 “The Impacts of U.S. Cotton Programs on the World Market: An Analysis of Brazilian WTO Petition.” Journal of Cotton Science 10:180-192.
Robinson, J. R. C. and D. A. McCorkle. 2006. “Trends and Prospects for Texas Cotton.” Texas: Connecting the Old West to the New East. Cotton Outlook. May, 2006.
http://agecon2.tamu.edu/people/faculty/robinson-john/Cotlookarticle.pdf accessed 11/20/06. USDA Agriculture Marketing Service. 2003. Ocean Rate Bulletin.
http://www.ams.usda.gov/tmd/ocean/2003_bulletins.htm . Accessed 11/20/06. USDA Agriculture Marketing Service. 2004. Ocean Rate Bulletin.
http://www.ams.usda.gov/tmd/ocean/2004_bulletins.htm . Accessed 11/20/06. USDA Agriculture Marketing Service. 2005. Ocean Rate Bulletin.
http://www.ams.usda.gov/tmd/ocean/2005_bulletins.htm . Accessed 11/20/06. USDA Agriculture Marketing Service. 2006. Ocean Rate Bulletin.
http://www.ams.usda.gov/tmd/ocean/2006_bulletins.htm . Accessed 11/20/06. USDA Foreign Agricultural Service. 2006. Export Sales Query System
http://www.fas.usda.gov/esrquery/ . Accessed 11/20/06.
USDA Foreign Agricultural Service. 2006. FATUS database for U.S. cotton exports.
http://www.fas.usda.gov/ustrade/USTExFatus.asp?QI= Accessed 11/20/06.
USDA Office of the Chief Economist. 2006. World Agricultural Supply and Demand Estimates.