Sebastião do Amaral Machado1, Ronan Felipe de Souza2, Eldemar Jaskiu3, Ricardo Cavalheiro3 (received: March 15, 2010; accepted: June 30, 2011)
ABSTRACT: This study aims to construct definitive sites curves for native bracatinga stands (Mimosa scabrella Benth)in the metropolitan region of Curitiba. Data used was extracted from 648 pairs of values of dominant height and age. Ten mathematical models were tested for guide curve fitting. Selection of the best performing model was based on adjusted coefficient of determination (Raj2), standard error of estimate in percentage (Syx%) and graphic analysis of residuals. Models were tested and the Chapman-Richards model was selected for construction of limit curves of site classes due to the biological significance of its coefficients, statistical performance and good distribution of residuals. Curve anamorphism and model validity were verified using the test proposed by Kirby (1975). Curve stability was demonstrated based on stem analysis data composing part of the database. Site classification for bracatinga stands was thus considered suitable and can potentially be applied to development of growth and yield equations for this particular species.
Key words: Bracatinga, site classification, model testing, curve stability.
CONSTRUÇÃO DE CURVAS DE SÍTIOS PARA BRACATINGAIS NATIVOS DA REGIÃO METROPOLITANA DE CURITIBA
RESUMO: Neste trabalho, objetivou-se a construção de curvas de sítios definitivas para bracatingais nativos da região metropolitana de Curitiba. Os dados utilizados provieram de 648 pares de valores de altura dominante e idade. Foram testados 10 modelos matemáticos para o ajuste da curva guia. O modelo de melhor desempenho foi escolhido com base no coeficiente de determinação ajustado (Raj2), erro padrão da estimativa percentual (S
yx%) e análise gráfica de resíduos. Dentre os modelos testados o de Chapman-Richards foi selecionado para a construção das curvas limites das classes de sítio, em decorrência da significância biológica de seus coeficientes, desempenho estatístico e boa distribuição de resíduos. O anamorfismo das curvas e a validade do modelo foram verificados por meio de teste proposto por Kirby (1975). A estabilidade das curvas foi comprovada com base nos dados provenientes de análise de tronco que compunham parte da base de dados. Dessa forma, a classificação de sítios realizada para os bracatingais foi considerada adequada e, poderá ser aplicada no desenvolvimento de equações de crescimento e produção para essa espécie. Palavras-chave: Bracatinga, classificação de sítios, teste de modelos, estabilidade de curvas.
1Forest Engineer, Professor PhD in Forest Management and Biometry – Departamento de Ciências Florestais – Universidade Federal do Paraná – Rua Lothário Meissner, 632 – 80210-170 – Curitiba, PR, Brazil – samachado@ufpr.br
2Forest Engineer, PhD Candidate in Forest Engineering – Departamento de Ciências Florestais – Universidade Federal do Paraná – Rua Lothário Meissner, 632 – 80210-170 – Curitiba, PR, Brazil – ronanflorestal@gmail.com
3Academic in the field of Forest Engineering – Departamento de Ciências Florestais – Universidade Federal do Paraná – Rua Lothário Meissner, 632 – 80210-170 – Curitiba, PR, Brazil – eldemar_jaskiu@yahoo.com.br, cavalheiro1@hotmail.com
1 INTRODUCTION
Bracatinga (Mimosa scabrella Benth) is a heliophyle species, pioneer in secondary vegetation of Mixed Ombrophilous Forest. The traditional system using bracatinga can be considered the oldest wood production method in southern Brazil, brought into use even prior to eucalyptus cultivation (BAGGIO et al., 1986). At present, bracatinga is the most important native forest species of the metropolitan region of Curitiba while being distributed across an area of around 66,768 ha (MAZZA et al., 2000). It is predominantly cultivated in small farmed properties up to 50 ha in area, in most of which it plays the part of a ‘green savings account’ for the reason that producers
expect to derive a reliable income with hardly any labor requirements (CARPANEZZI et al., 1988).
Site index is a numeral measure and may be derived using an analytical or a graphic procedure, computing n pairs of values of dominant height and age as database, and covering the entire range of variation of these two variables. In addition to a database, adopting a method capable of providing flexibility in different curve forms for site classification in a given region is also necessary. Among the methods used for constructing site index curves, the guide curve method is one that has been widely used, for instance, in the work of Cruz et al. (2008), Martins et al. (2007), Scolforo and Machado (1988) and Selle et al.(1994).
Machado et al. (1997) developed site index curves for bracatinga stands in the metropolitan region of Curitiba, yet their relevant database did not suffice to cover dominant height and age combinations comprehensively. The classification defined by these authors is therefore scarcely suitable for use in current studies about growth and yield for this species. With significant support from a database that represents well all site classes and ages, the new site curves being presented can indeed be regarded as definitive.
With the above considerations in mind, this work aims to construct new site index curves, necessary and suitable for studies about growth and yield as well as for bracatinga site mapping in the metropolitan region of Curitiba.
2 MATERIAL AND METHODS 2.1 Study site
The metropolitan region of Curitiba sits on a crystalline bedrock plateau, in Paraná state. The east, north and south faces are strongly influenced by the Serra do Mar mountain range, while the west side is influenced by the Devonian Escarpment landform on account of its position more toward the interior. Data was collected in 14 local municipalities, covering an influence area of 731,850 ha, most of which were collected in the north region also known as Vale do Ribeira.
The local phytogeographic unit is characterized as transitional between Dense Ombrophilous Forest and Mixed Ombrophilous Forest. The dominant local climate is Cfb type, according to Köppen classification, with precipitation in all seasons. The average temperature in the warmest month is under 22°C. The local altitude ranges from 850 m in Agudos do Sul to 980 m above sea level in Bocaiúva do Sul (TONON, 1998).
The local geology has a metamorphic origin, which imparts a strongly rugged topography to the region with highly heterogeneous soils with respect to depth and fertility. The local soils are predominantly alic Cambisols with poor, underdeveloped, acidic characteristics and with high aluminum contents and low base saturation (TONON, 1998).
2.2 Database
The database used for constructing new and definitive site index curves was derived from pairs of values of dominant height and age in 300 plots with age ranging from 3 to 18 years. Dominant height was obtained by applying the Assmann concept, while plot age was
determined by felling one tree and subsequently counting annual growth rings on the base section.
In order to reinforce the database, a complete stem analysis was conducted in 27 trees from some temporary plots with ages ranging from 9 to 18 years. Among the dominant trees of each plot, one tree representative of average diameter was felled. This procedure generated 348 pairs of values of dominant height and age which, along with the 300 pairs from the measured plots, made up 648 pairs of dominant height-age values aggregately used as database for developing the site curves.
2.3 Construction of site curves
Site classification requires defining a reference age, preferably nearing the crop rotation age. Typically, the rotation age for bracatinga stands is around seven years, therefore seven was the reference age selected for constructing site index curves in this study.
In order to construct limit curves of site classes, the guide curve method was used via the analytical procedure. Different models were fitted applying age in years as the independent variable, using the software application Table Curve 2D v.3, which uses the Levemberg-Marquardt algorithm, also known as the least square method. Criteria for selecting the best equation included: adjusted coefficient of determination (Raj²), standard error of estimate in percentage (Syx%) and graphic analysis of residuals.
Coefficient of determination is the ratio of the regression sum of squares to the total sum of squares. This regression statistic was adjusted for each model according to the number of coefficients, resulting in an adjusted coefficient of determination (Raj²). Standard error of estimate measures the mean dispersion among estimated values about the regression line. Formulas used for calculating Raj² and Syx% are given as follows:
where: n = number of observations; p = number of coefficients of each model; SQres= sum of squares of residuals.
aj n-1 R ² = 1-(1-R²) n-p ⋅ res yx SQ S n p = − % yx 100 yx S S Y = ⋅
Fitted mathematical models for construction of site
curves are provided in Table 1. 3.1 Statistical analysis of the database3 RESULTS AND DISCUSSION
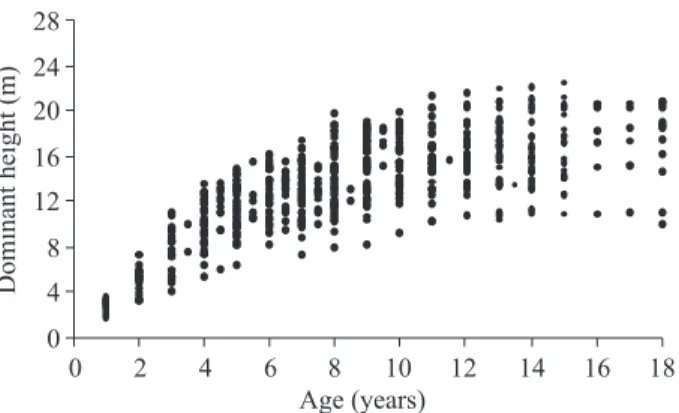
The database proved effective in developing site curves for bracatinga plantations in the metropolitan region of Curitiba, being representative at different ages. A graphic representation of the database is given in Figure 1.
Figure 1 – Values of dominant height and respective ages.
Figura 1 – Valores de altura dominante sobre as respectivas idades.
The mean asymptotic value of height growth occurred at age 16 years (17.57 m), which is regarded as suitable due to the reduction in height growth at more advanced ages, above the index age. The maximum observed frequency was 75 pairs of values at age 7 years and the minimum observed frequency was 7 pairs of values at ages 16 and 17 years. The highest values of coefficient of variation occurred at ages 2 and 3 and the lowest occurred at ages 10 and 12 years. A statistical characterization of the database used for new site classification is illustrated in Table 2.
3.2 Selection of the best equation
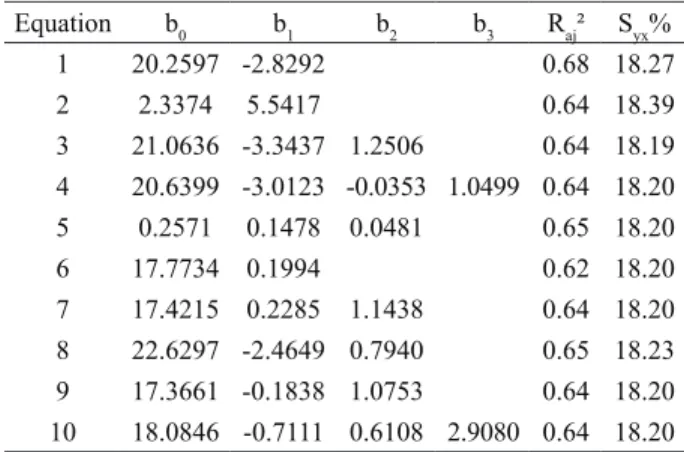
Results of model fitting with respective coefficients and measures of accuracy and dispersion are provided in Table 3. Observed Raj² values ranged from 0.62 for equation 6 to 0.68 for equation 1, while Syx% values ranged from 18.19% for equation 3 to 18.39% for equation 2.
The Raj² values found in this work were lower than results found by Scolforo and Machado (1988) for Pinus taeda, by Toniniet al. (2002) for Pinus elliottii and by Cruz et al. (2008) for Tectona grandis, who found values above 0.90. The Syx% values, on the other hand, were found to be similar to results found by these authors.
Table 1 – Tested models.
Tabela 1 –Modelos testados. 1 hdom = b .exp b0 11I 2 hdom = b + b .LnI0 1 3 hdom = b . b0 11I+b2 2I1 4 0 1 2 2 3 3 1 1 1 hdom = b .exp b b b I I I + + 5 2 2 0 1 2 I hdom = b + b I + b I 6 hdom = b 1 - exp -b .I0
(
(
1)
)
7(
(
)
)
b2 0 1 hdom = b 1 - exp -b .I 8 hdom = b .exp b0 1 1 2 I b 9(
(
b2)
)
0 1 hdom = b . 1 - exp b .I 10(
(
)
)
3 2 b b 0 1 hdom = b . 1 - exp b .IWhere: hdom = dominant height at age I; b0, b1, bn = parameters
to be fitted; I = age.
Models were fitted and the best equation was selected and then validated. For, that, the test proposed by Kirby (1975) was used, in which an equation is considered valid where the site index has a highly correlated linear relationship with the dominant height at the different ages being used. This author also suggested that the dispersion of residuals about the trend line with a zero intercept is a valid assumption for most cases. The test also suggests that curves having a linear relationship with a decreasing b1 value over the years are considered anamorphic curves.
The availability of data from stem analysis enabled a graphic assessment of the stability of growth curves for each of the trees. Clutter et al. (1983) argued that it is desirable that the dominant height of a sample unit remain constant within a site class throughout its development, that way providing a sound basis on which to base other growth and yield studies.
Unlike what was expected, the amplified database size led to reduced model accuracy, in comparison with the models fitted by Machado et al. (1997). This result was justified by the expanded range of dominant heights
Table 3 – Coefficients and statistics of fitted equations.
Tabela 3 – Coeficientes e estatísticas das equações ajustadas.
Equation b0 b1 b2 b3 Raj² Syx% 1 20.2597 -2.8292 0.68 18.27 2 2.3374 5.5417 0.64 18.39 3 21.0636 -3.3437 1.2506 0.64 18.19 4 20.6399 -3.0123 -0.0353 1.0499 0.64 18.20 5 0.2571 0.1478 0.0481 0.65 18.20 6 17.7734 0.1994 0.62 18.20 7 17.4215 0.2285 1.1438 0.64 18.20 8 22.6297 -2.4649 0.7940 0.65 18.23 9 17.3661 -0.1838 1.0753 0.64 18.20 10 18.0846 -0.7111 0.6108 2.9080 0.64 18.20
Table 2 – Statistical characterization of the database.
Tabela 2 –Caracterização estatística da base de dados.
Age (years)
Frequency per site class Minimum dominant height (m) Mean dominant height (m) Maximum dominant height (m) Coefficient of variation (%) III (9 m) II (13 m) I (17 m) 1 3 7 4 1.70 2.80 3.45 19 2 7 13 4 3.15 5.16 7.30 24 3 7 10 8 4.08 7.72 10.93 25 4 7 17 15 5.30 9.93 13.49 21 5 8 27 25 6.00 11.37 14.80 18 6 6 29 15 8.23 12.51 16.13 16 7 16 42 17 7.30 12.96 17.30 17 8 15 32 16 7.90 13.88 19.86 20 9 9 23 19 8.25 15.17 19.17 18 10 4 29 13 9.15 15.55 19.90 15 11 4 29 8 10.17 15.75 21.27 16 12 4 24 9 10.71 16.31 21.66 15 13 4 23 11 10.33 16.59 21.95 17 14 6 22 8 10.85 16.00 22.07 18 15 3 12 7 10.88 16.89 22.50 19 16 1 3 3 10.88 17.57 20.70 21 17 1 4 2 10.94 16.89 20.69 20 18 2 7 4 10.03 17.44 20.90 20 107 353 188 1.70 13.40 22.50 31
at different ages. The expanded range was justified by the existing relationship between dominant height and soil, which in the specific region of this study is characterized as heterogeneous with respect to depth and fertility.
The statistical analysis of equations as well as the distribution of residuals made it difficult to define the best equation, owing to little difference among them. This result is explained by the ample database being used, enabling satisfactory fitting even for models that usually give unsatisfactory performance.
Machado et al. (1997) chose to use the Chapman-Richards model in their study. This model is widely applied in studies about growth on account of the biological significance of its coefficients, where b0 (17.4215) represents the mean asymptotic value of height growth, b1 (0.2285) represents the growth rate defining the average slope of the yield curve and, finally, b2 (1.1438) allows deriving the m value (0.1257) via the formula b2 = 1/(m-1), expressing the inflection point of the cumulative growth curve, responsible for the sigmoidal shape.
The Chapman-Richards model being widely used in the forestry sector and this study being focused on reconstructing site curves developed by Machado et al. (1997), equation 7 corresponds to that model and thus was selected for constructing the limit curves of site index. The distribution of residuals is provided in Figure 2. The underestimation observed was justified by the amplitude of the data and did not pose a problem to curve construction by the method adopted in this study.
The new fittings failed to produce a significant improvement, with the graphic distribution of residuals being similar to the free fitting equation. Equation 7 was thus defined as the most suitable equation for constructing the site curves, as originally fitted.
In comparison with the work of Machado et al. (1997), where the authors adopted a fixed b0 value at 21, the improvement attained with an amplified database is noticeable, producing an equation with a mean asymptotic value of height growth close to the value observed for the species in the database.
3.4 Construction of site curves
Limit site curves were constructed using the analytical method, rearranging equation 7 to the limits of each site class set at 7 m, 11 m, 15 m and 19 m and setting the index age at 7 years. A subdivision into 3 site classes was the choice made, for practical reasons, in the event of site mapping. The same number of classes was defined by Tonon (1998) when rearranging the classification performed by Machado et al. (1997), yet using different class limits to those chosen in this work.
The rearranged Chapman-Richards model for use in curve construction is given as follows:
where: hdom = Dominant height in meters; IS = Site limits previously set for the reference age; I = Age in years; Iref = Reference age set at 7 years; b1, b2 = Coefficients of the fitted equation.
The effectiveness of the curves generated in this study again indicated an improvement in results if compared with the work of Machado et al.(1997). A significant difference was found for lower and upper limits of site classes at early and advanced ages.
Figure 2 – Distribution of residuals of equation 7 about dominant height and age.
Figura 2 – Distribuição de resíduos da equação 7 sobre altura dominante e idade.
Table 4 – Coefficients and statistics of data fitting with fixed b0 values.
Tabela 4 – Coeficientes e estatísticas dos ajustes com b0 fixados. Equation b0 b1 b2 Raj² Syx% 7 17 0.2566 1.2581 0.63 18.20% 7 18 0.1955 1.0154 0.65 18.21% 7 19 0.1518 0.8568 0.65 18.32% ( )
(
)
( )(
)
2 1 2 1 ref b -b I dom -b I b IS 1-exp h = 1-exp3.3 Selection of the best asymptotic value (b0)
In an attempt to improve the accuracy of the Chapman-Richards model, three asymptotic values were tested close to the value found in the free fitting (without fixing the b0 value), that is 17, 18 and 19. The results found for the fitting of the Chapman-Richards model with the 3 fixed b0 values and respective coefficients and statistics are presented in Table 4.
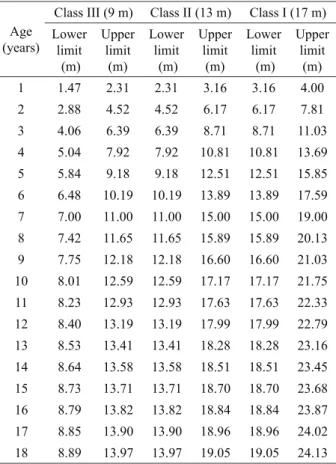
The availability of data from stem analyses at years 1, 2 and 3 enabled better guide curve fitting, allowing convergence at the 0.0 point of the x, y axes. At advanced ages, the ample database enabled stabilizing the curves near to the mean asymptotic value of height growth. Table 5 provides lower and upper limits of dominant heights for the 3 site classes at ages 1 to 18 years.
Figure 4 – Linear relationship between site index and dominant height at ages 7 and 15 years.
Figura 4 – Relação linear entre índice de sítio e altura dominante nas idades 7 e 15 anos.
Figure 3 – Limit curves of site classes. Figura 3 – Curvas limites das classes de sítios. Table 5 – Upper and lower limit for the established site classes.
Tabela 5 – Limite superior e inferior para as classes de sítio estabelecidas.
Age (years)
Class III (9 m) Class II (13 m) Class I (17 m) Lower limit (m) Upper limit (m) Lower limit (m) Upper limit (m) Lower limit (m) Upper limit (m) 1 1.47 2.31 2.31 3.16 3.16 4.00 2 2.88 4.52 4.52 6.17 6.17 7.81 3 4.06 6.39 6.39 8.71 8.71 11.03 4 5.04 7.92 7.92 10.81 10.81 13.69 5 5.84 9.18 9.18 12.51 12.51 15.85 6 6.48 10.19 10.19 13.89 13.89 17.59 7 7.00 11.00 11.00 15.00 15.00 19.00 8 7.42 11.65 11.65 15.89 15.89 20.13 9 7.75 12.18 12.18 16.60 16.60 21.03 10 8.01 12.59 12.59 17.17 17.17 21.75 11 8.23 12.93 12.93 17.63 17.63 22.33 12 8.40 13.19 13.19 17.99 17.99 22.79 13 8.53 13.41 13.41 18.28 18.28 23.16 14 8.64 13.58 13.58 18.51 18.51 23.45 15 8.73 13.71 13.71 18.70 18.70 23.68 16 8.79 13.82 13.82 18.84 18.84 23.87 17 8.85 13.90 13.90 18.96 18.96 24.02 18 8.89 13.97 13.97 19.05 19.05 24.13
In order to visualize the site classification result, limit curves were drawn on the cloud of points originated in the database, as illustrated in Figure 3.
The curves derived from the Chapman-Richards equation effectively covered the existing age and dominant height combinations. Yet the curves constructed by Machado et al. (1997) and rearranged by Tonon (1998) were seriously deficient in this respect, given that the curves constructed by these authors were only based on 158 pairs of hdom - age values .
3.5 Equation validation
The Chapman-Richards equation was validated by applying the procedure proposed by Kirby (1975) which involves fitting a simple linear model (site index = b0 + b1.hdom) with b0 being fixed at the point of convergence of the x, y axes, that is, b0=0. This linear equation with a zero intercept was fitted independently for each age from 1 to 18 years.
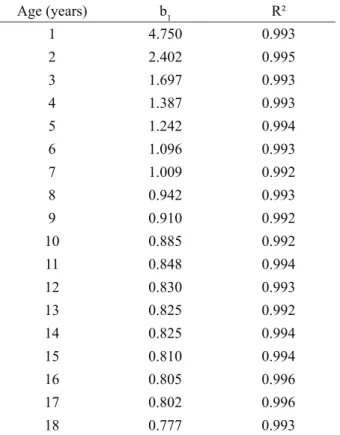
At age 7 years (reference age) the linear relationship provided a b1 value closer to 1 (1.009), with an angle nearing 45°. Figure 4 exemplifies fitting results for ages 7 and 15 years.
The coefficient of determination for fittings at different ages was above 0.99, supporting the existence of a highly linear relationship between site index and dominant height while also ensuring the validity of the selected equation. The value of b1 decreased as age increased, according to Table 6, which confirms the anamorphism of the curves generated in the classification.
Table 6 – Linear relationship between site index and dominant height at different ages.
Tabela 6 – Relação linear entre índice de sítio e altura dominante nas diferentes idades.
Age (years) b1 R² 1 4.750 0.993 2 2.402 0.995 3 1.697 0.993 4 1.387 0.993 5 1.242 0.994 6 1.096 0.993 7 1.009 0.992 8 0.942 0.993 9 0.910 0.992 10 0.885 0.992 11 0.848 0.994 12 0.830 0.993 13 0.825 0.992 14 0.825 0.994 15 0.810 0.994 16 0.805 0.996 17 0.802 0.996 18 0.777 0.993
Figure 5 –Stability analysis of dominant height growth curves. Figura 5 – Análise da estabilidade das curvas de crescimento em altura dominante.
3.6 Curve stability
The stability analysis of dominant height growth curves was performed using the stem analysis data. Figure 5 illustrates growth curves for 4 trees randomly picked from the database, even though the stability analysis was performed for all trees.
The graphic analysis revealed classification stability in most cases, with trees remaining within the same site class throughout their development. Yet some inconsistency was found at younger ages as some trees shifted class.
This result is a clear indication that one should avoid performing site classification where young stands are concerned, agreeing with results found by Cruz et al. (2008), Machado (1980), Scolforo and Machado (1988) and Selle et al. (1994).
Out of the trees being analyzed, 2 shifted sites at an older age, with shift always involving moving from inferior quality to superior quality sites. This fact was attributed to the use of stem analysis, which may have used a tree nondominant at earlier ages.
The analysis of tree growth curves proved effective in confirming the stability of the curves generated through equation fitting. With this assertion, this work proves suitable for characterizing data from bracatinga stands in the metropolitan region of Curitiba, providing a basis on which to base other growth and yield studies concerning this species.
4 CONCLUSIONS
Despite showing lower results for the statistical analysis (Raj² and Syx%) than some of the models tested, the biological model of Chapman-Richards proved effective in describing dominant height growth for bracatinga stands, with the free fitting equation being selected for construction of site curves.
The test proposed by Kirby (1975) confirmed the validity of the selected equation, resulting in a linear relationship between site index and dominant height at different ages, and the decreasing b1 value with advancing age confirmed the anamorphism of the generated curves.
The stability through stem analisys assessment revealed that curve construction based only on young age data is unsuitable, these results being consistent with results found in previous works.
The classification was found stable, since it is desirable that the dominant height of a sample unit remain constant within a site class throughout its development, that way providing a sound basis on which to base other growth and yield studies.
5 REFERENCES
BAGGIO, A. J.; CARPANEZZI, A. A.; GRAÇA, L. R.; CECCON, E. Sistemaagroflorestal tradicional da bracatinga com culturas agrícolas anuais. Boletim de Pesquisa Florestal, Colombo, n. 12, p. 73-82, jun. 1986.
CARPANEZZI, A. A. et al. Manual técnico da bracatinga (Mimosa scabrellaBENTH.). Curitiba: Embrapa-CNPF, 1988. 70 p. (Série documentos, 20).
CLUTTER, J. L.; FORSTON, J. C.; PIENNAR, L. V.; BRISTER, G. H.; BAILEY, R. L. Timber management: a quantitative approach. New York: J. Wiley, 1983. 333 p. CRUZ, J. P.; LEITE, H. G.; SOARES, C. P. B.; CAMPOS, J. C. C.; SMIT, L.; NOGUEIRA, G. S.Curvas de crescimento e de índice de local para povoamentos de Tectona grandis em Tangará da Serra. Mato Grosso. Revista Árvore, Viçosa, v. 32, n. 4, p. 679-685, 2008.
KIRBY, C. L. Site index equations for lodgeople pine and white pine in alberta. Edmouton: Northern Forest Research Centre, 1975. 12 p.
MACHADO, S. A. Curvas de índice de sítio para plantações de Pinus taeda na região central do estado do Paraná. Revista Floresta, Curitiba, v. 11, n. 2, p. 4-18, 1980.
MACHADO, S. A.; OLIVEIRA, E. B.; CARPANEZZI, A. A.; BARTOSZECK, A. C. P. S. Classificação de sítio para bracatingais nativos na região metropolitana de Curitiba. Boletim de Pesquisa Florestal, Colombo, v. 35, p. 21-37, jul./ dez. 1997.
MARTINS, E. F. P.; SILVA, J. A. A.; FERREIRA, R. L. C.; JANKOVSKI, T.; BRITO, C. C. R. Curvas de índice de sítio para Leucena (Leucaena leucocephala (Lam.) De Wit) no agreste de Pernambuco. Ciência Florestal, Santa Maria, v. 17, n. 4, p. 365-376, 2007.
MAZZA, C. A. S.; BAGGIO, A. J.; CARPANEZZI, A. A. Distribuição espacial de bracatinga na região metropolitana de Curitiba com imagens de satélite Landsat. Colombo: Embrapa Florestas, 2000. 22 p. (Circular técnica, 36).
SCOLFORO, J. R. S.; MACHADO, S. A. Curvas de índice de sítio para plantações de Pinus taedanos estados do Paraná e Santa Catarina. Revista Floresta, Curitiba, v. 18, n. 1/2, p. 159-173, 1988.
SELLE, G. L.; SCHNEIDER, P. R.; FINGER, C. A. G. Classificação de sítio para Pinus taeda L., através da altura dominante para a região de Cambará do Sul, RS, Brasil. Ciência Florestal, Santa Maria, v. 4, n. 1, p. 77-95, 1994.
TONINI, H.; FINGER, C. A. G.; SCHNEIDER, P. R.; SPATHELF, P. Índice de sítio para Pinus elliottii Engelm, em três unidades de mapeamento de solo, nas regiões da serra do sudeste e litoral, no estado do Rio Grande do Sul, Brasil. Ciência Florestal, Santa Maria, v. 12, n. 2, p. 61-73, 2002.
TONON, A. E. N. Efeito da densidade inicial e do sítio sobre o crescimento e a produção de bracatingais da região metropolitana de Curitiba. 1998. 193 f. Dissertação (Mestrado em Ciências Florestais) – Universidade Federal do Paraná, Paraná, 1998.