Iowa Research Online
Iowa Research Online
Driving Assessment ConferenceJun 25th, 12:00 AM
Vehicle Familiarity and Relative Risk of Fatal Crash Involvement
Vehicle Familiarity and Relative Risk of Fatal Crash Involvement
Brian C. Tefft
AAA Foundation for Traffic Safety
Aaron Benson
AAA Foundation for Traffic Safety
William J. Horrey
AAA Foundation for Traffic Safety
Follow this and additional works at: https://ir.uiowa.edu/drivingassessment
Tefft, Brian C.; Benson, Aaron; and Horrey, William J.. Vehicle Familiarity and Relative Risk of Fatal Crash Involvement. In: Proceedings of the Tenth International Driving Symposium on Human Factors in Driver Assessment, Training and Vehicle Design, 24-27 June 2019, Santa Fe, New Mexico. Iowa City, IA: Public Policy Center, of Iowa, 2019: 15-21.
This Event is brought to you for free and open access by the Public Policy Center at Iowa Research Online. It has been accepted for inclusion in Driving Assessment Conference by an authorized administrator of Iowa Research Online. For more information, please contact lib-ir@uiowa.edu.
VEHICLE FAMILIARITY AND RELATIVE RISK OF FATAL CRASH INVOLVEMENT Brian C. Tefft, Aaron Benson, William J. Horrey
AAA Foundation for Traffic Safety Washington, District of Columbia, USA
Email: btefft@aaafoundation.org
Summary: Lack of familiarity with a vehicle has been associated with increased crash risk independent of overall driving experience (Perel, 1983). This may pose an underappreciated safety risk in the context of complex and rapidly evolving driver assistance technologies and driver-vehicle interfaces, especially when people drive newly purchased, rented, or borrowed vehicles. The current study estimates the relationship between vehicle ownership and responsibility for crashes using data from 231,056 drivers involved in fatal crashes in the United States in years 2008-2017. A driver was considered responsible for the crash if police indicated that the driver’s pre-crash actions contributed to the occurrence of the crash, and non-responsible otherwise. Driver-, vehicle-, and roadway factors that might also influence crash risk were controlled using logistic regression. Drivers of vehicles registered to another person and drivers of rental vehicles had 1.15 and 1.20 times the odds of responsibility for their crashes, respectively, compared with drivers of their own vehicles. If non-responsible drivers approximate a random sample of all drivers present at the times and places of fatal crashes, these results approximate ratios of responsible involvement in fatal crashes per unit of driving exposure. While ownership is an imperfect proxy for familiarity and may be associated with crash risk by other mechanisms unrelated to familiarity, results are consistent with the hypothesis that drivers of unfamiliar vehicles experience elevated crash risk.
INTRODUCTION
Driver familiarity with their vehicle is an important, yet often overlooked, aspect of safety. Beyond learning how to drive safely in general, a driver must also be able to operate safely the specific vehicle that he or she drives. This requires understanding of and familiarity with the vehicle’s physical dimensions, handling characteristics, pedal positions, locations of controls, and in recent years, increasingly complex infotainment and driver assistance systems. Even experienced drivers may operate unfamiliar vehicles when they buy a new vehicle, drive a different household vehicle, rent a vehicle, or borrow a vehicle from a friend or neighbor. Little recent research has investigated the relationship between a driver’s familiarity with a vehicle and their behavior, performance, or safety. Fell et al. (1973) analyzed a sample of crashes from New York and found that crash-involved drivers had less experience with the vehicle they were driving than did a comparison sample of drivers not involved in crashes. Similarly, Perel (1983) found that drivers with less than six months of experience with a vehicle were over-represented in crashes. In a more recent naturalistic driving study, participants who drove a leased vehicle provided to them by the research team had higher rates of kinematic indicators of unsafe driving (e.g., hard braking, swerving) than did other subjects who drove their own vehicles (Lee et al., 2005).
While technologies such as power steering and electronic stability control have reduced the differences between the handling characteristics of different vehicles relative to the vehicle fleet at the times of the studies by Perel (1983) and Fell et al. (1979), modern vehicles present drivers with complex and varied user interfaces that may confuse, overwhelm, or distract the driver. A driver presented with alerts from an unfamiliar collision warning system might respond
inappropriately or fail to respond. Conversely, an owner of a vehicle with advanced driver assistance features might inappropriately expect similar functionality when driving an unfamiliar vehicle without the technology. Jenness et al. (2007) observed such behavior in a survey of owners of vehicles with radar-based backing assistance systems.
The current study sought to estimate the relationship between driver familiarity with a vehicle and risk of causing a fatal crash, with ownership of the vehicle as a proxy for familiarity.
METHODS
Design, Setting, and Participants
This study examined the relationship between whether a crash-involved driver was the registered owner of the vehicle in which he or she crashed and the odds that the driver was responsible for the crash among all drivers involved in fatal crashes in the United States in years 2008–2017. Analysis followed a modified quasi-induced exposure design (Lyles et al., 1991; Stamatiadis & Deacon, 1997) sometimes referred to as a responsibility analysis (Robertson & Drummer, 1994; Asbridge et al., 2013), which is a special form of case-control study in which drivers deemed responsible for their crashes are the cases and drivers deemed not responsible serve as controls. Data were from the National Highway Traffic Safety Administration (NHTSA) Fatality Analysis Reporting System (FARS) database, which comprises data on all crashes that occur on public roads in the United States, involve a motor vehicle in transport, and result in a death within 30 days of the crash. The data are compiled from reports completed by police officers who investigate the crashes. Because the objective of the study was to estimate the relationship between vehicle familiarity and driver safety in the context of conventional vehicles, drivers of vehicles other than cars, pickup trucks, vans, minivans, and sport utility vehicles (SUVs) were excluded. Drivers of vehicles actively being used in emergency response; drivers of unregistered or stolen vehicles, and drivers younger than 16 years of age were also excluded.
Variables
Dependent variable. The main outcome variable was driver responsibility for the crash, operationalized as whether each crash-involved driver was reported to have committed some form of unsafe driving action that contributed to the occurrence of the crash. The authors assigned responsibility for each crash on the basis of the four Driver-Related Contributing Factor variables in the FARS database, which represent the investigating officers’
determinations of driver behaviors, actions, and conditions that contributed to the occurrence of the crash. A driver was classified as responsible if any of the driver-related contributing factors indicated that a specific action by the driver contributed to the occurrence of the crash, and non-responsible otherwise. Codes representing 28 specific actions or errors were considered (e.g.,
departed travel lane, overcorrected). Only codes that indicated specific driving actions were used to assign responsibility; driver states (e.g., drowsy, impaired) were not considered. Drivers in single-vehicle crashes that involved no other road users (pedestrians, cyclists, etc.) were classified as responsible even if no contributing factors were reported. Note that the purpose of the classification of responsibility was simply to distinguish between drivers who clearly did something that contributed to the occurrence of the crash versus drivers who did not; it is not intended to represent an authoritative determination of legal “fault.”
Main independent variable. The main independent variable was the entity to whom each crash-involved vehicle was registered: the driver, another private individual (not the driver), a vehicle rental company, or a corporate/government fleet.
Potential confounders. Driver age (modeled using age and age2 to capture the U-shaped
relationship of crash risk with age), sex, age × sex interaction, crashes and moving violations in past 3 years (0,1, 2, 3+), DWI convictions in past 3 years (any versus none), license status (valid, suspended/revoked, expired/cancelled/denied, never licensed), vehicle type (car versus pickup truck/van/minivan/SUV), vehicle age, and a binary indicator of whether the driver was licensed in the same state as the crash or a different state (a proxy for familiarity with the roadway) were included in the model as potential confounders. State, year, season, time of day (3-hour blocks), day of week (weekday versus weekend), day × time interaction, weather conditions, and road type were included to increase the plausibility of the assumption that non-responsible drivers comprised a representative sample of drivers present at times and places at which responsible drivers crashed conditional upon the independent variables included in the model.
Statistical Analysis
Logistic regression was used to estimate the odds ratio (OR) associating vehicle ownership with responsibility for crashes while controlling for potential confounders. In this odds ratio (Equation 1), Ri and NRidenote the numbers of drivers who were deemed responsible and non-responsible
for crashes in group i (e.g., drivers of rental vehicles); R0 and NR0denote the numbers of
responsible and non-responsible drivers in the reference group (drivers of their own vehicles).
/ ⁄⁄ (1)
If it is assumed that crash-involved non-responsible drivers NRi and NR0 are sampled at random
from among all of the drivers (Di and D0) present at the times and places of crashes, the ratio of
the numbers of non-responsible drivers of rental vehicles to non-responsible drivers of their own vehicles (NRi/NR0) approximates the ratio of the total numbers of drivers of rental vehicles to
drivers of their own vehicles on the road (Di/D0). Rearranging Equation 1 and substituting Di/D0
for NRi/NR0 yields Equation 2.
/ ⁄⁄ ≅ ⁄⁄ ⁄⁄ / (2)
Equation 2 shows that under this assumption, the OR estimated in this analysis approximates the ratio of the exposure-based rates of responsible crashes among these two groups (e.g., the ratio of
rates of responsible crashes per mile driven among drivers of rental vehicles versus among drivers of their own vehicles). Miettinen (1976) provides a conceptual illustration unrelated to driving (the RR in Equation 2 is analogous to Miettinen’s incidence density ratio, IDR).
In attempt to elucidate the mechanisms underlying the results observed, ORs contrasting the odds of the presence of each specific driver-related contributing factor between drivers in each
respective vehicle ownership category were computed post hoc.
The data included 359,499 drivers initially eligible for inclusion. Of these, 78,448 were excluded due to indications of vehicle malfunctions or defects, pedestrian or cyclist involvement, or
unusual crash circumstances, which hindered clear assignment of responsibility. Non-responsible drivers involved in crashes in which no eligible driver was deemed responsible (n=39,574) were excluded because they provide no information about drivers present at the times and places at which the responsible drivers crashed. An additional 10,421 drivers were excluded due to missing values of other variables used in the analysis. The final analysis included 231,056 drivers involved in 167,762 unique crashes. Analysis was performed using Stata version 15.0.
Sensitivity analysis. “Clean” two-vehicle crashes (Stamatiadis & Deacon, 1997), in which one driver was found responsible the other non-responsible, were analyzed using conditional logistic regression such that the control for each responsible driver was the non-responsible driver in the same crash (Perneger & Smith, 1991). This approach arguably provides greater control for confounding by unobserved environmental factors experienced by all drivers in the same crash (e.g., unusual traffic conditions); however, by definition it omits data from drivers involved in single-vehicle crashes. This analysis included 83,632 drivers involved in 41,816 crashes.
RESULTS
Overall, 74% of all drivers (including drivers in single-vehicle crashes) were classified as responsible (Table 1).
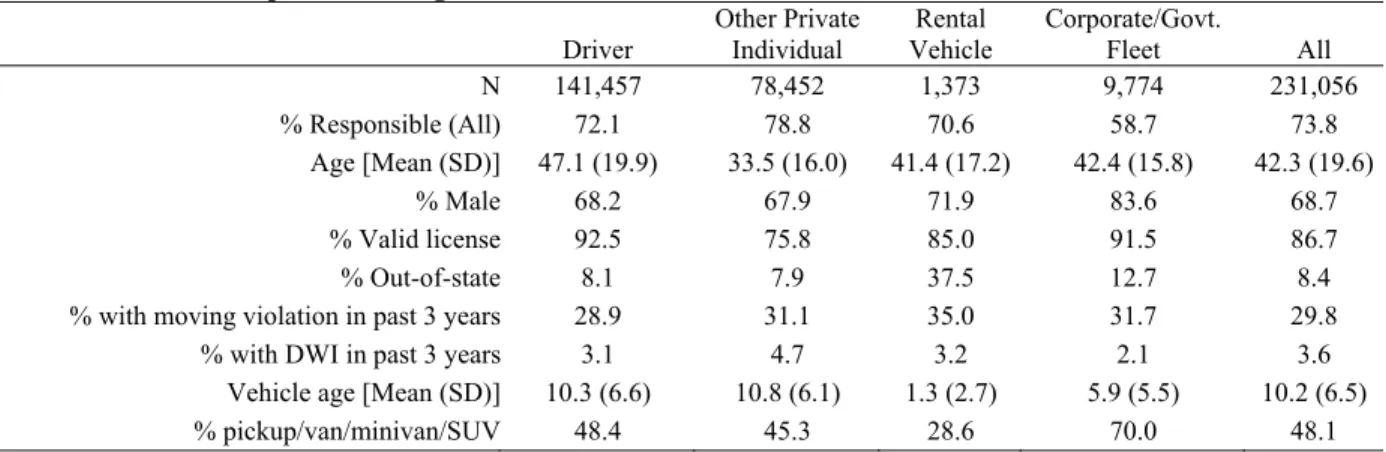
Table 1. Responsibility for crashes and selected potentially-confounding variables in relation to vehicle ownership, cars and light trucks involved in fatal crashes, United States, 2008-2017
Driver Other Private Individual Rental Vehicle Corporate/Govt. Fleet All N 141,457 78,452 1,373 9,774 231,056 % Responsible (All) 72.1 78.8 70.6 58.7 73.8 Age [Mean (SD)] 47.1 (19.9) 33.5 (16.0) 41.4 (17.2) 42.4 (15.8) 42.3 (19.6) % Male 68.2 67.9 71.9 83.6 68.7 % Valid license 92.5 75.8 85.0 91.5 86.7 % Out-of-state 8.1 7.9 37.5 12.7 8.4
% with moving violation in past 3 years 28.9 31.1 35.0 31.7 29.8
% with DWI in past 3 years 3.1 4.7 3.2 2.1 3.6
Vehicle age [Mean (SD)] 10.3 (6.6) 10.8 (6.1) 1.3 (2.7) 5.9 (5.5) 10.2 (6.5)
% pickup/van/minivan/SUV 48.4 45.3 28.6 70.0 48.1
Drivers of vehicles registered to other private individuals were most likely to be responsible; drivers of fleet vehicles were least likely to be responsible. Drivers of their own vehicles tended to be several years older, on average, than drivers of rental or fleet vehicles; drivers of vehicles
registered to other private individuals tended to be the youngest. Drivers of rental vehicles were much more likely to be licensed in a different state. Rental vehicles were much newer on average than were privately-registered vehicles, and were more likely to be cars rather than light trucks. After adjustment for potential confounders, drivers of vehicles registered to another private individual and drivers of rental vehicles had 15% and 20% greater odds of having been
responsible for their crashes, respectively, than drivers of their own vehicles (Table 2). Drivers of vehicles registered to a corporate or government fleet had 28% lower odds of having been responsible.
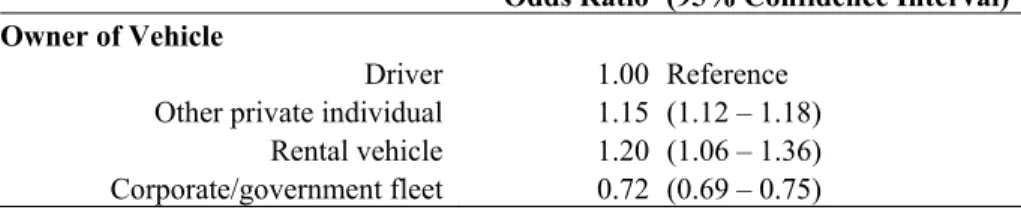
Table 2. Adjusted odds of responsibility for crash in relation to vehicle ownership
Odds Ratio (95% Confidence Interval) Owner of Vehicle
Driver 1.00 Reference Other private individual 1.15 (1.12 – 1.18)
Rental vehicle 1.20 (1.06 – 1.36) Corporate/government fleet 0.72 (0.69 – 0.75)
Post hoc analysis revealed that contributing factors significantly more common among drivers of vehicles registered to other private owners than among drivers of their own vehicles included failure to keep in proper lane; overcorrecting; speeding; and operating in an erratic, careless, reckless, or negligent manner. Factors significantly more common among drivers of rental vehicles than among drivers of their own vehicles were failure to keep in proper lane and making an improper turn. Stopping in the roadway was more common among drivers of fleet vehicles than among drivers of their own vehicles; all other contributing factors were less common among drivers of fleet vehicles.
Sensitivity analysis. Matched analysis restricted to “clean” two-vehicle crashes yielded similar results. Drivers of vehicles registered to another private individual and drivers of rental vehicles both had 11% greater odds of responsibility for crashes compared with drivers of their own vehicles (other private owner: OR 1.11, 95% CI 1.07 – 1.15; rental vehicle: OR 1.11, 95% CI 0.91 – 1.35). Drivers of fleet vehicles had 26% lower odds of responsibility than drivers of their own vehicles (OR 0.74, 95% CI 0.68 – 0.79).
DISCUSSION
This study examined the relationship between whether fatal-crash-involved drivers were the owners of the vehicles that they were driving and the odds that they committed some action or error that contributed to the occurrence of the crash. Results indicate that drivers of vehicles registered to others and drivers of rental vehicles both have significantly elevated odds of having contributed to the fatal crashes in which they were involved, compared with drivers of their own vehicles, after adjustment for many potential confounders. Assuming that drivers who were involved in these crashes in spite of no evidence of wrongdoing on their part—essentially “innocent victims”—comprise a random sample of the drivers present when and where these crashes occurred, these results would imply that drivers of borrowed or rented vehicles have increased risk of causing a fatal crash.
Driver familiarity with their vehicle is an important traffic safety consideration, as it plays a role in drivers’ understanding and expectations regarding the vehicle. It also influences how they interact with the vehicle. As new and diverse technological features such as infotainment systems and driver assistance systems become more readily available in vehicles, driver familiarity with their vehicle could become increasingly important, especially in the context of driving a rental car, a car-sharing vehicle, a newly-purchased vehicle, or a vehicle borrowed from another owner. The current study seeks to update and extend knowledge of crash risk associated with vehicle familiarity, using vehicle ownership as an admittedly-imperfect proxy for familiarity.
While the results of the current study support the hypothesis that driving an unfamiliar vehicle is associated with elevated crash risk, several limitations must be noted. First, driving an unfamiliar vehicle might increase a driver’s risk of involvement in crashes as a non-responsible driver if, for example, drivers of unfamiliar vehicles are less successful at avoiding crashes attributed to others due to lack of familiarity with the vehicle’s controls, handling characteristics, or warning
systems. If drivers of unfamiliar vehicles are over-represented among non-responsible drivers relative to their share of total driving exposure on the road, this study would underestimate the association between vehicle familiarity and the exposure-based relative risk of causing a crash. Vehicle ownership is at best an imperfect proxy for familiarity: some owners might have only recently acquired their vehicle or drive it infrequently and thus be relatively unfamiliar with it; some non-owners might borrow or rent the same vehicle routinely and be very familiar with it. Relatedly, drivers of borrowed or rented vehicles might have increased risk for reasons unrelated to familiarity. For example, they might drive less carefully when driving a vehicle that is not their own. Examination of specific contributing factors that were more common among drivers of others’ vehicles than among drivers of their own vehicles suggested both mechanisms might be at play. Drivers who crashed in borrowed or rented vehicles were relatively more likely to have committed errors such as failing to keep in the proper lane and overcorrecting, suggestive of driving errors plausibly associated with lack of familiarity with the vehicle. However, they were also more likely to have been speeding and driving in a manner characterized by the investigating officer as erratic/careless/reckless/negligent. While it is possible that such driving might in some instances be associated with lack of familiarity with the vehicle (e.g., speeding unintentionally due to failure to perceive speed accurately; apparently erratic/reckless driving actually attributable to pedal misapplication or other errors), these factors seem more likely indicative of drivers choosing to behave less safely when driving a vehicle that is not their own. Drivers of borrowed or rented vehicles might also differ from drivers of their own vehicles in other important ways that were not considered or that could not be modelled adequately. Drivers of rental vehicles may be especially likely to be driving in unfamiliar environments: more than one-third of them crashed in a different state than that in which they were licensed. While the association between driving a rental vehicle and odds of responsibility persisted even after adjustment for the risk associated with being an out-of-state driver, being an out-of-state driver is itself an imperfect proxy for familiarity with the driving environment. In addition, some drivers of borrowed or rented vehicles may not own nor have routine access to a vehicle at all, and thus may be comparatively inexperienced drivers relative to most other drivers of the same age.
Finally, this study only examined fatal crashes; the relationship between vehicle familiarity and risk of involvement in a less severe crash might be different. More research is needed to
understand the relationship between vehicle familiarity and driver behavior and performance.
CONCLUSION
This study finds that drivers of vehicles owned by others and drivers of rental vehicles have elevated risk of causing a crash, relative to drivers operating their own vehicles. This association may be due to underappreciated risks associated with driving an unfamiliar vehicle. The
importance to safety of driver familiarity with their vehicle may increase as driver-vehicle interfaces become more complex and varied and as alternatives to the traditional model of vehicle ownership become more widespread.
REFERENCES
Asbridge, M., Brubacher, J. R., & Chan, H. (2013). Cell phone use and crash risk: A culpability analysis. International Journal of Epidemiology, 42(1), 259-267.
Fell, J. C., Mudrowsky, E. F., & Tharp, K. J. (1973). A study of driver experience and vehicle familiarity in accidents. Accident Analysis & Prevention, 5(4), 261-265.
Jenness, J. W., Lerner, N. D., Mazor, S. et al. (2007). Use of Advanced In-Vehicle Technology by Young and Older Early Adopters. Results on Sensor-Based Backing Systems and Rear-view Video Cameras. Report No. DOT HS 810 828. Washington, D.C.: National Highway Traffic Safety Administration.
Lee, S. E., Dingus, T. A., Klauer, S. G., Neale, V. L., & Sudweeks, J. (2005). Naturalistic Data Collection of Driver Performance in Familiar and Unfamiliar Vehicles. Paper presented at the Proceedings of the Human Factors and Ergonomics Society Annual Meeting.
Lyles, R. W., Stamatiadis, P., & Lighthizer, D. R. (1991). Quasi-induced exposure revisited. Accident Analysis & Prevention, 23(4), 275-285.
McDonald, A., Carney, C., & McGehee, D. V. (2018). Vehicle Owners' Experiences with and Reactions to Advanced Driver Assistance Systems. Washington, D.C., AAA Foundation for Traffic Safety.
Miettinen, O. (1976). Estimability and estimation in case-referent studies. American Journal of Epidemiology, 103(2), 226-235.
Perel, M. (1983). Vehicle Familiarity and Safety. (Report No. HS-806 509). Washington, D.C.: National Highway Traffic Safety Administration.
Perneger, T., Smith, G. S. (1991). The driver’s role in fatal two-car crashes: a paired “case-control” study. American Journal of Epidemiology, 134(10): 1138-1145.
Robertson, M. D., Drummer, O. H. (1994). Responsibility analysis: A methodology to study the effects of drugs in driving. Accident Analysis & Prevention, 26(2), 243-247.
Stamatiadis, N. & Deacon, J. A. (1997). Quasi-induced exposure: Methodology and insight. Accident Analysis & Prevention, 29(1), 37-52.