Platform for Big Data Performance Analysis
Nicolas Poggi, Josep Ll. Berral, and David CarreraBarcelona Supercomputing Center (BSC)
Universitat Politcnica de Catalunya (UPC-BarcelonaTech) Barcelona, Spain
{nicolas.poggi,josep.berral,david.carrera}@bsc.es http://aloja.bsc.es
Abstract. The main goals of the ALOJA research project from BSC-MSR, are to explore and automate the characterization of cost-effectiveness of Big Data deployments. The development of the project over its first year, has resulted in a open source benchmarking platform, an online public repository of results with over 42,000 Hadoop job runs, and web-based analytic tools to gather insights about system’s cost-performance1. This article describes the evolution of the project’s focus and research lines from over a year of continuously benchmarking Hadoop under dif-ferent configuration and deployments options, presents results, and dis-cusses the motivation both technical and market-based of such changes. During this time, ALOJA’s target has evolved from a previous low-level profiling of Hadoop runtime, passing through extensive benchmarking and evaluation of a large body of results via aggregation, to currently leveraging Predictive Analytics (PA) techniques. Modeling benchmark executions allow us to estimate the results of new or untested configu-rations or hardware set-ups automatically, by learning techniques from past observations saving in benchmarking time and costs.
1
Introduction
Hadoop and its derived technologies have become the most popular deployment frameworks for Big-Data processing, and its adoption still on the rise [15]. But even with such broad acceptance in industry and society, it is still a very complex system due to its distributed run-time environment, and its flexible configura-tion [17, 18, 20]. This makes Hadoop to be poorly efficient, and improving its efficiency requires knowledge of this complex system behavior. Not to mention all the emerging hardware and new technologies enhancing Hadoop that increase complexity of Hadoop systems.
The ALOJA project is a research initiative from the Barcelona Supercomput-ing Center (BSC) with support from Microsoft Research and product groups [11] to explore and produce a systematic study of Hadoop configuration and de-ployment options. The study includes the main software configurations that can
1
ALOJA’s Web application, tools, and sources available at http://aloja.bsc.es
greatly impact Hadoop’s performance [7]; as well as different hardware choices to evaluating their effectiveness and use cases including: current commodity hard-ware on which Hadoop systems where originally designed for [1], low-power de-vices, high-end servers, to new storage and networking2; as well as new managed Cloud services (PaaS). The intent of such study is to better understand how data processing components interact during execution and automate the charac-terization of Big Data applications and deployments. With the final purpose of producing knowledge and tools for the Big Data community, that can improve efficiency of already deployed clusters and guide the design of new-cost effective data intensive infrastructures.
This article presents the evolution of the project, initial results, and some lessons learned while benchmarking Hadoop for over a year continuously; iterat-ing software configuration options and over a hundred different hardware cluster setups. At the same time, discusses the motivation both technical and market-based of such changes i.e., large search space and the emergence of economic Cloud services. As well as it overviews the different techniques employed to ex-tract performance knowledge and insights from Hadoop executions, and exposes our current lines of research and focus. Since project beginnings almost two years ago, ALOJA’s target and perspective has first evolved from a low-level profiling of Hadoop distributed environment, which allows to understand the networking bottlenecks and how components interact; to performing extensive benchmark-ing —which is still expandbenchmark-ing, creatbenchmark-ing the largest public Hadoop performance repository so far with over 42,000 job executions. The repository is then used to evaluate viaaggregation andsummarization the performance and cost effective-ness of the different configurations available in the project’s Web site, reducing both the size of data to be processed and stored. This reduction in data sizes allow us to share the platform a development virtual image to other researchers and practitioners directly, as well as to apply different Machine Learning (ML) techniques directly to the data [2].
While the results from the data aggregation efforts allows to process data interactively for the analytic online tools [2], the increasing number of config-uration choices as the project expands in architectures and services —in the
millions for benchmarks that a single iteration can takehours to execute, had led us to leverage Predictive Analytics (PA) techniques to be able to prioritize benchmarks and reduce the number of executions. PA encompasses a variety of statistical and ML techniques to make predictions of unknown events based on historical data [5, 13] —in this case the aggregated metadata of our benchmark-ing repository.
We use the Intel HiBench benchmark suite [19] as representative work-loads, and we use the ALOJA-ML toolkit, the machine learning extension of the ALOJA framework [21] for such learning. The purpose of ALOJA-ML is to discover knowledge from Hadoop environments, first predicting execution times for given known workloads depending on the Hadoop configuration and the pro-vided hardware resources; then evaluating which elements of a given deployment
2
are the most relevant to reduce such running times. Our project goal is to find accurate models automatically to show and understand how our systems work, but also use them for making decisions on infrastructure set-ups, also recommen-dations for Hadoop final users towards platform and software configurations. At the same time supporting ALOJA’s goal of automating Knowledge Discovery (KD) and recommendations to users.
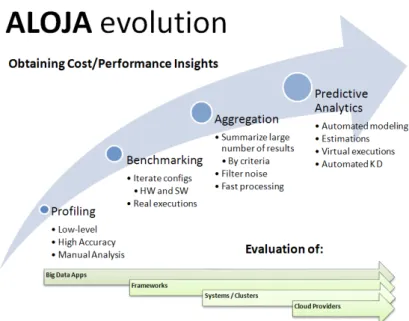
An overview of the project’s evolution summarized in Figure 1, showing the different performance extraction techniques employed in the project, as well as the expansion to extract knowledge from Big Data applications to infrastructure providers. The next section describes in detail the motivation of such change in focus and efforts; while the pros and cons of each discussed with further details in Section 3.
Fig. 1: Evolution of ALOJA: from performance profiling to PA benchmarking
2
ALOJA Evolution
During the development of the defined phases for project ALOJA [11], we have experienced a shift from an initial approach of using low-level HPC tools to profile Hadoop runtime [3] based BSC’s previous expertise to higher-level per-formance analysis. Part of the initial work included inserting hooks into the Hadoop source code to capture application events, that are later post-processed into the format of BSC’s HPC tools, which are used to analyze the performance and parallel efficiency ofsupercomputingor MPI-based workloads. However, due
to the non-deterministic nature of Hadoop distributed execution, on top of the large number of software configuration options in Hadoop, some of the HPC tools were not directly applicable for finding best configurations for a particular hardware. Furthermore, our target has not been to directly improve the Hadoop framework codebase, but its deployment scenario.
To compare configuration options, during the first months of the project we started an extensive benchmarking effort on different cluster architectures and cloud services; iterating software configurations to extract execution times that were comparable. The resulting repository of benchmarks can be found at our web site [2]. As the number of benchmarks in the repository grew, evaluating in-ternal results for each was no longer feasible, either for the low-level performance analysis tools or for manually revising them. Performance metric collection and log parsing both for profiling and benchmarking, have become Big Data problem in itself as results grow. For this reason, aggregation into summaries of the execu-tion characteristics i.e., sums and averages. In this way turning execuexecu-tion details into meta-data, which allow us to contrast different results more efficiently; at the loss of information on execution internals, but reducing processing time. To explore these results more efficiently, we then developed different Web views and filters of the aggregated executions from the repository’s online database. The analysis of results has led to a shift of focus in the project from the initial low-level profiling and Hadoop configuration, to cluster configuration and the cost/performance efficiency of the different systems.
Another reason for this change in perspective has been a shift from bench-marking on on-premise to Cloud based clusters. Current cloud offerings for Big Data provide compelling economic reasons to migrate data processing to the Cloud [12] with the pay-as-you-go or even pay-what-you-process models. While the cloud has many benefits for cluster management i.e., dynamically scaling in servers, it also introduces challenges for moving data e.g., data is no longer local to nodes and it is accessed over the network. On the Cloud, due to the virtual-ized and publicmulti-tenant nature, low-level profiling becomes less relevant, as many samples of the same execution are needed to estimate average performance and results aggregation come into play. On top of this, for Platform-as-a-Service (PaaS) offerings, you might not have superuser access to the server to install packages or profiling the system [4].
Cloud providers also offer a great number of virtual machines (VM) op-tions —at time of writing the Microsoft Azure Cloud offers over 32 different VM choices. Under this model, the same number of CPU processing cores and memory can be achieved by either having a larger number of small VMs (scale-out) or having a few larger VMs (scale-up) in a cluster. This great number of cluster configuration choices, which have an impact in the performance and the costs of executions [9, 14] has become one of the main targets of research and benchmarking efforts. Examples cloud VM size comparisons can found in our Web site [2]. These large number of Cloud topologies and services, hardware technologies, software configuration options that affect the execution time —and
costs— of the different applications, leave us with millions of possible benchmark executions in the search space.
In order to cope with the increasing number of configuration options and new systems, the project was faced with the need first to do manual sampling from the search space, and grouping of results to extrapolate results between clusters. However, this initial approach has not been sufficient either, and still requires a large number of benchmarks. For this reason, we have leveraged Ma-chine Learning (ML) techniques and implemented them as an extension of the platform. The generated prediction models allows us to estimate metrics such as job execution time for not-benchmarked configurations with great accuracy compared to classical statistical sampling and interpolation, as well as saving us time and execution costs. We are currently in the process of extending the use of such models on the platform to enable the Predictive Analytics (PA) [5, 13] to complement the descriptive analytical tools available. PA techniques also com-plement our goal of automating Knowledge Discovery (KD) from the growing benchmark repository.
Having our efforts focused in PA, does not mean that we have stopped bench-marking or low-level profiling efforts. Each of the techniques have different uses cases and can complement each other i.e., PA is based on benchmarking meta-data and profiling is used to debug or improve OS settings and configuration. An overview of the project’s evolution summarized in Figure 1, showing the different performance extraction techniques employed in the project, as well as the expan-sion to extract knowledge from Big Data applications to infrastructure providers. The next section compares each of the different performance extraction methods identified above.
3
Approaches to extract performance knowledge from
Hadoop
This section describes distinctive techniques to measure efficiency, performance, resource usage and costs employed by ALOJA.
3.1 Profiling
BSC having strong background with HPC workloads and their performance [3], the preliminary approaches to ALOJA consisted in instrumenting Hadoop, to make it compatible with well established performance tools used for parallel su-percomputing jobs e.g., for MPI and related programming models. This initial work was achieved by developing the nowHadoop Analysis Toolkit which lever-ages the Java Instrumentation Suite (JIS) [6], a tracing environment for Java application, inserting hooks into the Hadoop source code; and a network snif-fer based in libpcap. These changes allowed us to leverage the already existing low-level tools, simulators and knowhow from the HPC world, at the cost of
having to patch and recompile Hadoop code3. Network traces allow us to study in great detail e.g, up to packet-level, the communication between components; both between nodes, as well as local data transfers as Hadoop uses remote and local services to transfer data.
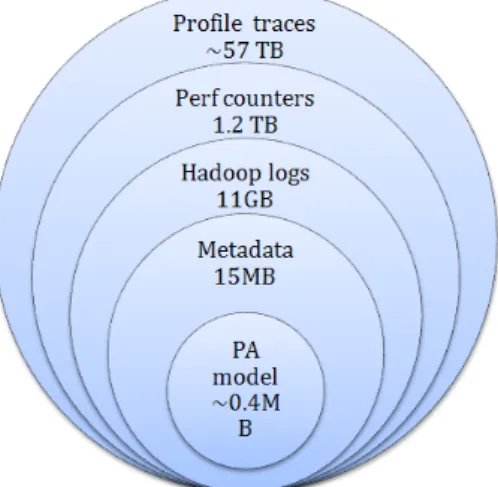
While employing the Hadoop Analysis Toolkit for profiling, we are able to understand at specifically what timeframe certain Map/Reduce (M/R) steps i.e., shuffle, sort, merge, and spill. As well as how components synchronized in the cluster during the different distributed tasks. While profiling allow us a deep understanding of the underlying execution and debugging code, the level of detail can be daunting if not with the intent of optimizing the Hadoop code, or working with drivers or accelerators. Another problem that we faced with profiling, is the large amount of data that it produces. While the overhead to produce it is not a main concern, it leaves us with a Big Data problem in itself. Figure 2 compares the amount of data that would have been produced by profiling if enabled for the 42,000 executions in the repository. We currently enable low-level profiling only on selected traces, when a particular execution requires a deep level of analysis and debugging.
Fig. 2: Comparing the data sizes produced by each strategy (chart not in scale)
3.2 Benchmarking
Due to the large number of configuration options that have an effect on Hadoop’s performance, to improve the efficiency of Hadoop requires manual, iterative and time consuming benchmarking and fine tuning over a myriad of software config-uration options. Hadoop exposes over 100, interrelated configconfig-uration parameters 3 Implementing dynamic code interposition is planned i.e., Aspect Oriented
that affect its performance, reliability and operation [7, 9]. For this reason in ALOJA we have built an automated benchmarking platform to deal with defin-ing cluster setups, server deployment, defindefin-ing benchmarkdefin-ing execution plans, orchestration of configuration, and data management of results. While the plat-form is generic for benchmarking, our use case has been Hadoop.
Hadoop’s distribution includes jobs that can be used to benchmark its perfor-mance, usually referred asmicro benchmarks, however these type of benchmarks usually have limitation on their representativeness and variety. ALOJA currently features the HiBench open-source benchmark from Intel [8], which can be more realistic and comprehensive than the supplied example jobs in Hadoop. These are considered a representative proxy for benchmarking Hadoop applications, categorized into micro-benchmark, search indexing, machine learning and ana-lytical queriestypes. We have currently gathered over 42,000 executions from the different HiBench benchmarks, that we use as base of our research to automate characterization and KD for Big Data environments.
In contrast to profiling, the benchmarking efforts operates more as black-box, where different Big Data frameworks and applications can be tested and sum-maries about their execution time and performance metrics are collected. How-ever, we do include in ALOJA specific features for Hadoop, such as log parsers to detect the different phases in the M/R process, which could be extended for other frameworks if needed. Over time, collecting performance metrics have also become a Big Data problem: we have over 1.2TB of performance metrics for the executions after importing the executions into the database. A description of the architecture in ALOJA can be found in [11]. While the data is 45x smaller than traces from profiling as can be seen in Figure 2, as we get more executions, we currently use this data mostly for debugging executions manually. While we still keep it for every execution, summarizing data via aggregation has become more useful to extract cost and performance knowledge from groups of results.
3.3 Aggregation and Summaries
After a benchmark is executed and stored, the produced folder is then imported into a relational database. This process involves uncompressing data, transform-ing formats by ustransform-ing command line tools, parstransform-ing Hadoop logs, and importtransform-ing the data into the database. This operation is a one time process, however the execution folders are kept in case they need to be reimported in the future due possible changes to the import routines or the use of external tools compatible with the logs. Once the data is on the relational database, ALOJA-WEB, the website component, interacts directly and interactively with it though SQL. This allows us very simply to use SQL group by statements on the data on different screens of the site.
As Hadoop job executions are non-deterministic, and several reasons can affect a particular execution performance i.e., multi-tenancy in the Cloud, or different random data generated by the benchmarks; all repeating executions are grouped and averaged (or other statistical functions are performed such as means or percentiles). Also, different views in ALOJA-WEB, allow to group
together executions that share some common parameters i.e., same number of datanodes, disk configuration, or number of mappers; to complement missing executions and produce a common result. While these results need to be revised and validated, i.e., mixing executions with different cluster sizes might produce incoherent results; they can quickly offer a view on the tendency for the cost-performance. An example of these tools can be found in theConfig Evaluations
and theCost/Perf Evaluationsmenus; including tools that allow to find the best configuration found with a particular filter, explore configuration parameters scalability, and rank clusters by cost-performance.
Aggregating results allows us to execute benchmarks only sampling the search space, and grouping to complement the results. Another feature is that it allows us to average noise or outlier executions automatically. While this is an im-provement to analyzing benchmark result individually, it has several drawbacks: it exposes us to the problems of averages, that might not represent a well dis-tributed value; also might lead to wrong conclusions if the grouped data is not analyzed and validated manually carefully, as mixing technologies and cluster sizes in these groups. For these reasons, and continue our goal towards automa-tion, we have started the PA extension to overcome some of these shortcomings and automate Knowledge Discovery.
3.4 Predictive Analytics
While the results from the dataaggregation efforts allows to process data inter-actively for the analytic online tools [11], the increasing number of configuration choices as the project expands in architectures and services —in the millions
for benchmarks that a single iteration can take hours to execute. In order to cope with the increasing number of configuration options the project was faced with the need first to do manual sampling from the search space, and grouping of results to extrapolate results between clusters. However, this initial approach has not been sufficient either, and still requires a large number of benchmarks. For this reason, we have leveraged Predictive Analytics (PA) techniques to be able to optimally execute a smaller number of benchmarks. PA encompasses a variety of statistical and ML techniques to make predictions of unknown events based on historical data [5, 13] —in this case the aggregated metadata of our benchmarking repository.
At this time, the ALOJA dataset has some challenging issues we have to deal with, in order to create as much representative models as possible. First of all, not all benchmarks have the same number of executions nor all the same executed configurations. Half of the ALOJA data-set examples are from tera-sort executions, while we can consider pagerank under-represented because of having much fewer executions. Executions use resources and time (thus they cost money), and the examples composing the data-set were executed following different reasons than to obtain a homogeneously representation of every bench-mark and feature. One of the goals of ALOJA-ML is to be able to infer models from a not-so-regular data-set. In addition, the data-set contains failed or outlier executions, where external factors heavily affected the final execution time of the
run. Some of those examples can be easily detected and removed, while others can not. Further, having a huge space of feature combinations, compared to the number of examples, can bring uncertainty when deciding if an example is an outlier or is a legitimate example lonely in its space region. At this time we will use the data-set without filtering, as a first approach to it without massaging
our data.
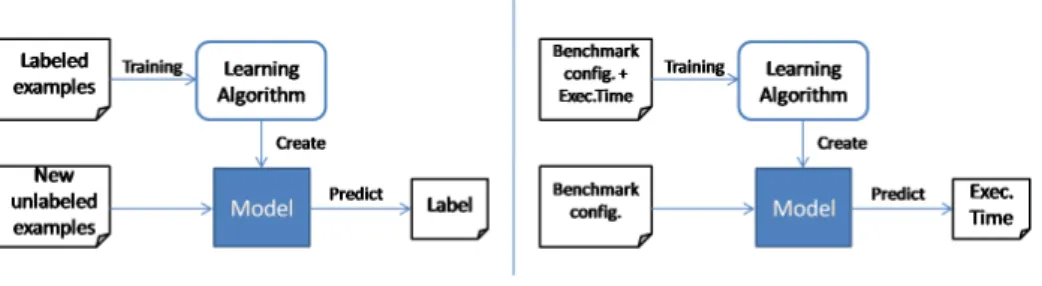
Modeling Benchmark Behaviors To model a system some examples of this system are collected, this is what we want to be able to predict from this system, and any element that can determine or affect it. The model is then a function that receives as inputs variables like in our case the benchmark name, the introduced Hadoop configuration and the hardware specifications, and produces as output the required execution time for the benchmark in such conditions. Then from the collected set of examples, the data-set, machine learning algorithms attempt to infer an explanation for these outputs from the provided inputs
Our current main focus is to obtain a model to predict benchmark execution times from a given software and hardware configurations, in the more automatic possible way. As previously said, Hadoop executions can be tuned through soft-ware configurations (number of mapping agents, type of compression used, etc.) and through the provided hardware resources. These tuning parameters deter-mine the resulting execution, and we consider them our input variables. Also, as we focus on the resulting execution time, we consider that as out output vari-able we want to be vari-able to predict. Being vari-able to predict such values will let us to plan benchmark executions, compare different environments without even executing such benchmarks, also plan new data-centers by deciding their com-ponents from a variety of available hardware configurations while predicting the execution time of reference benchmarks with each of them. Figure 3 summarizes the machine learning schema, also applied to our case of study.
4
Modeling Behaviors
4.1 Learning Models
Having different benchmarks available, and willing to cover with one model as much space of configuration possibilities as possible, raises our first concern, that is to check if they are comparable and in which degree, in order to model all of them in a generalist model. Each benchmark has different characteristics that led to different behaviors (CPU bound workloads, IO bound workloads, etc.). One could hope that training a model with samples of different benchmark executions, when including the identifier of each benchmark, the model would recognize this as an important feature and return different sub-models for each group of behave-alike benchmarks. One of the studies done is to check whether training a model with all the benchmarks produce an acceptable model against creating a model for each specific benchmark. In one hand, a generalist model requires one single training process, benchmarks with many examples in the data-set can complement other behave-alike ones with less examples. On the other hand, a specific model can fit better a benchmark, being aware of not over-fitting, but it requires enough examples of each one, and for each benchmark it requires a new training process.
For a first learning attempt, we selected as a machine learning algorithm the M5P, which creates a regression tree model [22, 23]. Learning is done by using a random split of 50% of the available data-set, 25% used to validate the parameters of the obtained model, and 25% kept for testing only. The selected variables input for the following experiments are benchmark, network, storage type, number of maps, block size, cloud provider + kind of deployment, sort factor,file buffer size, alsoexecution time as output variable.
After learning models on each of the 8 tested benchmarks, we obtain different results for each one. Benchmarks likebayes,kmeans,sort,terasortandwordcount
reach Relative Absolute Errors (RAE) between 0.11 to 0.23 during the testing process. This is that we can predict execution times of new executions with an expected bias between 11 and 23 percent. In the other hand, the pagerank
benchmark has shown unstable executions, and for some executions their exe-cution time in extremely high, making difficult to learn and predict (obtaining an unacceptable RAE of 1.18 in testing). The lighter side of this is that, from this process, we detected that such executions deserve a human review to see whetherpagerankis actually unstable or something unexpected happened on our system when running some Hadoop jobs. Finally we observe how benchmarks
dfsioe read anddfsioe write have high variance on their execution times, and in both training/validation and testing errors are high enough to re-think how to deal with them (RAE between 0.38 and 0.44 in testing). The fact that shared resources like disks are heavily involved in such benchmarks can produce this variance, so in the future modeling them should include variables representing the shared usage of such resources.
Once seen that most of the benchmarks can be modeled automatically with a tolerable error, we proceed to create a generalist model for the complete set.
We had hope that the generalist model would do worse but not much than the specific ones. We obtain RAEs for all our benchmarks around 0.44 on train-ing/validation and test, modeling all 8 benchmarks together also using all but the dfsioes and pagerank just to check whether the high error was caused by the hard-to-model benchmarks. This brings us to the conclusion that we should attempt to create separated models per benchmark, but it would be interest-ing to model any workload despite being benchmarks or not. A general model would help us to introduce a new workload, represented by any of the mod-eled benchmarks, and predict its execution time. Our future approaches focus on work-around the problem of being unable to generalize, by parametrizing benchmarks so any benchmark (even any properly parametrized workload) can be go through the same model, and trying to find the causes that make some benchmarks harder to predict or find proper new input variables that define better those benchmarks.
4.2 Representing Characteristics
Far away from just model benchmarks to do predictive analysis, we can use the obtained models to discover how each input affects the output variable. Instead of producing more executions or rely on the example executions we complete, for each configuration not tested (or even tested), the space of possible configurations with each expected execution time. For practical reasons we do this given a reduced set of input variables we can consider relevant, fixing the rest of inputs to a given value. Note that using all inputs could lead to millions of predictions, hence we select the inputs we consider more interesting to explore. With the resulting predictions we can rank each configuration from slower to faster, and observe how changing variables affect the result.
For this we use a greedy algorithm that separates the ranked configurations in a dichotomous way (Algorithm 1), finding which variables produce the biggest changes on execution time, recursively. E.g. after determining which variable separates better the slow configurations from the faster ones, the algorithm fixes this variable and repeats for each of its distinct values.
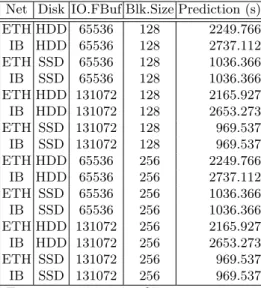
As an example, depicted in Figure 4, we select an on-premise cluster formed by 3 data-nodes with 12 cores per VM and 128GB RAM, and we want to observe the relevance of variables disk (local SSD and HDD),network (Infiniband and Ethernet), IO file buffer (64KB and 128KB) and block size (128, 256) for the benchmark terasort, fixing then the other variables (maps = 4, sort factor = 10, no compression and 1 replica). We train a model for this benchmark and predict all the configurations available for the given scenario. Then, using the dichotomousLeast Splits algorithm we get the tree of relevant variables.
The example shown in Figure 4 is just one of all the explorations that the ALOJA-ML tool can realize using learned models. E.g., in this example we observe that the variable that defines a division between slower and faster exe-cutions is the type of storage units, and then for SSDs only the File Buffer seems relevant, while for HDDs the type of network is the second important variable, then File Buffers and Block Sizes.
Algorithm 1 Least Splits Algorithm
1: functionLeast.Splits(e) . eset ofhconf, prediordered bypred 2: if |e|>1then
3: bv←null;lc← ∞
4: fori∈variables(e)do .Search variable with less changes
5: c←0 6: forj∈[2,|e|]do 7: if e[i, j]6=e[i, j−1]then 8: c←c+ 1 9: end if 10: end for 11: if c < lcthen 12: hbv, lci ← hi, ci .Variableiis candidate 13: end if 14: end for 15: t←empty tree()
16: forv∈values of(e[bv])do .Split set by the selected variable 17: sse←subset(e, bv=v)
18: branch(t,”bv=v”)←Least.Splits(sse) .Redo for each split 19: end for
20: returnt .Return sub tree for selected variable 21: else
22: returnprediction(e) .Return prediction value at leaf level 23: end if
24: end function
As just said, this is an example of what we can experiment and obtain with automatic benchmark modeling using machine learning. This tool and its data-sets are open to the community at http://hadoop.bsc.es, also the complete framework can be downloaded and deployed locally at https://github.com/ Aloja/alojafor everyone to work with their own data.
5
Conclusions
This article delineated the evolution of ALOJA’s focus approach over the last two years to automatically characterize Hadoop deployments and gather performance insights that can improve the execution of current clusters, as well as we aim to influence the design of new cost-effective, data processing infrastructures. On our path from low-level profiling to Predictive Analytics (PA) —our current frontier, we have found specific use cases for the tested performance extraction techniques; as well as finding the data sizes of the different techniques.
Our results show that detailed performance counter collection accounts for over 99% of the data produced, while summaries from the already give the most value to rapidly obtaining cost and performance insights from the data. Aggre-gated summaries and also allow us to use PA techniques with more ease, and the first results looks promising to speed up and reduce costs of the
benchmark-Net Disk IO.FBuf Blk.Size Prediction (s) ETH HDD 65536 128 2249.766 IB HDD 65536 128 2737.112 ETH SSD 65536 128 1036.366 IB SSD 65536 128 1036.366 ETH HDD 131072 128 2165.927 IB HDD 131072 128 2653.273 ETH SSD 131072 128 969.537 IB SSD 131072 128 969.537 ETH HDD 65536 256 2249.766 IB HDD 65536 256 2737.112 ETH SSD 65536 256 1036.366 IB SSD 65536 256 1036.366 ETH HDD 131072 256 2165.927 IB HDD 131072 256 2653.273 ETH SSD 131072 256 969.537 IB SSD 131072 256 969.537 Terasort, 4 maps, sort factor 10, no comp
Disk=SSD IO.FBuf=131072 -> 970s IO.FBuf=65536 -> 1036s Disk=HDD Net=ETH IO.FBuf=131072 -> 2166s IO.FBuf=65536 -> 2250s Net=IB IO.FBuf=131072 Blk.size=128 -> 2653s Blk.size=256 -> 2653s IO.FBuf=65536 Blk.size=128 -> 2737s Blk.size=256 -> 2737s
Fig. 4: Example of estimation of the selected space of search, with the corre-sponding descriptive tree
ing efforts as well to automate. In this case of study we showed how we can model easily separate benchmarks, but the aim is to achieve in the next future a general model that include all benchmarks by studying ways to parametrize those and being able to compare (and then discriminate) them. Also we showed, from our machine learning tool in ALOJA project, a quick algorithm to display how variables affect Hadoop benchmarks execution time, based in the learned models.
Our project is now focused on study how to treat benchmarks and clusters in general models, finding methods to characterize them towards the challenge of learning general models with more proper accuracy. At the same time supporting ALOJA’s goal of automating Knowledge Discovery (KD) and recommendations to users.
We also will like to invite fellow researchers and Big Data practitioners to use on our open source tools to expand on the available analytic tools and public benchmark repository.
Acknowledgements
This work is partially supported the BSC-Microsoft Research Centre, the Span-ish Ministry of Education (TIN2012-34557), the MINECO Severo Ochoa Re-search program (SEV-2011-0067) and the Generalitat de Catalunya (2014-SGR-1051).
References
[1] D. Borthakur. The Hadoop Distributed File System: Architecture and De-sign.
http://hadoop.apache.org/docs/r0.18.0/hdfs design.pdf. The Apache Soft-ware Foundation, 2007.
[2] BSC. Aloja home page: http://aloja.bsc.es/, 2015.
[3] BSC. Performance tools research group page: http://www.bsc.es/computer-sciences/performance-tools, 2015.
[4] BSC. Administrator privileges on headnode of hdinsight-cluster: http://www.postseek.com/meta/bd1cddf3af9c7ce35d147e842a686410, May, 2015.
[5] Gartner. Predictive analytics: http://www.gartner.com/it-glossary/predictive-analytics, May, 2015.
[6] J. Guitart, J. Torres, E. Ayguad, J. Oliver, and J. Labarta. Java instrumen-tation suite: Accurate analysis of java threaded applications. In Proceedings of the second annual workshop on Java for HPC, ICS00, pages 15–25, 2000. [7] D. Heger. Hadoop Performance Tuning - A pragmatic & iterative approach.
DH Technologies, 2013.
[8] S. Huang, J. Huang, J. Dai, T. Xie, and B. Huang. The HiBench bench-mark suite: Characterization of the MapReduce-based data analysis. Data Engineering Workshops, 22nd International Conference on, 0:41–51, 2010. [9] K. Kambatla, A. Pathak, and H. Pucha. Towards optimizing hadoop
provi-sioning in the cloud. InProceedings of the 2009 Conference on Hot Topics in Cloud Computing, HotCloud’09, Berkeley, CA, USA, 2009. USENIX As-sociation.
[10] L. Person. Global Hadoop Market. Allied market research, March 2014. [11] N. Poggi, D. Carrera, A. Call, S. Mendoza, Y. Becerra, J. Torres,
E. Ayguad´e, F. Gagliardi, J. Labarta, R. Reinauer, N. Vujic, D. Green, and J. Blakeley. ALOJA: A systematic study of hadoop deployment variables to enable automated characterization of cost-effectiveness. In 2014 IEEE Intl. Conf. on Big Data, Big Data 2014, Washington, DC, USA, October 27-30, 2014, pages 905–913, 2014.
[12] B. Schwartz, P. Zaitsev, and V. Tkachenko. High Performance MySQL. O’Reilly media, 2012.
[13] Wikipedia. Predictive analytics: http://en.wikipedia.org/wiki/predictive analytics, May, 2015.
[14] Z. Zhang, L. Cherkasova, and B. T. Loo. Optimizing cost and performance trade-offs for mapreduce job processing in the cloud. InNetwork Operations and Management Symposium (NOMS), 2014 IEEE, pages 1–8. IEEE, 2014. [15] Apache Foundation. Apache Hadoop. http://hadoop.apache.org
(Ac-cessed April 2015).
[16] J. Ll. Berral. Improved Management of Data-Center Systems using Machine Learning. Ph.D. Thesis on Computer Science. November 2013.
[17] D. Heger. Hadoop Performance Tuning - A pragmatic & iterative approach. DH Technologies, 2013.
[18] D. Heger. Hadoop Performance Tuning. https://hadoop-toolkit. googlecode.com/files/Whitepaper-HadoopPerformanceTuning.pdf
(Accessed Jan 2015).
[19] Intel Corporation. Intel HiBench, Hadoop benchmark suite. https:// github.com/intel-hadoop/HiBench(Accessed April 2015).
[20] L. Person. Global Hadoop Market. Allied market research, March 2014. [21] N. Poggi, D. Carrera, A. Call, S. Mendoza, Y. Becerra, J. Torres, E.
Ayguad´e, F. Gagliardi, J. Labarta, R. Reinauer, N. Vujic, D. Green, and J. Blakeley. ALOJA: A systematic study of hadoop deployment variables to enable automated characterization of cost-effectiveness. In 2014 IEEE Intl. Conf. on Big Data, Big Data 2014, Washington, DC, USA, October 27-30, 2014, pages 905-913, 2014.
[22] Ross J. Quinlan. Learning with Continuous Classes. 5th Australian Joint Conference on Artificial Intelligence, Singapore, 343-348, 1992.
[23] Y. Wang, I. H. Witten. Induction of model trees for predicting continuous classes. Poster papers of the 9th European Conference on Machine Learning, 1997.