This is a repository copy of
Automated grade classification of oral epithelial dysplasia
using morphometric analysis of histology images
.
White Rose Research Online URL for this paper:
http://eprints.whiterose.ac.uk/158817/
Version: Published Version
Proceedings Paper:
Saad Bashir, R.M., Mahmood, H. orcid.org/0000-0001-7159-0368, Shaban, M. et al. (4
more authors) (2020) Automated grade classification of oral epithelial dysplasia using
morphometric analysis of histology images. In: Hahn, H.K. and Mazurowski, M.A., (eds.)
Medical Imaging 2020: Digital Pathology. Medical Imaging 2020: Digital Pathology, 15-20
Feb 2020, Houston, Tx, United States. SPIE Medical Imaging (11320). Society of Photo
Optical Instrumentation Engineers (SPIE) . ISBN 9781510634077
https://doi.org/10.1117/12.2549705
Copyright 2020 Society of Photo Optical Instrumentation Engineers (SPIE). One print or
electronic copy may be made for personal use only. Systematic reproduction and
distribution, duplication of any material in this publication for a fee or for commercial
purposes, or modification of the contents of the publication are prohibited.
[email protected] https://eprints.whiterose.ac.uk/
Reuse
Items deposited in White Rose Research Online are protected by copyright, with all rights reserved unless indicated otherwise. They may be downloaded and/or printed for private study, or other acts as permitted by national copyright laws. The publisher or other rights holders may allow further reproduction and re-use of the full text version. This is indicated by the licence information on the White Rose Research Online record for the item.
Takedown
If you consider content in White Rose Research Online to be in breach of UK law, please notify us by
PROCEEDINGS OF SPIE
SPIEDigitalLibrary.org/conference-proceedings-of-spie
Automated grade classification of oral
epithelial dysplasia using
morphometric analysis of histology
images
Saad Bashir, R., Mahmood, Hanya, Shaban, Muhammad,
Ahmed Raza, Shan, Fraz, M. Moazam, et al.
R. M. Saad Bashir, Hanya Mahmood, Muhammad Shaban, Shan E. Ahmed
Raza, M. Moazam Fraz, Syed Ali Khurram, Nasir M. Rajpoot, "Automated
grade classification of oral epithelial dysplasia using morphometric analysis of
histology images," Proc. SPIE 11320, Medical Imaging 2020: Digital
Pathology, 1132011 (16 March 2020); doi: 10.1117/12.2549705
Event: SPIE Medical Imaging, 2020, Houston, Texas, United States
Automated Grade Classification of Oral Epithelial Dysplasia
using Morphometric Analysis of Histology Images
R. M. Saad Bashir
a, Hanya Mahmood
b, Muhammad Shaban
a, Shan E Ahmed Raza
a, M.
Moazam Fraz
c, Syed Ali Khurram
a, and Nasir M. Rajpoot
a aDepartment of Computer Science, University of Warwick, Coventry ,United Kingdom
b
School of Clinical Dentistry, University of Sheffield, Sheffield, United Kingdom
c
School of Electrical Engineering and Computer Science, National University of Sciences and
Technology, Islamabad, Pakistan
ABSTRACT
Oral dysplasia is a pre-malignant stage of oral epithelial carcinomas, e.g., oral squamous cell carcinoma, where significant changes in tissue layers and cells can be observed under the microscope. However, malignancy can be reverted or cured using proper medication or surgery if the grade of malignancy is assessed properly. The assessment of correct grade is therefore critical in patient management as it can change the treatment decisions and prognosis for the dysplastic lesion. This assessment is highly challenging due to considerable inter- and intra-observer variability in pathologists’ agreement, which highlights the need for an automated grading system that can predict more accurate and reliable grade. Recent advancements have made it possible for digital pathology (DP) and artificial intelligence (AI) to join forces from the digitization of tissue slides into images and using those images to train and predict more accurate grades using complex AI models. In this regard, we propose a novel morphometric approach exploiting the architectural features in dysplastic lesions i.e., irregular epithelial stratification where we measure the widths of different layers of the epithelium from the boundary layer i.e., keratin projecting inwards to the epithelium and basal layers to the rest of the tissue section from a clinically significant viewpoint.
Keywords: oral epithelial dysplasia, oral cancer, dysplasia grading, epithelial stratification, tissue morphometric analysis, computational pathology, machine/deep learning
1. INTRODUCTION
The word ’dysplasia’ is a combination of the ancient gtreek words ’dys’ meaning ’bad’ and ’plasis’ meaning ’for-mation’. In medical terms, it is used to define the pre-malignant or pre-cancerous stage of epithelial malignancies e.g., in case of oral squamous cell carcinoma (OSCC) it is referred to as oral epithelial dysplasia and is caused by a multitude of genetic and environmental factors leading to the proliferation of atypical epithelium. Lesions in the oral cavity exhibiting dysplasia are much more likely to transform into OSCC than non-dysplastic lesions.1
These lesions are diagnosed and graded on the basis of architectural abnormalities i.e., (irregular epithelial strat-ification, loss of polarity of basal cells, drop-shaped rete ridges, abnormally superficial mitosis, increased number of mitotic figures, keratin pearls within rete pegs, premature keratinization of single cells) and cytological irreg-ularities i.e., (abnormal variation in nuclear size (anisonucleosis), abnormal variation in nuclear shape (nuclear pleomorphism), abnormal variation in cell size (anisocytosis), abnormal variation in cell shape (cellular pleomor-phism), increased nuclear-cytoplasmic ratio, increased nuclear size, atypical mitotic figures, increased number and size of nucleoli). They are further categorized into four different categories includinghyperplasia, mild,
moderate, severe and carcinoma-in-situ2 based on the number (and intra-epithelial location) of features
seen in a lesion. Unfortunately, assessment of these grades is extremely subjective with significant inter- and intra-observer disagreements highlighting the need for novel and objective approaches.3,4 Correct grading is of
significant clinical importance as it informs patient management and treatment decisions such as observation or surgical removal before the lesion progresses to a carcinoma.
Further author information: (Send correspondence to R. M. Saad Bashir) R. M. Saad Bashir: E-mail: [email protected]
Medical Imaging 2020: Digital Pathology, edited by John E. Tomaszewski, Aaron D. Ward, Proc. of SPIE Vol. 11320, 1132011 © 2020 SPIE
CCC code: 1605-7422/20/$21 doi: 10.1117/12.2549705 Proc. of SPIE Vol. 11320 1132011-1
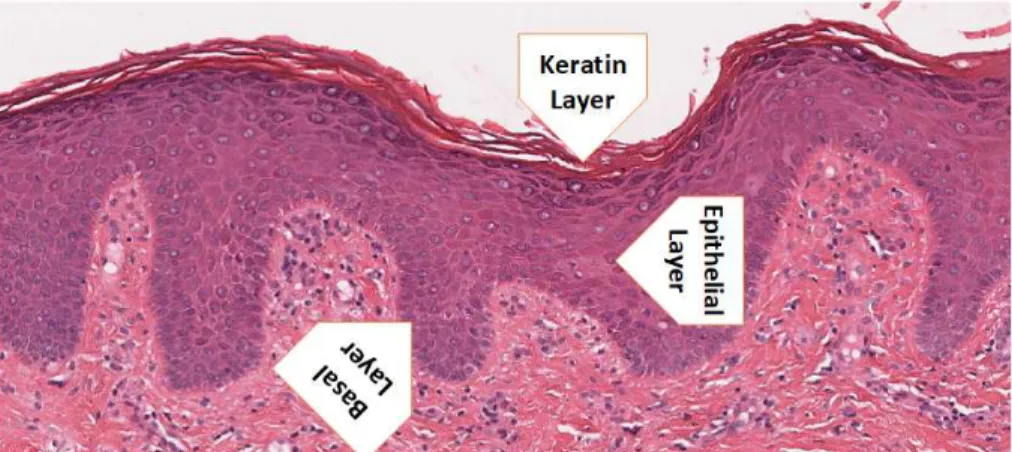
Figure 1. A patch of WSI showing layers of the oral epithelium. Top/most superficial layer- keratin layer, middle- epithelial layer and bottom- basal layer with underlying connective tissue
The advancements in digital pathology and artificial intelligence have allowed tissue slides to be digitized into multi giga-pixel whole slide images (WSI) using digital scanners. These WSI’s can then be used for different tasks among which automated grade prediction for cancers and pre-cancer has gained significant popularity and clinical importance for both pathologists and surgeons as a result of rapidly obtaining reliable, objective and accurate results from a large number of WSI making the process much more efficient and consistent. These breakthroughs have the potential to automate the histopathological diagnosis by aiding manual and laborious task of pathologists using artificial intelligence significantly improving efficiency.
Considering the significant subjectivity involved in grading of oral epithelial dysplasia (OED), we have pro-posed a novel morphometric approach coupled with machine learning algorithms exploiting irregular epithelial stratification for automated grade prediction. The oral epithelium has three layers i.e., keratin- the outer most (superficial) layer, epithelium- the middle layer and basal layer at the bottom as seen in 1. One of the archi-tectural feature aforementioned isirregular stratification of the epithelium where normal and organised layered architecture of the oral epithelium is disturbed resulting in a change of thickness of the different layers as well as their relationship. In order to measure this factor, morphometrical approach was used to analyse the layers and quantified from a clinically significant viewpoint projection for more appropriate and accurate quan-tification of the epithelial straquan-tification. The projection starts from the superficial layer travelling inwards to the middle and basal layers of the epithelium which is then used to train a supervised machine learning algorithms for grade prediction. The cohort used for this purpose contains 35 WSI scanned at 20× magnification power and manually labelled for layers and grades by an expert oral and maxillofacial pathologist (SAK), the cohort contains cases for mild, moderate and severe dysplasia in addition to few cases of normal oral epithelium.
2. METHODOLOGY
The proposed morphometric approach is focused on exploiting an architectural abnormality i.e., epithelial strat-ification for an automatic grade classstrat-ification of oral epithelial dysplasia. In this regard, we have devised a pipeline where the input image goes through a number of steps including image segmentation, morphometric analysis of segmented layers and finally training a machine learning algorithm.
2.1 Image Segmentation
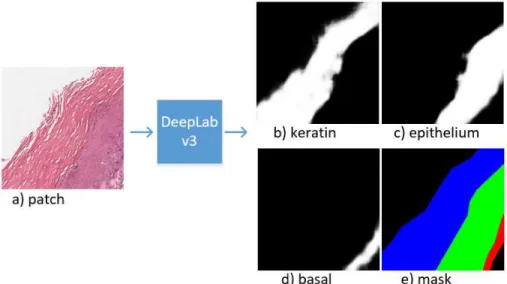
Layer segmentation is the first step towards quantifying the epithelial stratification and for this purpose, we have used the standard DeepLab-v35 and trained on the WSI patches of OED. The size of the patches was set to
224×224×3 at 10×magnification power, the batch size was set to 4 and the network was trained for 30 epochs using Adam optimizer with the learning rate of 0.0001. The training set comprises 30 WSI (including normal cases) and the validation set comprises of 5 dysplasia WSI from the cohort and the model after training gave the validation accuracy for keratin: 0.95, epithelium: 0.82 and basal: 0.93 using the binary cross-entropy for each layer in the loss function and the results are shown in the Fig. 2
Figure 2. The prediction of the network (i.e., DeepLab v3)a) on input patch extracted from the tissue section of WSI and b, c, d) the prediction of layers into keratin, epithelium and basal separately. e) shows combined result of the three layers of the input patch when the layers segmentation is merged
2.2 Morphometric Analysis of Layers
After segmenting all three layers, the primary task is to find optimal method of measuring the abnormality. For this purpose, we have proposed a novel approach that measures the widths of different epithelial layers which can potentially help in grading. The outer layer i.e., keratin has been used as a starting point and lines drawn from the top boundary of wavy keratin surface layer going downwards at different intervals into the tissue section at clinically significant view angle projection i.e., 90 degrees for measuring the widths of the three layers as seen in Fig. 3. For this purpose, we have used the boundary points of the keratin layer followed by employing the
two-point slope formula for finding the slope of the boundary line. For the clinically significant line which is incident on the above line at exactly 90 degrees, we can use the relationship of the slopes for the perpendicular lines which is m1m2=−1 wherem1 is the slope of the first line and can be used to find them2. After finding
the slopes of the lines, theslope intercept form is used to find the intercept for both of the lines to localize the lines well. In order to measure the widths of the layers, the summation of the intersecting points in each layer is calculated as shown in equation1.
Wk = 3 X k=1 m,n X x,y=0 (L2(x,y)∩LMk(x,y)) (1)
whereWk contains the widths of the layers andk∈ {1 :keratin,2 :epithelium,3 :basal}is the total number
of layers, m, nis the width and height of the image patch, L2 is the line drawn perpendicular to the clinically
significant angle from the boundary and LM is the layer mask for that patch. Similarly, at different intervals, the lines are drawn and widths are measured. For determining the grades associated with each line, grade masks are used and on the basis of more pixels interacting with grade masks the max grade is assigned to the line as shown in equation2. Gl= argmax l∈{0,1,2} ( m,n X x,y=0 (L2(x,y)∩GMl(x,y)) (2)
where the Gl contains the grades for the lines and l ∈ {0 : M ild,1 : M oderate,2 :Severe}, with GM as
grade masks. Finally, the Wk∪Gl is the extracted data from the WSI and its respective layer and grade masks
which is later used for training.
Proc. of SPIE Vol. 11320 1132011-3
Figure 3. The figure depicts the process of measuring the widths of layers using the line drawn at 90 degree to the boundary points of the keratin and used to measure the widths asW Kfor the width of keratin,W Efor the width of epithelium andW Bfor the width of basal measure using the mrophometric analysis.
2.3 Training
Before training random forest, extracted data is subject to pre-processing and feature engineering i.e., the extracted features are normalized by subtracting mean and scaling to unit variance using this equation z = (x−µ)/σ. Along with the normalization, feature engineering is also preformed for some new statistical features on top of the real features based on the ratio of basal layer width with the keratin and epithelial layers as shown in shown in Table1. Random forest6 algorithm is used for classification purposes with the number of trees =
100 in all the experiments and random seed = 42 in order to keep the results consistent and repeatable. Apart from random forest, logistic regression and multi layer perceptron has also been used for experimentation but both of them showed biasness towards the Moderate and Severe cases.
Table 1. Features used for the training purposes
Feature Description
W K width of the keratin layer
W E width of the epithelial layer
W B width of the basal layer
W B/W K ratio of the basal/keratin layer
W B/W E ratio of the basal/epithelial layer
3. RESULTS
3.1 Experiments
To validate the proposed approach we divided the problem into two settings/classifications for grade prediction problems 1) 3-class classification, 2-class classification. In the former approach the classes were (mild, moderate
and severe while in the later case, moderate and severe were merged into high risk whereas mild was considered as low risk. Standard matrices7were used for the evaluation purposes i.e., precision (3) ,recall (2), accuracy and
F1 score for both of the settings i.e., 3-class and 2-class classification..
Precisioni= Mii P jMji (3) Recalli = Mii P jMij (4)
where Mii represents the current class predictions, and Mji is the prediction where all other classes are
declared as iinj, similarly theMij is the prediction of j in classi.
3.2 Data
35 whole slide images were collected from the Sheffield hospital for oral dysplasia using Aperio scanner at 20×
stained with Hematoxylin and Eosin (H&E). These cases have been manually annotated in Automated Slide Analysis Platform (ASAP) annotation tool by an expert pathologist for layers (i.e., keratin, epithelial and basal) and grades (i.e., mild, moderate and severe) annotations for both of the 3 and 2-class classification. The data is spit into 85% training and 15% test set for both segmentation and grade prediction and the split is strong validation i.e., no instance of the test cases is being used for training.
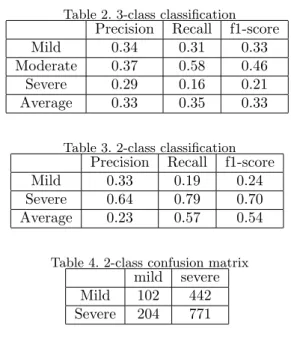
Table 2. 3-class classification
Precision Recall f1-score Mild 0.34 0.31 0.33 Moderate 0.37 0.58 0.46 Severe 0.29 0.16 0.21 Average 0.33 0.35 0.33
Table 3. 2-class classification
Precision Recall f1-score Mild 0.33 0.19 0.24 Severe 0.64 0.79 0.70 Average 0.23 0.57 0.54
Table 4. 2-class confusion matrix
mild severe Mild 102 442 Severe 204 771
3.3 Results
In the 3-class classification setting, the proposed method achieved an accuracy of 35% whereas, in 2-class clas-sification, the accuracy is 57.5% which is higher than the 3-class classification because it is relatively easy to differentiate. Table2 presents classification report of the 3-class classification model using the above-mentioned matrices while Table3presents the classification report of the 2-class classification model and Table4is confusion matrix which shows that the model is predicting most of the cases as severe due to class imbalance being tilted towards severe i.e., Moderate + Severe.
Proc. of SPIE Vol. 11320 1132011-5
4. DISCUSSION AND SUMMARY
In this work we have shown that the architectural abnormality e.g. irregular stratification of the epithelium can be used to train a machine learning model for predicting the grade of dysplasia. As, the basal layer would progress into the epithelium in severe grade which can be learned by the model being trained. The proposed morphometric approach was used to exploit the clinical significant view angle projection from the boundary of keratin to inner layers measuring the widths of the layers in different stages of dysplasia. In this study, to test our approach we have used strong validation rather than using the cross validation and weak validation because of the data distribution between the grades and keeping the test set as complete out of sample from training set. However, we have seen that the binary classification has higher accuracy than the multi-class classification where it’s hard to differentiate between the three layers. Moreover, it can be seen that this single marker didn’t do well as the model is biased towards predicting severe grade more than the mild grade in binary classification which will result in over-treatment. However, when classifying the grades in real world scenarios pathologists rely on using more than one features to decide the grade i.e., for severe grade more than 4 architectural and cytological features are required.
In future, we plan to incorporate other architectural and cytological features e.g., drop-shaped rete pegs, mitosis, polarity of nuclei in basal layer along with high-level deep features from neural networks to improve overall accuracy and reliability of the automated grading system and compare them with the human experts using the kappa score.
REFERENCES
[1] Wright, A. and Shear, M., “Epithelial dysplasia immediately adjacent to oral squamous cell carcinomas,”
Journal of Oral Pathology & Medicine14(7), 559–564 (1985).
[2] Barnes, L., Pathologie, U.-S. Z. D., Eveson, J., of Pathology, I. A., Organization, W. H., Sidransky, D., Reichart, P., and for Research on Cancer, I. A., [Pathology and Genetics of Head and Neck Tumours], IARC WHO Classification of Tumours, No 9, IARC Press (2005).
[3] Speight, P. M., Khurram, S. A., and Kujan, O., “Oral potentially malignant disorders: risk of progression to malignancy,”Oral Surgery, Oral Medicine, Oral Pathology and Oral Radiology 125, 612–627 (Jun 2018). [4] Kujan, O., Khattab, A., Oliver, R. J., Roberts, S. A., Thakker, N., and Sloan, P., “Why oral histopathology
suffers inter-observer variability on grading oral epithelial dysplasia: An attempt to understand the sources of variation,”Oral Oncology43(3), 224 – 231 (2007).
[5] Chen, L., Papandreou, G., Schroff, F., and Adam, H., “Rethinking atrous convolution for semantic image segmentation,”CoRRabs/1706.05587 (2017).
[6] Breiman, L., “Random forests,”Mach. Learn.45, 5–32 (Oct. 2001).
[7] Sokolova, M. and Lapalme, G., “A systematic analysis of performance measures for classification tasks,”