JHEP07(2015)162
Published for SISSA by SpringerReceived: June 22, 2015 Accepted: July 5, 2015 Published: July 29, 2015
Search for heavy Majorana neutrinos with the ATLAS
detector in
pp
collisions at
√
s
= 8
TeV
The ATLAS collaboration
E-mail:
atlas.publications@cern.ch
Abstract:
A search for heavy Majorana neutrinos in events containing a pair of high-
p
Tleptons of the same charge and high-
p
Tjets is presented. The search uses 20.3 fb
−1of
pp
collision data collected with the ATLAS detector at the CERN Large Hadron Collider
with a centre-of-mass energy of
√
s
= 8 TeV. The data are found to be consistent with the
background-only hypothesis based on the Standard Model expectation. In the context of
a Type-I seesaw mechanism, limits are set on the production cross-section times branching
ratio for production of heavy Majorana neutrinos in the mass range between 100 and
500 GeV. The limits are subsequently interpreted as limits on the mixing between the
heavy Majorana neutrinos and the Standard Model neutrinos. In the context of a left-right
symmetric model, limits on the production cross-section times branching ratio are set with
respect to the masses of heavy Majorana neutrinos and heavy gauge bosons
W
Rand
Z
0.
Keywords:
Hadron-Hadron Scattering
JHEP07(2015)162
Contents
1
Introduction
1
2
The ATLAS detector
4
3
Background and signal simulation
4
4
Data sample and event selection
6
4.1
Object reconstruction and selection
6
4.2
Lepton isolation criteria
7
4.3
General event selection
7
4.4
Selection criteria for mTISM signal events
8
4.5
Selection criteria for LRSM
W
Rand
Z
0signal events
9
5
Background estimation
9
5.1
Background from prompt same-sign leptons
10
5.2
Background from prompt opposite-sign leptons
10
5.3
Background from fake and non-prompt leptons
11
5.4
Validation of background estimates
12
6
Systematic uncertainties
14
6.1
Background uncertainties
14
6.2
Uncertainties on MC simulation
16
6.3
Signal-specific modelling uncertainties
17
7
Results
17
7.1
Results in the mTISM signal region
17
7.2
Results in the LRSM signal region
19
8
Conclusions
20
The ATLAS collaboration
28
1
Introduction
JHEP07(2015)162
qa¯ qb
(W±)∗
W∓
N
l± α
l±β
qc
[image:3.595.160.419.89.246.2]¯ qd
Figure 1. The tree-level diagram for the production of a heavy Majorana neutrino (N) in the
mTISM model. Lepton flavour is denoted byαandβ. Lepton flavour is assumed to be conserved,
such that α=β. The W boson produced from the N decay is on-shell and, in this case, decays
hadronically.
would imply the existence of yet unobserved heavy Majorana neutrino states. The nature
of Majorana neutrinos would explicitly allow for lepton number violation.
In this paper, a search is presented for heavy Majorana neutrinos using the ATLAS
detector at the Large Hadron Collider (LHC). The data sample was collected in 2012
during
√
s
= 8 TeV
pp
collisions and corresponds to an integrated luminosity of 20
.
3 fb
−1.
Heavy Majorana neutrinos with masses above 50 GeV are considered. In this regime, the
production and subsequent decay of heavy Majorana neutrinos could lead to a final state
containing exactly two charged leptons, where the leptons may have the same or opposite
charge in equal fractions of the heavy neutrino decays. Only lepton pairs of the same
charge (same-sign) are considered as there is a smaller expected SM background for pairs
of same-sign leptons than for pairs of leptons of opposite charge (opposite-sign). The search
includes the
ee
and
µµ
final states.
The search is guided by two theoretical models. In the first model, the SM is extended
in the simplest way to include right-handed neutrinos [
8
], such that light neutrino masses
are generated by a Type-I seesaw mechanism or by radiative corrections [
9
]. In this minimal
Type-I seesaw mechanism (mTISM), the heavy Majorana neutrinos,
N
, can be produced
via an off-shell
W
boson,
pp
→
(
W
±)
∗→
`
±N
. Due to previous limits [
10
,
11
], the heavy
neutrino is assumed to be more massive than the
W
boson and therefore subsequently
decays to an on-shell
W
boson and a lepton. The on-shell
W
boson produced in the
decay of the heavy neutrino predominantly decays into a quark-antiquark (
q
q
¯
) pair. The
final state in this case contains two opposite-sign or same-sign leptons and at least two
high-
p
Tjets, where
p
Tis the transverse momentum with respect to the beam direction.
1The tree-level process is illustrated in figure
1
. The free parameters in this model are the
1ATLAS uses a right-handed coordinate system, with its origin at the nominal interaction point in the
JHEP07(2015)162
qa
¯ qb
WR±
!
W∓ R
"∗
N
l± α
l± β
qc
¯ qd
qa
¯ qa
! WR∓
"∗
N l±α
l± β ¯ qc
qd N
qb
¯ qe Z#
! W∓
R
[image:4.595.89.494.92.235.2]"∗
Figure 2. The tree-level diagrams for the production of a heavy Majorana neutrino (N) in the
LRSM model, in which heavy gauge bosons WR and Z0 are also incorporated. Lepton flavour is
denoted byαandβ. Lepton flavour is assumed to be conserved, such thatα=β. TheWRboson
produced from theN decay is off-shell and, in this case, decays hadronically.
mixing between the heavy Majorana neutrinos and the Standard Model neutrinos,
V
`N,
and the masses of the heavy neutrinos,
m
N. In this framework, LEP has set direct limits
for
m
N< m
Z[
10
,
11
] and CMS has set direct limits for 90
< m
N<
200 GeV in
ee
final
states [
12
] and 40
< m
N<
500 GeV in
µµ
final states [
13
].
The second model is the left-right symmetric model (LRSM) [
4
,
14
–
16
], where a
right-handed symmetry SU(2)
Ris added to the SM. The symmetry SU(2)
Ris assumed to be the
right-handed analogue of the SM SU(2)
Lsymmetry. In this model, heavy gauge bosons
V
R=
{
W
R, Z
0}
are also predicted and, in this analysis, the heavy gauge bosons are assumed
to be more massive than the heavy neutrinos, such that they are kinematically allowed to
decay into final states including heavy neutrinos. These can be produced in the decays of
heavy gauge bosons according to
W
R→
N `
and
Z
0→
N N
and can subsequently decay via
an off-shell
W
Rboson into a lepton and a
q
q
¯
pair,
N
→
`W
R∗with
W
R∗→
q
q
¯
0. The tree-level
processes are shown in figure
2
. A previous ATLAS search in this framework has excluded
m
WR<
2
.
3 TeV for
m
WR−
m
N>
0
.
3 TeV at 95% confidence level (CL) [
17
]. A more
recent search performed by CMS has excluded
m
WR<
3
.
0 TeV for
m
WR−
m
N>
0
.
05 TeV
at 95% CL [
18
]. There are no such limits for the production of heavy neutrinos from
Z
0boson decays.
Both the mTISM and LRSM models produce final states containing two same-sign
leptons and high-
p
Tjets, but the kinematic characteristics of the events are quite different.
In the mTISM final state, one can reconstruct the resonant SM
W
boson from the jets
JHEP07(2015)162
2
The ATLAS detector
The ATLAS detector [
19
] surrounds the interaction point and covers nearly the entire solid
angle. The detector consists of an inner detector (ID) tracking system, electromagnetic and
hadronic calorimeters, and a muon spectrometer (MS) that surrounds the other detector
systems. The ID tracking system consists of a silicon pixel detector, a silicon microstrip
tracker, both covering
|
η
|
<
2
.
5, and a transition radiation tracker covering
|
η
|
<
2
.
0.
The ID tracker is immersed in a 2 T axial magnetic field provided by a superconducting
solenoid magnet. The electromagnetic accordion calorimeter is composed of lead and
liquid-argon (LAr) and provides coverage for
|
η
|
<
3
.
2. Hadronic calorimetry is provided by
steel and scintillator tile calorimeters for
|
η
|
<
1
.
7 and copper and LAr calorimeters for
1
.
5
<
|
η
|
<
3
.
2. Additional LAr calorimeters with copper and tungsten absorbers cover
the forward region. The MS consists of dedicated trigger chambers covering
|
η
|
<
2
.
4 and
precision tracking detectors covering
|
η
|
<
2
.
7. A system of three superconducting toroids
(one in the barrel, two in the end-caps), with eight coils each, provides the magnetic field
for the MS. A three-level trigger system is used to collect the data. The first-level trigger
(L1) is implemented in hardware, using a subset of detector information to reduce the event
rate to no more than 75 kHz. This is followed by two software-based trigger levels (L2 and
EF), which together further reduce the event rate to less than 1 kHz.
3
Background and signal simulation
There are several SM interactions that can produce pairs of isolated charged leptons from
vector boson decays, specifically from Drell-Yan and diboson processes and also from the
decay products of top quarks. These processes are modelled using events produced by
Monte Carlo (MC) generators. A summary of the primary MC generators used in this
paper to model the background processes is presented in table
1
. Processes that contribute
to the background with pairs of same-sign leptons are indicated by the label ‘SS’ and
processes which contribute with pairs of opposite-sign leptons, which are included in the
charge-misidentification background estimate (section
5.2
), are indicated by the label ‘OS’.
The MC samples are normalised using the best available theoretical cross-sections, typically
next-to-leading order or next-to-next-to-leading order in QCD.
The production of top quark pairs and the production of a single top-quark in
as-sociation with a
W
boson are simulated using
MC@NLO 4.0.3
[
20
,
21
] with the CT10
PDF set [
22
]. The production of single
Z
boson and diboson (
W
±W
∓,
W Z
and
ZZ
)
events are simulated using
Sherpa 1.4.1
[
23
] with the CT10 PDF set. These samples
include contributions from virtual photons, with the requirement for electron pairs to
sat-isfy
m
e+e−>
0
.
1 GeV. No requirement is made on
m
µ+µ−. The
Sherpa
samples include
leading-order matrix elements for the production of up to three additional partons. The
matching between the matrix elements and the parton shower is achieved using the CKKW
method [
24
]. The process
→
q
0q
0W
±W
±is generated using
Madgraph 2.1.1
[
25
] with
the MSTW 2008 PDF set [
26
]. The production of gauge bosons in association with top
JHEP07(2015)162
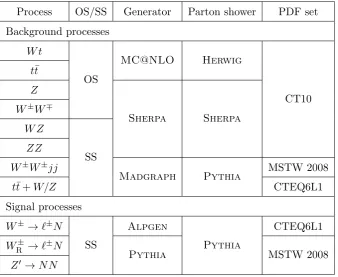
Process
OS/SS
Generator
Parton shower
PDF set
Background processes
W t
OS
MC@NLO
Herwig
CT10
t
¯
t
Z
Sherpa
Sherpa
W
±W
∓W Z
SS
ZZ
W
±W
±jj
Madgraph
Pythia
MSTW 2008
t
¯
t
+
W/Z
CTEQ6L1
Signal processes
W
±→
`
±N
SS
Alpgen
Pythia
CTEQ6L1
W
R±→
`
±N
Pythia
MSTW 2008
[image:6.595.130.469.83.360.2]Z
0→
N N
Table 1. Overview of primary MC samples used for the simulation of signal and background processes. The category labelled ‘OS/SS’ refers to whether the process leads to pairs of
opposite-sign (OS) or same-opposite-sign (SS) leptons. As described in section 5.2, OS MC samples are used in the
prediction of the charge-misidentification background.
Table
1
also shows how the various signal processes are modelled. Signal events in the
mTISM model are generated at leading order in QCD using the
Alpgen 2.14
MC
gener-ator [
27
,
28
] with the CTEQ6L1 PDF set. The events are generated for heavy Majorana
neutrino masses between 100 and 500 GeV. Final states which contain exactly two prompt
leptons
{
ee
,
µµ
}
with same-sign charge are produced.
The
Pythia 8.170
generator [
29
] is used to generate LRSM events at leading order
in QCD. It is assumed in the model that the coupling between heavy gauge bosons and
the heavy neutrino is equal to the coupling between the respective SM gauge bosons and
light neutrinos.
Similarly, the couplings of the new gauge bosons and the quarks are
assumed to be equal to the couplings between the SM gauge bosons and the quarks. In the
Pythia
implementation of this process, all of the decay products of heavy neutrinos are
distributed isotropically and so the heavy neutrino decays are independent of
m
WR, with
the assumption that
m
WR> m
N. In this approximation, the decay of the
Z
0
boson is also
independent of
m
WR. The events are generated with
W
Rboson masses between 0
.
6 TeV
and 4
.
5 TeV and
Z
0boson masses between 0
.
4 TeV and 3
.
6 TeV. At each
Z
0and
W
Rmass
JHEP07(2015)162
Parton showering, fragmentation, hadronisation and the modelling of the underlying
event for all
Madgraph
and
Alpgen
samples are performed with
Pythia 8.165
and for
MC@NLO
samples with
Herwig 6.520
[
30
] and
Jimmy 4.31
[
31
].
The effect of multiple
pp
collisions in the same or different bunch crossings is
incor-porated into the simulation by overlaying minimum-bias events generated using
Pythia 8
onto hard-scatter events, where the number of additional interactions is distributed in the
same way as in data. All the background samples are produced using a simulation of the
ATLAS detector [
32
] based on
Geant4
[
33
]. The signal samples are processed through
a fast simulation using a parameterisation of the performance of the ATLAS
electromag-netic and hadronic calorimeters [
34
], and
Geant4
in the ID and MS. Both the signal and
background samples are then processed with the same reconstruction software as the data.
Small differences between data and MC simulation in the lepton reconstruction,
identifica-tion and trigger efficiencies are corrected for by using specific data-driven measurements.
4
Data sample and event selection
The events used were selected from
pp
collision data with an integrated luminosity of 20.3
fb
−1collected by ATLAS in 2012. Quality criteria are applied to suppress non-collision
backgrounds such as cosmic-ray muons, beam-related backgrounds, and spurious noise in
the calorimeters.
4.1
Object reconstruction and selection
The search uses reconstructed electrons, muons, jets and a measurement of the missing
transverse momentum.
Electrons are required to satisfy tight identification requirements [
35
] and to have
p
T>
20 GeV and
|
η
|
<
2
.
47. Any electron in the transition region between the barrel
and end-cap calorimeters (1
.
37
<
|
η
|
<
1
.
52) is rejected. In order to avoid double counting
electrons as jets, the nearest jet within ∆
R
(
e,
jet) = 0
.
2 of an electron and with
p
T<
2
E
T,
where
E
T=
E
sin
θ
is the transverse energy deposited by the electron, is rejected.
Muons are required to be reconstructed in the MS and successfully matched to a
good-quality track in the ID [
36
]. It is required that muons have
p
T>
20 GeV and
|
η
|
<
2
.
5. In
order to suppress muons with misidentified charge, it is required that there is a consistent
measurement of charge in the MS and ID. Muons with
p
T<
80 GeV are required to be
well separated from jets, such that ∆
R
(
µ,
jet)
>
0
.
4, where ∆
R
=
p
(∆
η
)
2+ (∆
φ
)
2.
Jets are reconstructed using the anti-
k
tclustering algorithm [
37
,
38
] with the radius
pa-rameter set to 0
.
4. Jets are calibrated [
39
,
40
] using an energy- and
η
-dependent
simulation-based calibration scheme, with in-situ corrections simulation-based on data. The impact of multiple
overlapping
pp
interactions is accounted for using a technique that provides an
event-by-event and jet-by-jet correction [
41
]. Events are rejected if any jet is identified as originating
from beam-halo effects or calorimeter noise. Jets are required to have
p
T>
20 GeV and
|
η
|
<
2
.
8. The
p
Trequirement is chosen in order to maximise the acceptance for the
mTISM model. For jets with
p
T<
50 GeV within the acceptance of the tracking detector
JHEP07(2015)162
jet vertex fraction is calculated by summing the
p
Tof tracks associated with the jet and
matched to the selected primary vertex, and dividing it by the sum of the
p
Tof all tracks
associated with the jet.
The primary vertex of the event is defined as the reconstructed vertex with the highest
P
p
2T
, consistent with the beam spot position, where the sum is over all tracks associated
with the candidate primary vertex.
The missing transverse momentum,
E
missT
, is used to identify invisible particles such as
light neutrinos that escape detection. The
E
missT
quantity is calculated as the magnitude of
the negative vector sum of all reconstructed particles momenta, including muons, electrons,
photons, and jets, as well as clusters of calorimeter cells, not associated with these objects.
4.2
Lepton isolation criteria
Backgrounds due to misidentified leptons and non-prompt leptons, which are described
in detail in section
5.3
, can be suppressed by requiring that leptons are isolated from
other activity in the event. Because of the different background compositions for electrons
compared to muons and of the different response of the detector to isolated electrons and
muons from prompt sources, different isolation criteria are used for the two lepton flavours.
Electrons are required to satisfy
p
C2T
+ 1 GeV
/E
T<
0
.
05 and
E
TC3/E
T<
0
.
05,
where
p
C2T
is the sum of the
p
Tof all tracks within a cone of ∆
R
= 0
.
2 around the electron,
excluding the electron track itself, and
E
C3T
is the sum of the transverse energy in a cone
of ∆
R
= 0
.
3 around the electron, excluding the electron itself. The criteria are looser at
high electron
E
Tin order to maintain high efficiency.
Muons with
p
T<
80 GeV are required to have
p
C3T/p
T<
0
.
05 and
E
TC2/p
T<
0
.
05,
where
p
C3T
is the sum of the
p
Tof all tracks within a cone of ∆
R
= 0
.
3 around the muon,
excluding the muon track itself, and
E
C2T
is the sum of transverse energy measured in
the calorimeter within a cone of ∆
R
= 0
.
2 around the muon, excluding energy deposits
associated with the muon track. For muons with
p
T>
80 GeV the requirements are relaxed
in order to maintain high efficiency. Muons with
p
T>
80 GeV are either required to satisfy
E
C2T
/p
T<
0
.
05, or if they are within ∆
R
= 0
.
4 of a jet they can additionally be selected if
(
m
µj−
m
j)
>
10 GeV, where
m
jis the reconstructed mass of the jet closest to the muon
and
m
µjis the invariant mass of the jet and the muon. The latter criterion is efficient for
the decay of a boosted heavy neutrino decaying into a muon and a
q
q
¯
pair, while rejecting
a large fraction of misidentified muons.
Both the muons and electrons must satisfy a set of requirements on the impact
param-eters at the primary vertex in order to further suppress leptons originating from
heavy-flavour decays. They are required to have a transverse impact parameter,
d
0, which satisfies
|
d
0|<
0
.
2 mm and
|
d
0|/σ
(
d
0)
<
3, where
σ
(
d
0) is the uncertainty on
d
0. It is also required
that the product of the longitudinal impact parameter (
z
0) and the sine of the polar angle
of the lepton (
θ
) satisfy
|
z
0sin
θ
|
<
2 mm.
4.3
General event selection
JHEP07(2015)162
a 24 GeV
p
Tthreshold. The analysis also uses a dimuon trigger for events in which one
muon has satisfied a
p
Tthreshold of 20 GeV and a second muon has satisfied a threshold
of 8 GeV. The choice of triggers is found to maintain the highest possible signal efficiency
in each channel across the presented range of heavy neutrino masses. The electron (muon)
trigger efficiencies for offline selected electrons (muons) are
&
94% (70%) and
&
85% (90%)
in the barrel and end-cap, respectively. The total efficiency for a single electron (muon)
within the detector acceptance to satisfy the full lepton selection described in sections
4.1
and
4.2
, including the trigger requirement, is approximately 54% (70%).
The highest-
p
Tlepton in an event is required to satisfy
p
T>
25 GeV. The choice of
lepton
p
Tthreshold is dictated by the trigger requirements. It is required that at least one
lepton with
p
T>
25 GeV is matched to one of the described triggers. In the case of the
event being selected by the dimuon trigger, two muons must be matched to the trigger.
Any other leptons must satisfy
p
T>
20 GeV.
Events are required to contain exactly two leptons from
{
ee, µµ
}
with same-sign charge,
where the two leptons must have ID tracks associated with the same vertex. To remove
the small background arising from muon bremsstrahlung in the ID or in the first layers
of the EM calorimeter, events are rejected if a muon’s ID track is also reconstructed as
an electron. Backgrounds from
W Z
and
ZZ
decays are suppressed by rejecting events
which contain an additional lepton, where the additional lepton is selected with looser
identification requirements and no requirements on the isolation variables. The impact of
the latter criterion on the signal efficiency is negligible compared to the overall uncertainty
on the signal acceptance.
4.4
Selection criteria for mTISM signal events
The signal region for the mTISM model is defined for events containing, in addition to the
two leptons, at least two jets. The invariant mass,
m
jj, of the two highest-
p
Tjets is required
to lie in the range 60
< m
jj<
100 GeV. This selects events consistent with an on-shell
W
boson decaying to a
q
q
¯
pair. The invariant mass of the two leptons (
m
``) is required
to be greater than 40 GeV, a selection that has high efficiency for the signal over the full
range of
m
Nvalues considered. In the
ee
channel, the charge-misidentification background
(described in section
5.2
) is suppressed by requiring that the invariant mass of the two
leptons is outside a window around the
Z
boson mass,
|
m
``−
m
Z|
>
20 GeV. Backgrounds
due to electroweak processes producing same-sign leptons are dominated by those including
at least one light neutrino, particularly those arising from diboson production processes.
Such backgrounds may have high
E
missT
compared to the mTISM signal, so the events in
the signal region are required to have
E
missT
<
40 GeV.
The total efficiency (including the detector acceptance) for signal events to satisfy all
selection criteria is lower in
ee
events than in
µµ
events as electrons have lower efficiency to
satisfy the identification and isolation criteria. The efficiency for leptons in mTISM signal
events to satisfy the object selection increases as a function of the lepton
p
T. The total
efficiency therefore increases as a function of
m
N, from approximately 0.5% to 24% in the
JHEP07(2015)162
4.5
Selection criteria for LRSM
W
Rand
Z
0signal events
The signal region for heavy neutrinos produced in the decays of
W
Rbosons is defined for
events containing at least one jet. To exploit the high energy scale of the signal events it
is required that
m
``>
110 GeV and the invariant mass of the system consisting of the two
leptons and one or two jets must satisfy
m
``j(j)>
400 GeV. If the event contains more
than two jets, the two highest-
p
Tjets are used.
The signal region for heavy neutrinos produced in the decays of
Z
0bosons uses the
same requirement on the dilepton mass, but requires at least two jets and the invariant
mass of the system consisting of the two leptons and two to four jets must satisfy
m
``jj(jj)>
200 GeV. If the event contains more than four jets, the four highest-
p
Tjets are used. A
lower invariant mass of the system of 200 GeV is considered in the search for
Z
0bosons
compared to the value of 400 GeV used for
W
Rbosons since previous searches for heavy
neutrinos have already set strong constraints for
m
WR<
400 GeV [
17
], whereas there are
no such limits for
Z
0production.
Allowing only one jet in the
W
Rdecay or two jets in the
Z
0decay (rather than two
and four respectively) increases the signal efficiency for the case when the heavy neutrino is
boosted (
m
VRm
N) so that the
q
q
¯
pair produced in the decay of the off-shell
W
Rresults
in a single jet reconstructed in the detector. For
m
VRm
N, up to 60% of events contain
only one jet in
W
Revents or two jets in the case of
Z
0decays. The total selection efficiency
for LRSM events depends on the masses
m
VRand
m
Nand also the ratio
m
VR/m
N. The
total efficiency (including the detector acceptance) ranges from approximately 0
.
5% to 25%
in the
ee
channel, and from approximately 1
.
5% to 30% in the
µµ
channel. For small values
of
m
N/m
VR, the efficiency decreases rapidly and is below 15% for
m
N/m
VR<
0
.
1, because
the heavy neutrino decay products are highly boosted and the leptons are less isolated.
5
Background estimation
The background is evaluated in the signal regions according to three categories of lepton
pairs. The first two categories describe the contribution due to leptons originating from SM
processes that produce prompt isolated leptons. The first category, labelled as ‘prompt’ in
the following and discussed in section
5.1
, corresponds to irreducible background from true
same-sign prompt lepton pairs. The second category, labelled as ‘charge-flip’ in the
follow-ing and discussed in section
5.2
, corresponds to true opposite-sign prompt lepton pairs, in
which one lepton has its charge mismeasured. The third category, labelled as ‘non-prompt’
in the following and discussed in section
5.3
, corresponds to one or both leptons being either
a non-prompt lepton from semileptonic heavy-flavour decays, a jet misidentified as a lepton
or, in the case of electrons, photons misidentified as leptons. The first category of
back-ground events are entirely estimated using the SS MC samples described in section
3
, the
JHEP07(2015)162
Events
200 400 600 800 1000 1200 1400 1600
Events containing 3 or 4 leptons Data 2012
ZZ WZ Other
ATLAS -1 = 8 TeV, 20.3 fb s
Number of jets
1 2 3 4 ≥5
Bkg
Data 0.81 1.2
(a)
Events / GeV
-1 10
1 10
Events containing 3 or 4 leptons Data 2012
ZZ WZ Other
ATLAS -1 = 8 TeV, 20.3 fb s
[GeV]
T
Leading jet p 50 100 150 200 250 300 350 400 450 500
Bkg
Data 0.51
1.5
[image:11.595.94.501.95.262.2](b)
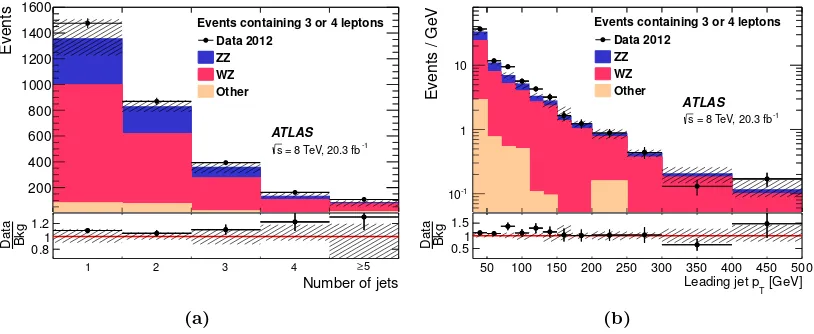
Figure 3. Distribution of (a) the number of jets and (b) the leading jetpTin events containing any
combination of exactly three or four leptons. The events must contain one lepton withpT>25 GeV
and all other leptons must satisfypT>20 GeV. The contribution labelled ‘Other’ is from processes
described in section 5.1 (with MC samples described in section 3), other than the contributions
from W Z and ZZ, which are labelled separately. The shaded bands indicate the experimental
uncertainties on the total expected background, including all contributions described in section6.2,
but not including any uncertainty on the W Z and ZZ cross-sections. The lower plots show the
ratio of data to the total expected background.
5.1
Background from prompt same-sign leptons
The background from SM processes that lead to two same-sign prompt leptons is referred
to as the prompt background and is estimated using the MC samples described in
sec-tion
3
. The largest contribution to the SM background in the signal regions originates
from
W Z
and
ZZ
events. Other prompt contributions were estimated to be negligible;
these include processes involving the production of three electroweak gauge bosons or of
a Higgs boson. The simulation of the
W Z
and
ZZ
backgrounds is validated by selecting
events with either three or four charged leptons satisfying the selection cuts described in
section
4.3
. These events arise predominantly from
W Z
and
ZZ
production, respectively,
with a negligible contribution expected from the signal processes. The expected and
ob-served jet multiplicity and leading jet
p
Tdistributions for these events are shown in figure
3
.
The number of events predicted by the simulation is found to be in good agreement with the
data and the kinematic properties of the events are adequately described by the simulation.
5.2
Background from prompt opposite-sign leptons
SM processes that produce opposite-sign leptons can also enter into the signal regions if
the charge of one lepton is incorrectly measured in the detector. This is referred to as the
‘charge-flip’ background and includes pairs of opposite sign-leptons produced in
t
¯
t
,
W
±W
∓and
Z
processes. The MC samples used to model these processes are described in section
3
.
The probability for a charge-flip event to occur is measured using
Z
→
µµ
and
JHEP07(2015)162
an invariant mass close to the mass of the
Z
boson. For muons, the charge-flip rate is
estimated by comparing the two independent measurements of the muon charge in the MS
and the ID. The charge-flip rate is found, as expected from simulation, to be consistent
with zero, and contributes a negligible number of events to the expected background.
There is however a sizeable charge-flip rate for electrons, due to bremsstrahlung
pho-tons produced in the ID and subsequently converting to electron pairs.
A sample of
Z
→
ee
events in data is used to perform a single maximum-likelihood fit, which
ex-tracts the electron charge-flip rate as a function of
η
[
44
]. The contribution to these events
from fake and non-prompt electrons (see section
5.3
) is subtracted from the data sample
prior to the fit. The measured rate, which is strongly correlated to the amount of material
traversed by the electron in the ID, is found to be approximately 10
−4for electrons within
the barrel region (
|
η
|
<
1
.
0), increasing to 10
−2at the edge of the detector acceptance
(
|
η
|
= 2
.
47). The data-to-MC ratio of the measured electron charge-flip rate is used as a
correction factor to the charge-flip rate obtained in the simulation. The
p
T-dependence of
the charge-flip rate is therefore directly taken from the MC simulation.
5.3
Background from fake and non-prompt leptons
Events where jets or photons are misidentified as leptons (‘fakes’) or events with
non-prompt leptons which originate from semileptonic heavy-flavour decays constitute a
sig-nificant background, which is referred to as the non-prompt background. These processes
include
W
+ jets and
t
¯
t
production, where one lepton originates from a vector boson decay
and the other lepton is misidentified or from a non-prompt decay. This background cannot
be reliably predicted from MC simulation and is estimated directly in each of the signal
regions, using the data-driven matrix method [
45
]. The matrix-method characterises
lep-tons which satisfy ‘loose’ identification criteria as being from prompt or fake/non-prompt
sources according to their probabilities to satisfy the full lepton identification criteria.
A ‘loose’ electron is defined with an identification requirement that is relaxed from the
‘tight’ to ‘medium’ operating point compared to the standard electron selection described
in section
4.1
. The selection criteria for a ‘loose’ muon are identical to the full selection
described in section
4.1
, with the same requirements on the impact parameters described
in section
4.2
but without a requirement to satisfy any isolation criteria.
The measurement of the probabilities
r
and
f
for ‘loose’ leptons from prompt or
fake/non-prompt sources respectively to satisfy the full lepton identification criteria are
the key factors in the estimate of the non-prompt backgrounds. The probabilities
r
are
measured in
Z
→
``
events as these events are dominated by prompt leptons.
The probabilities
f
are measured in a selection of events which contain a large number
of fake and non-prompt leptons. In these control samples, any residual prompt background
is subtracted using MC estimates, and low-mass hadronic resonances are excluded by
re-quiring
m
``>
15 GeV. For electrons, the probabilities are measured in events with at least
one jet and with exactly one electron. To suppress events containing
W
decays it is required
that
|
∆
φ
(
e, E
missT
)
|
<
0
.
5 and
E
Tmiss+
m
T<
40 GeV, where
m
Tis the transverse mass.
2The
2m T=
p
JHEP07(2015)162
Events
100 200 300 400 500 600 700 800 900 1000
) < 20 GeV 2
µ
( T ) > 25 GeV; 10 GeV < p 1
µ
( T p
Data 2012 Total background Prompt
Non-prompt
ATLAS
-1 = 8 TeV, 20.3 fb s
Number of jets
0 1 2 3 4 ≥5
Bkg
Data 0.51
[image:13.595.165.434.86.278.2]1.5
Figure 4. Distribution of the number of jets in a validation region consisting of events containing
exactly two same-sign muons with one muon satisfying pT > 25 GeV and the second satisfying
10 GeV< pT <20 GeV. The shaded bands indicate the total uncertainty, including all
contribu-tions described in section 6, on the total expected background and the lower plots show the ratio
of data to the total expected background.
probabilities for muons are measured in events containing pairs of muons chosen with
trans-verse impact parameter requirements which differ from the standard selection, such that
|
d
0|<
10 mm and
|
d
0/σ
(
d
0)
|
>
5. This sample of pairs of muons is expected to have a
com-position similar to the signal region, making it suitable for the measurement of
f
. A
correc-tion factor is applied to
f
for muons to account for the fact that muons with high
|
d
0/σ
(
d
0)
|
have a lower probability than muons with low
|
d
0/σ
(
d
0)
|
to satisfy the isolation criteria.
The correction factor of approximately 1.4 is measured using
b
¯
b
and
t
¯
t
MC simulation.
A validation region is defined for same-sign
µµ
events which have satisfied the dimuon
trigger (section
4.3
) with one muon satisfying
p
T>
25 GeV and the second satisfying
10 GeV
< p
T<
20 GeV. As the
p
Tof the second muon is relatively low, this region is
dominated by non-prompt background events. The jet multiplicity measured in events in
this region is compared to the expected background as shown in figure
4
. The overall level
of agreement is within one standard deviation for up to five jets in the event.
5.4
Validation of background estimates
The validation of prompt, charge-flip and non-prompt background estimates is considered
in this section.
The combined background estimate can be evaluated using events containing exactly
two same-sign leptons and no jets. This sample of events is orthogonal to each of the
different signal regions described in sections
4.4
and
4.5
, and is expected to contain only a
negligible contribution from possible signal events. Comparisons of the distributions of the
E
missT
and lepton
p
Tas measured in data and estimated from the background predictions
JHEP07(2015)162
Events /GeV -1 10 1 10 2 10 Total background Charge flip Prompt Non-prompt Events with 0 jetsData 2012
ATLAS -1
= 8 TeV, 20.3 fb s ee channel [GeV] miss T E 0 20 40 60 80 100 120
Bkg Data 0.5 1 1.5 (a) Events /GeV 2 4 6 Total background Prompt Non-prompt Events with 0 jets
Data 2012 ATLAS
-1
= 8 TeV, 20.3 fb s channel µ µ [GeV] miss T E 0 20 40 60 80 100 120
Bkg Data 0.5 1 1.5 (b) Events /GeV 1 − 10 1 10 2 10 3 10 Total background Charge flip Prompt Non-prompt Events with 0 jets
Data 2012
ATLAS -1 = 8 TeV, 20.3 fb s
ee channel
[GeV] T Electron p
50 100 150 200 250 300 350
Bkg Data 0.5 1 1.5 (c) Events /GeV -2 10 -1 10 1 10 Total background Prompt Non-prompt Events with 0 jets
Data 2012 ATLAS
-1 = 8 TeV, 20.3 fb s channel µ µ [GeV] T Muon p
50 100 150 200 250 300 350
Bkg
Data 1 2
[image:14.595.91.505.94.436.2](d)
Figure 5. TheEmiss
T (top) and leptonpT (bottom) distributions for theee (left) and µµ(right)
channels in a validation region consisting of events with exactly two same-sign leptons and no jets.
The shaded bands indicate the total uncertainty, including all contributions described in section6,
on the total expected background and the lower plots show the ratio of data to the total expected background.
between data and background prediction is within approximately one standard deviation
in both the
ee
and
µµ
channels.
An additional sample of events is considered, which fully includes all signal regions.
This region is defined for events containing exactly two same-sign leptons, with no
require-ment on the number of jets in the event. The contamination from signal events in this
sample is less than 2% of the total background in both channels. The distributions of
the leading jet
p
Tand the number of jets in these events, in the
ee
and
µµ
channels, as
measured in data and estimated from the background predictions from the three sources
described above, are shown are shown in figure
6
. The overall agreement between data and
JHEP07(2015)162
Events / GeV
-1 10 1 10 Data 2012 Total background Charge flip Prompt Non-prompt ATLAS -1 = 8 TeV, 20.3 fb s
ee channel
[GeV]
T
Leading jet p
50 100 150 200 250 300 350 400 450 500
Bkg
Data 0.5
1 1.5
(a)
Events / GeV
-1 10 1 10 Data 2012 Total background Prompt Non-prompt ATLAS -1 = 8 TeV, 20.3 fb s channel µ µ [GeV] T
Leading jet p
50 100 150 200 250 300 350 400 450 500
Bkg Data 0.5 1 1.5 (b) Events 500 1000 1500 2000 2500 3000 3500 4000 Data 2012 Total background Charge flip Prompt Non-prompt ATLAS -1 = 8 TeV, 20.3 fb s
ee channel
Number of jets
0 1 2 3 4 ≥5
Bkg Data 0.5 1 1.5 (c) Events 50 100 150 200 250 300 Data 2012 Total background Charge flip Prompt Non-prompt ATLAS -1 = 8 TeV, 20.3 fb s
channel µ µ
Number of jets
0 1 2 3 4 ≥5
[image:15.595.90.508.93.440.2]Bkg Data 0.5 1 1.5 (d)
Figure 6. The distribution of the transverse momentum pT of the leading jet (top) and the
distribution of the number of jets (bottom) for theee(left) andµµ(right) channels in a validation
region consisting of events with exactly two same-sign leptons. The shaded bands indicate the total
uncertainty, including all contributions described in section 6, on the total expected background
and the lower plots show the ratio of data to the total expected background.
6
Systematic uncertainties
The background estimates and signal efficiencies are subject to several systematic
uncer-tainties. The relative size of the uncertainties on the total background estimates in the
mTISM and LRSM signal regions are detailed in tables
2
and
3
respectively. Since the
tables show the size of each uncertainty relative to the total background estimate, the
im-pact of each uncertainty depends on the background composition in the different channels
(see section
7
and tables
4
and
5
).
6.1
Background uncertainties
JHEP07(2015)162
ee
µµ
Non-prompt
±
7
±
14
Charge-flip
±
7
—
Prompt normalisation
±
2
±
10
MC statistics
±
14
±
8
Jet energy scale
+8/
−
22
+7/
−
12
E
missT
+2/
−
3
+6/
−
3
Jet energy resolution
±
4
±
3
Jet vertex fraction
+2/
−
6
+4/
−
5
Lepton uncertainties
±
2
+2/
−
3
Luminosity
±
2
±
1
[image:16.595.184.414.113.333.2]Total
+20/
−
29
+21/
−
24
Table 2. A breakdown of the relative uncertainty on the total background (given in %) in the
mTISM signal region. The various sources of systematic uncertainty are described in section 6.
ee
µµ
W
RZ
0W
RZ
0Non-prompt
±
12
±
15
+10/
−
9
+13/
−
11
Charge-flip
+5/
−
4
+4/
−
3
—
—
Prompt normalisation
±
5
+5/
−
4
±
18
±
14
MC statistics
±
7
±
6
±
5
±
4
Jet energy scale
+8/
−
9
+5/
−
4
±
5
+5/
−
4
Jet energy resolution
±
0.9
±
0.6
±
1.2
±
0.2
Jet vertex fraction
±
1
±
2
+0.9/
−
0.1
+2.4/
−
1.1
Lepton uncertainties
+2/
−
1
+2.7/
−
1
±
2
±
2
Luminosity
±
1
+1.5/
−
1
±
1
±
1
Total
±
18
±
18
±
21
+20/
−
19
Table 3. A breakdown of the relative uncertainty on the total background (given in %) in the
[image:16.595.125.470.436.657.2]JHEP07(2015)162
effect of the choice of control region definition on the measured probabilities, as well as
the statistical uncertainty on determining the probabilities. The total uncertainty on the
non-prompt background in the
ee
(
µµ
) channel varies from 30
−
48% (41
−
45%), depending
on the signal region.
The charge-flip background is only relevant for the
ee
channel (see section
5.2
) and
its uncertainty is dominated by the statistical precision with which the charge-flip rate is
determined from the available data. There is, additionally, a non-negligible contribution to
the total uncertainty due to the modelling of the subtraction of the non-prompt background,
although this is correlated with the uncertainty on the non-prompt background. Since
the charge-flip background uses MC simulation, the systematic uncertainties discussed in
section
6.2
also apply to the flip background. The total uncertainty on the
charge-flip background varies from 18
−
46%, depending on the signal region.
The uncertainty on the normalisation of the backgrounds originating from
W Z
and
ZZ
processes is derived from the diboson control region described in section
5.1
. This
uncertainty is taken to be either the difference between the data and the prediction or the
statistical uncertainty from the limited data statistics, whichever is largest. The uncertainty
is applied as a function of the number of jets, leading to uncertainties of 10
−
14%, depending
on the signal region. The uncertainty on the cross-section of other background processes
from MC estimates is taken from the uncertainties on the theoretical cross-sections. The
combined effect of the diboson normalisation and theoretical cross-section uncertainties is
labelled as ‘Prompt normalisation’ in tables
2
and
3
.
Another source of uncertainty is due to the MC statistical uncertainty. In the mTISM
signal region this is particularly large in the
ee
channel due to the small number of events
in the
Z
→
ee
MC sample in this region.
6.2
Uncertainties on MC simulation
The following uncertainties are applied to all MC-derived predictions. In addition to
af-fecting the prompt and charge-flip background estimates, these uncertainties also apply to
the signal simulation.
The systematic uncertainty on the jet energy scale has an important effect on both the
signal and background processes, as the signal-region event selection includes requirements
on quantities that are reconstructed from jet kinematics [
40
]. The uncertainty on the jet
energy scale is notably asymmetric in the mTISM signal region (table
2
) compared to
the LRSM signal region (table
3
) due to the dependency on the leading dijet mass in the
mTISM signal region definition described in section
4.4
. The uncertainty due to the JES on
the sum of the prompt and charge-flip backgrounds varies from 6
−
28%, depending on the
signal region. The modelling of the missing transverse momentum (‘
E
missT
’) [
46
] is included
as a systematic uncertainty in the mTISM signal region (table
2
) as there is a dependence
on this quantity in the signal region definition described in section
4.4
. Other smaller
JHEP07(2015)162
6.3
Signal-specific modelling uncertainties
In addition to the uncertainties associated with the MC simulation of background processes,
there are systematic modelling uncertainties associated with the signal MC samples. An
uncertainty is considered for the signal MC simulation to reflect the choice of parton shower
model. The nominal parton shower model that is used for all signal MC samples is
Pythia
8.165
. The total number of events in the signal region when the signal MC generator is
in-terfaced to
Pythia
is compared to the number of events when the generator is interfaced to
Herwig 6.520
. The variation in the signal efficiency is measured to be approximately 5%.
The uncertainty due to the parton distribution functions on the signal acceptance is found
to be approximately 5% for the mTISM signal samples and approximately 7% for the
LRSM signal samples.
A systematic uncertainty is also considered to cover the effect of using the fast detector
simulation described in section
3
. Two versions of the MC signal, one with a full detector
simulation and the other with the standard fast detector simulation, are compared in each
lepton channel, for a single signal mass point. The difference in the efficiency to select
signal events, approximately 4%, is assigned as an uncertainty.
7
Results
The numbers of events measured in data are compared to the expected numbers of
back-ground events in the signal regions, with the intention of interpreting an excess of events
in data in terms of a heavy Majorana neutrino in the mTISM or LRSM models.
7.1
Results in the mTISM signal region
The observed and predicted distributions of the invariant mass of the two highest-
p
Tjets
(
m
jj) in events satisfying the mTISM selection criteria, excluding the criteria on
m
jj(60 GeV
< m
jj<
100 GeV) are presented in figure
7
. The shapes of the distributions show
good agreement between data and expectation. The numbers of expected and observed
events in the mTISM signal region (indicated by arrows in figure
7
) are shown in table
4
.
There is no excess of events relative to the expectation. The observed yields in the data
are used to set 95% CL upper limits on the production cross-section times branching
ratio,
σ
×
Br(
pp
→
`
±N
→
`
±`
±q
q
¯
0), of heavy neutrinos to electrons or muons, using the
profile-likelihood test statistic [
49
] and the
CL
smethod [
50
]. The systematic uncertainties
are included in the test statistic as nuisance parameters. Each systematic uncertainty is
assumed to be uncorrelated with all other systematic uncertainties. The limits are shown as
a function of
m
Nin figure
8
and are translated into limits on the mixing parameter,
|
V
`N|
2,
between the heavy neutrino and the SM neutrino, separately for the
ee
and
µµ
channels.
JHEP07(2015)162
Events / GeV
1 −
10 1
Data 2012
= 0.2 2 | lN |V
= 120 GeV N m Signal MC
Total background Charge flip Prompt Non-prompt
ATLAS
-1
= 8 TeV, 20.3 fb s
ee channel
[GeV]
jj
m
50 100 150 200 250 300 350 400 450 500
Bkg
Data
0.5 1 1.5
(a)
Events / GeV
1
− 10 1
Data 2012
= 0.02
2
|
lN
|V = 120 GeV
N
m Signal MC
Total background Prompt Non-prompt
ATLAS
-1
= 8 TeV, 20.3 fb s
channel µ µ
[GeV]
jj
m
50 100 150 200 250 300 350 400 450 500
Bkg
Data
0 1 2
[image:19.595.93.500.119.283.2](b)
Figure 7. Invariant mass of the two highest-pTjets (mjj) in events satisfying the mTISM signal
region criteria (excluding the mjj criteria) for (a) ee and (b) µµ events. Events satisfying all
selection criteria are in the region indicated by the arrows. The expected mTISM signal distribution
formN = 120 GeV is shown by the dashed (blue) histogram. The values of the mixing parameter
|V`N|2 are chosen such that the signal distribution is clearly visible, |VeN|2 = 0.2 for (a) and
|VµN|2= 0.02 for (b). The shaded bands indicate the total uncertainty, including all contributions
described in section6, on the total expected background and the lower plots show the ratio of data
to the total expected background.
ee
µµ
Prompt
3
.
5
+0−1..795
.
8
+1−1..37Charge-flip
13
+3−6<
0
.
02
Non-prompt
4
.
3
±
1
.
8
2
.
9
±
1
.
3
Total background
21
+4−68
.
7
±
2
.
0
Data
19
6
Signal (
m
N= 120 GeV)
18
6
.
6
Signal (
m
N= 240 GeV)
30
5
.
3
Table 4. Total event yields measured in data and predicted for signal and background processes in the mTISM signal region. The uncertainties shown on the various backgrounds correspond to the
total uncertainty. The expected number of mTISM signal events are calculated formN = 120 GeV
(with|V`N|2 equal to 0.03 and 0.003 in theee andµµ channels respectively) andmN = 240 GeV
(with|V`N|2equal to 0.2 and 0.02 in theeeandµµchannels respectively). The values of the mixing
parameters|V`N|2are chosen to be close to the expected limit shown in figure 8. For backgrounds
[image:19.595.180.415.448.597.2]JHEP07(2015)162
[GeV]
N
m
100 150 200 250 300 350 400 450 500
’) [fb] q q ±e ± e → N ± e → Br(pp × σ 1 10 2
10 95% CL Observed limit
95% CL Expected limit
σ 1 ± 95% CL Expected limit
σ 2 ± 95% CL Expected limit ATLAS
-1
= 8 TeV, 20.3 fb s
(a)
[GeV] N m
100 150 200 250 300 350 400 450 500
2| eN |V -3 10 -2 10 -1 10 1 ATLAS
95% CL Observed limit
95% CL Expected limit
σ 1 ± 95% CL Expected limit
σ 2 ± 95% CL Expected limit
-1
= 8 TeV, 20.3 fb s
(b)
[GeV]
N
m
100 150 200 250 300 350 400 450 500
’) [fb] q q ± µ ± µ → N ± µ → Br(pp × σ 1 10
95% CL Observed limit
95% CL Expected limit
σ 1 ± 95% CL Expected limit
σ 2 ± 95% CL Expected limit ATLAS
-1
= 8 TeV, 20.3 fb s
(c)
[GeV] N m
100 150 200 250 300 350 400 450 500
2 | N µ |V -3 10 -2 10 -1 10 1 ATLAS
95% CL Observed limit
95% CL Expected limit
σ 1 ± 95% CL Expected limit
σ 2 ± 95% CL Expected limit
-1
= 8 TeV, 20.3 fb s
[image:20.595.105.499.96.417.2](d)
Figure 8. Observed and expected 95% confidence level upper limits on the cross-section times branching ratio for the production of mTISM heavy Majorana neutrinos as a function of the heavy
neutrino mass for (a) theeechannel and (c) theµµchannel. The limits on the mixing between the
heavy Majorana neutrinos and the SM neutrinos are shown in (b) and (d). Values larger than the solid black line are excluded by this analysis.