University of Warwick institutional repository:
http://go.warwick.ac.uk/wrap
A Thesis Submitted for the Degree of PhD at the University of Warwick
http://go.warwick.ac.uk/wrap/63942
This thesis is made available online and is protected by original copyright.
Please scroll down to view the document itself.
Estimating the space density of ultracompact
binary stars
by
Philip J. Carter
Thesis
Submitted to the University of Warwick
for the degree of
Doctor of Philosophy
Department of Physics
Contents
List of Tables v
List of Figures vi
Acknowledgments ix
Declarations x
Abstract xii
Chapter 1 Introduction 1
1.1 Close binary stars . . . 2
1.1.1 Roche geometry . . . 2
1.1.2 Binary evolution . . . 4
1.1.3 White dwarfs . . . 5
1.1.4 Angular momentum loss . . . 6
1.1.5 Accretion disc formation . . . 8
1.2 Cataclysmic variables . . . 10
1.2.1 Types of CV . . . 10
1.2.2 Dwarf nova outbursts . . . 11
1.2.3 Superoutbursts and superhumps . . . 12
1.2.4 CV evolution . . . 13
1.2.5 Spectroscopic features . . . 16
1.3 AM Canum Venaticorum binaries . . . 18
1.3.1 Properties . . . 19
1.3.2 Formation and evolution . . . 21
1.3.3 Population studies . . . 25
1.4 Discovering AM CVn binaries . . . 27
1.4.2 AM CVns in the SDSS . . . 28
1.4.3 A search for new AM CVns in the SDSS . . . 28
1.4.4 Using outbursts to find AM CVns . . . 30
1.5 Thesis outline . . . 31
Chapter 2 Methods and Techniques 32 2.1 Introduction . . . 32
2.2 Observations and reduction . . . 32
2.2.1 Detectors . . . 32
2.2.2 Spectroscopy . . . 35
2.2.3 Data reduction . . . 36
2.3 Data analysis techniques . . . 41
2.3.1 Spectroscopic identification . . . 41
2.3.2 The equivalent width . . . 42
2.3.3 Radial velocity measurement . . . 44
2.3.4 Period finding . . . 46
2.3.5 Doppler tomography . . . 49
2.4 Colour-colour diagrams . . . 49
2.5 Summary . . . 52
Chapter 3 A search for the hidden population of AM CVn binaries in the Sloan Digital Sky Survey 53 3.1 Introduction . . . 53
3.2 Survey observations . . . 54
3.3 Spectroscopic identification . . . 58
3.3.1 Testing the identifications . . . 59
3.3.2 AM CVn detection . . . 61
3.3.3 Cataclysmic variables . . . 62
3.3.4 White dwarfs . . . 65
3.4 New AM CVn binaries . . . 65
3.4.1 SDSS J104325.08+563258.1 . . . 69
3.4.2 SDSS J173047.59+554518.5 . . . 69
3.5 The AM CVn equivalent width – period relation . . . 70
3.6 Colours of the sample . . . 72
3.7 Estimating the AM CVn binary space density . . . 74
3.8 Discussion . . . 75
3.8.1 Survey completeness . . . 75
3.9 Summary . . . 80
Chapter 4 The AM Canum Venaticorum binary SDSS J1730+5545 81 4.1 Introduction . . . 81
4.2 Observations and data reduction . . . 81
4.3 Results . . . 83
4.3.1 Average spectral features . . . 83
4.3.2 The spectroscopic period . . . 88
4.3.3 Dynamic spectrum . . . 90
4.4 Discussion . . . 90
4.4.1 Current state . . . 90
4.4.2 Evolutionary history . . . 93
4.5 Summary . . . 94
Chapter 5 The helium-rich cataclysmic variable SBSS 1108+574 95 5.1 Introduction . . . 95
5.2 Observations . . . 95
5.2.1 Optical spectroscopy . . . 95
5.2.2 Photometry . . . 96
5.3 Results . . . 97
5.3.1 Average spectral features . . . 97
5.3.2 Photometric periods . . . 103
5.3.3 The spectroscopic period . . . 107
5.3.4 Mass ratio . . . 110
5.3.5 Dynamic spectrum . . . 113
5.3.6 Grazing eclipse . . . 115
5.4 Discussion . . . 116
5.5 Summary . . . 117
Chapter 6 Improving the efficiency of the survey 119 6.1 Introduction . . . 119
6.2 Cross-matching . . . 119
6.2.1 GALEX . . . 120
6.2.2 UKIDSS . . . 120
6.3 Colour cuts . . . 121
6.4 Variability . . . 126
6.4.1 Detecting outbursts . . . 127
6.4.3 CV lightcurves . . . 128
6.4.4 Searching for variability . . . 130
6.5 Discussion . . . 131
6.6 Summary . . . 132
Chapter 7 New AM Canum Venaticorum binaries from the Sloan Digital Sky Survey III 134 7.1 Introduction . . . 134
7.2 A search of the SDSS spectroscopic database . . . 134
7.3 The new AM CVn binaries . . . 137
7.3.1 Average spectra . . . 137
7.3.2 Radial velocities . . . 137
7.4 Discussion . . . 144
7.5 Summary . . . 145
Chapter 8 Conclusions 146 8.1 Summary . . . 146
8.2 Discussion . . . 147
8.2.1 The AM CVn binary space density . . . 147
8.2.2 The AM CVn orbital period distribution . . . 148
8.2.3 The evolved CV formation channel . . . 152
8.3 Outlook . . . 155
List of Tables
2.1 Strongest spectral features expected for each element . . . 42
3.1 Summary of the hidden AM CVn survey observing campaign . . . . 57
3.2 Numbers of main object types identified in our sample . . . 59
3.3 Heii4686 and Hβemission line EWs for CVs with strong Heiiemission 62 3.4 EW and FWHM for the emission lines in SDSS J1043 and SDSS J1730 69 3.5 Orbital period and EW of the Hei 5875 line for AM CVns . . . 71
3.6 Expected numbers of AM CVns and corresponding space densities . 76 4.1 Log of our observations of SDSS J1730. . . 82
4.2 EW and FWHM of prominent lines in SDSS J1730. . . 87
4.3 SDSS J1730 orbit parameters derived from radial velocity measurements 89 5.1 Summary of our spectroscopic observations of SBSS 1108+574. . . . 96
5.2 SDSS observations of SBSS 1108+574. . . 97
5.3 Observers, locations, and telescope apertures used for the photometry 97 5.4 Log of the photometric observations . . . 98
5.5 GALEX observations of SBSS 1108+574. . . 101
5.6 Equivalent widths and FWHM of prominent lines . . . 103
5.7 Orbit parameters for SBSS 1108+574 derived from radial velocity measurements . . . 109
7.1 Colour selection used to search for AM CVns in the SDSS spectro-scopic database . . . 135
7.2 SED and Hei5875 EW for the two new AM CVn binaries . . . 139
7.3 Radial velocities measured from the SDSS J1137 subspectra . . . 141
7.4 Radial velocities measured from the SDSS J1505 subspectra . . . 141
List of Figures
1.1 Roche equipotentials for a binary with a mass ratio q=0.2 . . . 3
1.2 Schematic representation of the common envelope phase . . . 4
1.3 Schematic view of magnetic braking . . . 7
1.4 Formation of an accretion disc . . . 9
1.5 TheKepler light curve of the dwarf nova V344 Lyrae . . . 11
1.6 Schematic representation of the dwarf nova cycle in theΣ–T plane . 12 1.7 The formation and evolution of CVs . . . 14
1.8 The orbital period distribution of known CVs . . . 15
1.9 Formation of a double peaked emission line from an accretion disc . 17 1.10 Three component model of the optical spectrum of a dwarf nova . . 18
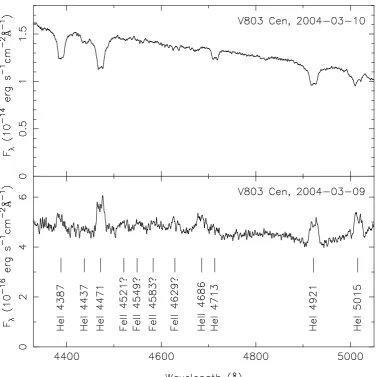
1.11 Outburst and quiescent state spectra of V803 Cen . . . 20
1.12 Quiescent state spectrum of SDSS J1240−0159 . . . 21
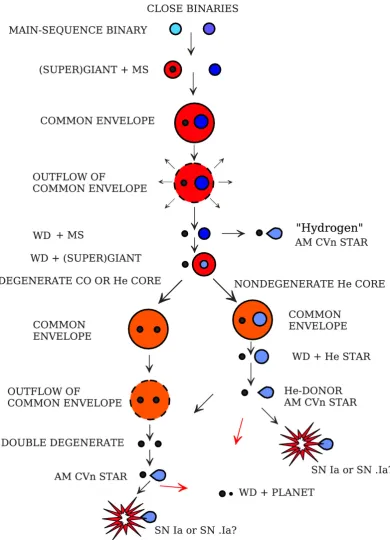
1.13 AM CVn formation and evolution . . . 23
1.14 Evolutionary pathways for AM CVn stars . . . 24
1.15 Colours of the known AM CVn stars and the colour-selected candidates 29 2.1 Cross-section of a CCD pixel . . . 33
2.2 Readout process for a three-phase CCD . . . 34
2.3 A raw CCD spectrum . . . 35
2.4 Example of a bias frame . . . 36
2.5 Example of a spectroscopic flat field . . . 36
2.6 A 1D spectrum produced via optimal extraction . . . 39
2.7 Example of a Cu-Ne arc frame . . . 39
2.8 A fully reduced 1D spectrum after wavelength and flux calibration . 40 2.9 Example identification spectra of objects from our sample . . . 43
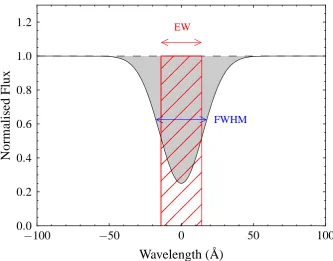
2.10 The equivalent width of a spectral line . . . 44
2.12 Relation between spatial and velocity coordinates in a Doppler map 50
2.13 Examples of colour-colour diagrams using SDSS colours . . . 51
3.1 Completeness of the SDSS DR9 spectroscopy . . . 54
3.2 Density of sources in the SDSS photometric database . . . 55
3.3 Spectroscopic completeness of our sample . . . 58
3.4 EW of Hei5875 vs Hαfor our sample . . . 60
3.5 Identification spectra of the CVs discovered in our sample . . . 63
3.6 EW of Hei5875 vs Hαfor our CV sample, and the Sloan CVs . . . 64
3.7 Identification spectra of the DQ white dwarfs discovered in our sample 66 3.8 Identification spectra of the DZ white dwarfs discovered in our sample 67 3.9 Identification spectra of SDSS J1043 and SDSS J1730 . . . 68
3.10 EW of the Hei 5875 line versus orbital period for AM CVns . . . 72
3.11 Colours of the known AM CVns together with our candidates . . . . 73
3.12 Completeness of the survey as a function of colour . . . 77
4.1 Normalized average spectrum of SDSS J1730 obtained with GMOS . 84 4.2 Average spectrum of SDSS J1730 obtained with ISIS . . . 85
4.3 Blackbody fit to the ISIS average spectrum of SDSS J1730 . . . 86
4.4 Lomb-Scargle periodogram calculated from the Hei radial velocities of SDSS J1730. . . 89
4.5 Phase-folded radial velocity curve for SDSS J1730 . . . 89
4.6 Line profiles, trailed spectra and Doppler maps for SDSS J1730 . . . 91
5.1 Average spectrum of SBSS 1108+574 in quiescence . . . 99
5.2 Spectrum, SDSS and GALEX fluxes, and white dwarf fit . . . 100
5.3 Average spectrum of SBSS 1108+574 during outburst . . . 102
5.4 Lightcurves for April 23 and April 24 . . . 104
5.5 Full lightcurve of our photometric observations . . . 105
5.6 Lomb-Scargle periodograms of the photometric data set . . . 106
5.7 Phase-folded lightcurve of the first two nights of observations . . . . 107
5.8 Periodograms of the photometric data set after prewhitening . . . . 108
5.9 Lomb-Scargle periodogram calculated from the Heii 4686 radial ve-locities . . . 109
5.10 Measured Heii radial velocities folded on a period of 55.3 minutes . . 110
5.11 Line profiles, trailed spectra, and Doppler maps . . . 112
5.13 Binned, phase-folded Heii 4686 EW against orbital phase . . . 115
6.1 Colours of the known AM CVns together with our candidates . . . . 122
6.2 Colours of the candidates withGALEX NUV detections . . . 124
6.3 Infrared colours of our sample . . . 125
6.4 CRTS lightcurve for SDSS J0926 . . . 127
6.5 CRTS lightcurve for SDSS J1730 . . . 128
6.6 MLS lightcurve for the CV SDSS J0735+2201 . . . 129
6.7 CRTS lightcurve for SDSS J0748+3125 . . . 129
6.8 CRTS lightcurve for SDSS J0929+4936 . . . 130
7.1 New colour cuts used to select targets from SDSS III spectroscopy . 136 7.2 SDSS spectra of the two new AM CVn binaries . . . 138
7.3 Blackbody fits to the new AM CVn spectra and photometry . . . 140
7.4 ORT power spectrum for SDSS J1137 . . . 142
7.5 Phase folded radial velocity curve for SDSS J1137 . . . 142
7.6 ORT power spectrum for SDSS J1505 . . . 143
7.7 Phase folded radial velocity curve for SDSS J1505 . . . 143
8.1 Modelled period distribution of AM CVn binaries in SDSS-I spec-troscopy . . . 149
Acknowledgments
I am extremely grateful to Tom Marsh and Danny Steeghs for their guidance and
support throughout the last three and a half years. Their insight has been invaluable.
I would also like to thank Paul Groot, for giving me my first experience of observing
on La Palma; Chris Copperwheat, for getting me started with data reduction; Elmé
Breedt and Boris Gänsicke. I am indebted to all my collaborators, for their hard
work, and provision of spectra, code, and comments that have helped to improve
my work.
My thanks go to all the members of the Astronomy and Astrophysics group at
Warwick, both past and present, for their advice, probing questions, and friendship.
You have made this a wonderful place in which to study, and provided a constant
source of support and entertainment. I must particularly thank: Rachel, for making
me feel welcome from day one, Penélope, John, João, Nicola, Sandra, Madelon,
Simon, Steve, Tom and Greg, your company has been an integral part of my PhD
experience.
I am incredibly fortunate to have a supportive family who have always
en-couraged me. I will be forever grateful to my parents, this work would not have
been possible without them.
I also want to acknowledge the brilliant people I have lived with during the
last few years, especially those that lived in Minty. Sophie, Helen, Oli, Lolu, Nichola,
Alex, Sarah Jane and Claire, I could not have wished for better people to spend my
time with.
Finally, I would like to thank Chris Brady, without whom my life would have
Declarations
This thesis is submitted to the University of Warwick in support of my application
for the degree of Doctor of Philosophy. It has been composed by myself and has not
been submitted in any previous application for any degree. This thesis represents my
own work except where stated otherwise. Parts of this thesis have been published
during my period of study, as outlined below:
Chapters 3 and 6 are based on: Carter, P. J.; Marsh, T. R.; Steeghs, D.;
Groot, P. J.; Nelemans, G.; Levitan, D.; Rau, A.; Copperwheat, C. M.; Kupfer, T.
and Roelofs, G. H. A., “A search for the hidden population of AM CVn binaries in
the Sloan Digital Sky Survey”, MNRAS, 429, 2143 (2013).
Chapter 4 is based on: Carter, P. J.; Steeghs, D.; Marsh, T. R.; Kupfer, T.;
Copperwheat, C. M.; Groot, P. J. and Nelemans, G., “The AM Canum Venaticorum
binary SDSS J173047.59+554518.5”, MNRAS, 437, 2894 (2014).
Chapter 5 is based on: Carter, P. J.; Steeghs, D.; de Miguel, E.; Goff, W.;
Koff, R. A.; Krajci, T.; Marsh, T. R.; Gänsicke, B. T.; Breedt, E.; Groot, P. J.;
Nelemans, G.; Roelofs, G. H. A.; Rau, A.; Koester, D. and Kupfer, T., “The
helium-rich cataclysmic variable SBSS 1108+574”, MNRAS, 431, 372 (2013).
Chapter 7 is based on: Carter, P. J.; Gänsicke, B. T.; Steeghs, D.; Marsh,
T. R.; Breedt, E.; Kupfer, T.; Gentile Fusillo, N. P.; Groot, P. J. and Nelemans,
G., “Two new AM Canum Venaticorum binaries from the Sloan Digital Sky Survey
III”, MNRAS, 439, 2848.
The spectrum of SDSS J1043+5632 shown in Fig. 3.9 was obtained and
re-duced by D. Levitan. Calculations of the number of AM CVns expected in the SDSS
footprint based on Nelemans et al. (2001)’s population synthesis (section 3.7) used
data and code provided by G. Nelemans and G. H. A. Roelofs.
The photometry of SBSS 1108+574 presented in chapter 5 was carried out
and reduced by observers from the Centre for Backyard Astrophysics (CBA).
Analy-sis of this photometry (section 5.3.2) was originally conducted by E. de Miguel, and
was repeated by myself during preparation of the paper. Sections 5.2.2 and 5.3.2 are
partly based on material written by E. de Miguel. The white dwarf model fitting
shown in Fig. 5.2 was performed by B. T. Gänsicke, who also wrote the description
of this given in section 5.3.1.
B. T. Gänsicke carried out the period analysis presented in chapter 7, and
Abstract
The AM Canum Venaticorum (AM CVn) binaries are a rare group of hydrogen-deficient, ultrashort period, mass-transferring white dwarf binaries, some of which may be Type Ia supernova progenitors. These systems represent the end product of several finely-tuned evolutionary pathways, and as such are of great inter-est for binary stellar evolution theory. They are also some of the stronginter-est known sources of low-frequency gravitational waves. Establishing their space density is important for constraining evolutionary models, and the signals we expect to de-tect from the Galactic population. This has been difficult as much of the known population has been discovered in a heterogeneous manner.
In this thesis I present the latest results from a spectroscopic survey de-signed to uncover the hidden population of AM CVn binaries in the photometric database of the Sloan Digital Sky Survey (SDSS). This small, colour-selected sample of∼2000 candidates, is expected to contain the majority of all AM CVn binaries in the SDSS. The survey is now approximately 70 per cent complete, and the discovery of only seven new AM CVn binaries indicates a lower space density than previously predicted.
Characterisation of the sample requires detailed follow-up observations after the initial discovery, in order to determine the orbital period. I present time-resolved spectroscopy of the recently-discovered AM CVn binary SDSS J173047.59+554518.5, and the dwarf nova SBSS 1108+574. The orbital period I measure for SDSS J1730 confirms its ultracompact binary nature. The quiescent spectrum of SBSS 1108+574 is unusually rich in helium compared to typical cataclysmic variables (CVs). I find that its orbital period is significantly below the normal CV period minimum. This indicates that the donor in SBSS 1108+574 is highly evolved, making it a candidate for the often-dismissed ‘evolved CV’ channel for AM CVn binary formation.
Chapter One
Introduction
Of all the ‘stars’ we see when we gaze into the night sky, only about half of these are actually single stars, the rest are multiple systems consisting of two or more
stars orbiting each other due to their mutual gravitational attraction. The stars
in many of these systems are sufficiently detached that they have almost no effect on one another, evolving in the same manner as isolated stars (Carroll & Ostlie,
2006). Stars in close binary systems, however, live much more interesting lives, their evolution governed by their companion.
The stars in close binary systems will interact at some point during their
evolution. As stars enter the later stages of their lives they expand, and the surface
of one or both of the stars will be distorted by its companion, causing material to flow from one star to the other. This can lead to a wide variety of phenomena including
Algols and W UMa contact systems. If the stellar envelope expands rapidly, it can
grow to encompass both stars in a common envelope (CE). The CE phase rapidly reduces the orbital separation of the two components (Paczyński, 1976), leading to
the very close binary systems that are some of the most interesting objects in the
Galaxy, including X-ray binaries, double white dwarf binaries, cataclysmic variables (CVs), and the progenitors of gamma-ray bursts (Ivanova et al., 2013).
The binary star system with the shortest known orbital period consists of two
interacting white dwarfs that complete one orbit every 5 minutes (HM Cnc; Roelofs et al., 2010). It belongs to the rare class of objects known as the AM Canum
Venaticorum (AM CVn) binaries. This thesis is concerned with the population of
1.1
Close binary stars
1.1.1 Roche geometry
In order to gain an understanding of close binary star systems and their many
interesting properties, it is useful to examine a basic concept in the theory of binaries, the Roche geometry. Consider the gravitational potential,Φ, a test particle would experience in the co-rotating coordinate frame of the binary; this is comprised of the separate gravitational potentials of the two stars, considered to be point masses,
and a third term originating from the centrifugal force (e.g. Frank, King & Raine,
2002). With the primary star at the origin and the secondary a distance a along thex-axis, this can be expressed as,
Φ =− GM1
(x2+y2+z2)12
− GM2
((x−a)2+y2+z2)12
−ω2
2 [(
x− aM2 M1+M2
)2
+y2
]
,
(1.1) where G is the gravitational constant, M1 and M2 are the masses of the primary and secondary stars, andω is the angular velocity of their orbit.
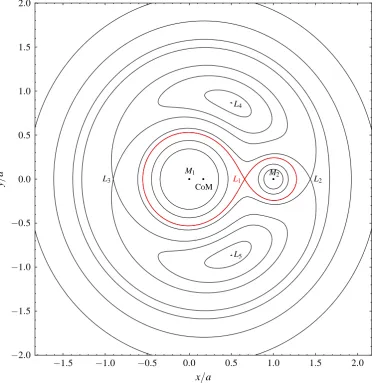
The largest closed equipotential surface (Φ= constant) of each star is known as its Roche lobe. The Roche lobes of the two stars touch, along the line joining
their centres, at the inner Lagrangian point,L1. The Roche equipotentials depend solely upon the mass ratio of the binary, with the scale set by the binary separation,
a. Fig. 1.1 shows equipotential surfaces in the xy-plane for a binary system with a mass ratio (q = M2
M1) of 0.2.
The Lagrange points are stationary points in the potential, at which a test
particle would experience zero resultant force. The primary Lagrange point,L1, is found at the point where the Roche lobes of the two objects meet. Material inside the critical surface defined by the Roche lobe is gravitationally bound to the star,
but at theL1 point the material is not bound to either star.
Thus if a star’s atmosphere filled its Roche lobe, matter would be able to escape the stellar surface via the primary Lagrange point. If the surface of a star
expands beyond the extent of its Roche lobe, this material is no longer bound to
the parent star; when this material enters the Roche lobe of its companion it will be bound to the companion instead. Thus if a star expands slowly, material at its
−1.5 −1.0 −0.5 0.0 0.5 1.0 1.5 2.0
x/a
−2.0 −1.5 −1.0 −0.5
0.0
0.5
1.0
1.5
2.0
y
/
a M1 M2
CoM L1 L2
L3
L4
[image:17.595.134.511.186.570.2]L5
Figure 1.1: Equipotential surfaces of the Roche geometry for a binary with a mass
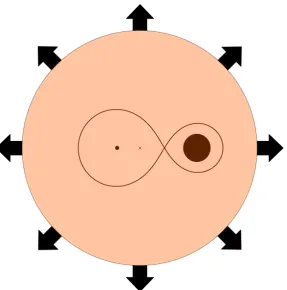
Figure 1.2: Schematic representation of the common envelope phase. The core of the evolved star (black dot in the larger Roche lobe) and the less massive main sequence star (large filled circle in the smaller lobe) orbit around the centre of mass of the system (cross) inside a common envelope. The envelope extracts angular momentum from the binary orbit and is ejected from the system. Based on fig. 11 from Iben (1991).
1.1.2 Binary evolution
Binaries can be divided into one of three subgroups based on whether the stars fill
their Roche lobes. Detached systems are those in which neither star fills its Roche lobe, both stars are approximately spherical, as represented by the small circles in
Fig. 1.1. Binaries in which one component fills its Roche lobe are known as semi-detached systems; those systems in which both stars fill their Roche lobes are known
as contact binaries.
Most binary star systems are detached, the orbital separation is so great that neither component ever fills its Roche lobe, and the two stars evolve almost exactly
as isolated stars of the same mass. In some binaries, however, the stars are close
enough together when the more massive component evolves off the main sequence (more massive stars evolve faster), that its surface expands beyond its Roche lobe.
companion much faster than the companion can readjust to the accreted mass, so
the material builds up on the surface of the second star until it too fills its Roche lobe (Iben, 1991). The envelope of the red giant now engulfs both the core of the giant
and the companion star (as depicted in Fig. 1.2), this is called the common envelope
(CE) phase. The core of the giant and its companion experience drag forces from the CE, which extract angular momentum from the binary orbit, causing the stars to
decrease their separation, and deposit energy in the envelope (e.g. Paczyński, 1976).
The physics of the CE phase are not fully understood (e.g. Nelemans et al., 2000; Toonen & Nelemans, 2013), but the result is expulsion of the common envelope,
leaving the newly formed compact object in a tighter orbit with its companion.
The exact nature of the remnant that emerges from the CE phase depends upon the mass and evolutionary state of the progenitor. Main-sequence progenitors
with masses in the range∼1 to∼7M⊙ will produce either a He white dwarf or a CO white dwarf (Iben, 1991).
The unstable mass transfer that initiates the common envelope phase occurs
because the loss of mass causes the Roche lobe of the primary to shrink more rapidly
than its radius, leading to a runaway transfer of mass that the secondary is unable to accommodate. Stable Roche lobe overflow is possible if the mass loss would
cause the Roche lobe to expand. For the case of conservative mass transfer (no angular momentum is lost from the binary), stable mass transfer occurs for q < 56 (e.g. King, 1988). In order for stable Roche lobe overflow to be sustained, some
mechanism must act to bring the stellar surface back into contact with its Roche lobe, for example, via shrinking of the Roche lobe due to loss of angular momentum
from the system.
There are many possibilities for the further evolution of a close binary system, depending on the initial masses of the stars, and the orbital separation and relative
masses of the objects that emerge from the CE phase. Binary evolution is described
in more detail by Iben (1991). Two classes of binaries that form after passing through a CE phase, cataclysmic variables (CVs) and AM Canum Venaticorum (AM CVn)
binaries, are discussed further in sections 1.2 and 1.3. Before we come to these I
first discuss three further subjects that are of great importance to both CVs and AM CVns, and to close binaries in general.
1.1.3 White dwarfs
White dwarfs are compact, roughly Earth-sized objects that are the most common end-point of stellar evolution. They are extremely dense objects consisting of an
As they are supported against gravitational collapse by degeneracy pressure, they
have a so-called inverse mass-radius relation – as the mass increases the radius decreases. Whilst a relativistic treatment is required to fully understand the white
dwarf mass-radius relation, its inverse nature naturally implies a maximum mass
limit, known as the Chandrasekhar mass (Chandrasekhar, 1939), MCh ≃ 1.4 M⊙
(e.g Koester & Weidemann, 1980). Above this mass the gravitational forces would
cause the electrons to combine with the nuclei, and the object would collapse into a
neutron star. It is generally thought that white dwarfs with CO cores approaching this mass limit via accretion will instead undergo a runaway thermonuclear explosion
known as a Type Ia supernova (SN Ia; e.g. Hillebrandt & Niemeyer, 2000), though
collapse into a neutron star may occur at high accretion rates (e.g. Saio & Nomoto, 1985).
We observe only the thin atmosphere on the surface of a white dwarf, and it
is this atmosphere that largely controls the evolution and appearance of the white dwarf. White dwarfs are usually classified according to the scheme defined by Sion
et al. (1983), based on the strongest elements observed in their spectra. The most
common type are the hydrogen atmosphere, DA, white dwarfs.
As the end point in the evolution of ∼95 per cent of all main sequence stars (Koester & Weidemann, 1980), close binaries often contain one or two white dwarfs. The typical mass of field white dwarfs is ∼0.6 M⊙ (Liebert, Bergeron & Holberg, 2005), and it is only through close binary evolution that white dwarfs are able to
accrete sufficient material to explode as Type Ia supernovae.
1.1.4 Angular momentum loss
As I have discussed, the CE extracts angular momentum from the orbit, shrinking
the separation of the two stars and expelling the envelope. There are two further
mechanisms for angular momentum loss that are important to our understanding of the accreting systems that are the subject of this work.
Magnetic braking
The spin rates and magnetic activity of late-type stars, including our own Sun, are
correlated, and decrease with age (e.g. Skumanich, 1972). Stars are expected to ‘spin down’ at a rate correlated with their spin rate, due to the outward flow of
ionised particles (e.g. Weber & Davis, 1967; Iben, 1991). The magnetic field forces
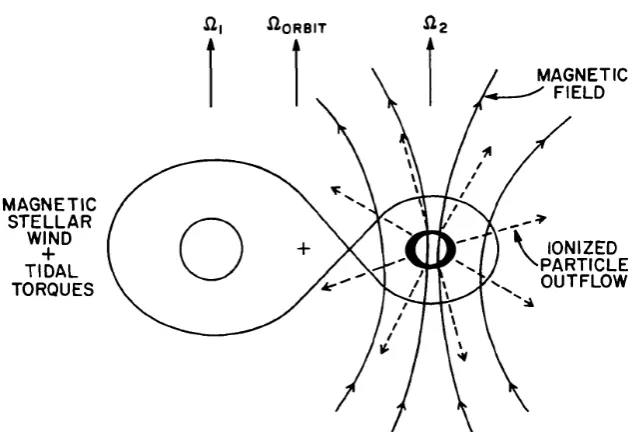
Figure 1.3: Schematic view of magnetic braking in close binary systems. Ionised particles are forced to flow along the magnetic field lines, before being released at large distances from the star, carrying away angular momentum. The angular momentum is extracted from the orbit due to synchronisation caused by tidal torques. From Iben (1991).
away angular momentum. The outflow of particles along the magnetic field, called
amagnetic stellar wind thus extracts spin angular momentum from the star – this process is known asmagnetic braking.
It is expected that low-mass main sequence stars in close binaries will also
produce a magnetic stellar wind, and since such stars will have spin periods very close to the orbital period, due to tidal locking, they are expected to have strong
magnetic fields. Such stars should also, therefore, lose spin angular momentum via
magnetic braking. The tidal torques on the star return this lost spin, and hence the magnetic stellar wind extracts angular momentum from the orbit, causing the
separation to decrease (Verbunt & Zwaan, 1981). Magnetic braking in a close binary system is illustrated in Fig. 1.3.
As the orbital separation decreases so does the period, and hence the spin
rate increases, increasing the magnetic stellar wind, and the rate at which angular momentum is lost (Iben, 1991).
Gravitational wave radiation
In accordance with the general theory of relativity, binary stars radiate energy in the
to generate these waves is provided by the binary orbit, causing a loss of angular
momentum. The rate at which angular momentum (J) is lost via gravitational radiation is given by (e.g. King, 1988),
˙
JGR J =−
32G3
5c5
M1M2(M1+M2)
a4 , (1.2)
wherec is the speed of light. This is a strong function of the orbital separation,a, and so angular momentum losses due to gravitational radiation are only significant at very small separations, or equivalently, very short orbital periods (Paczyński,
1967).
1.1.5 Accretion disc formation
Consider once again a semidetached binary, in which the less massive star fills its
Roche lobe, causing material to flow out via the L1 point.
From the perspective of the primary, a stream of matter with high angular momentum is ‘squirted’ into its Roche lobe. This angular momentum prevents the
material from falling straight onto the star (which would violate conservation of
angular momentum); it instead follows a ballistic trajectory, deflected around the star by the Coriolis force. There are several possibilities for the further behaviour of
the matter stream, depending on the nature of the system. Provided the magnetic
field of the primary is weak, and that the orbital period is not too short (Warner, 1995), direct impact of the stream onto the accretor will not occur. The stream
will then come back around the primary to collide with itself. The collisions cause
the gas to lose energy, however, particles retain their angular momentum, and the matter stream settles into a ring around the primary (Frank, King & Raine, 2002).
Material in this ring orbits with Keplerian angular velocities; particles closer
to the primary move faster than particles farther away. This differential rotation causes friction in the ring, which heats the gas, causing energy to be radiated away.
There is only one source for the lost energy, the potential in which the gas is
orbit-ing; radiating away this gravitational energy will cause the gas to sink towards the primary star (Pringle, 1981). This requires the loss of angular momentum; which,
since it is always conserved, requires that some material move to larger radii. As
this continues, the ring of gas spreads out into a thin disc, as shown in Fig. 1.4. Material continually flows through the disc, spiralling inwards to be accreted onto
The gas stream follows a ballistic trajectory until it collides with itself.
The gas settles into a ring at the circularisation radius.
The ring spreads due to viscosity.
[image:23.595.138.515.121.680.2]A disc is formed.
Figure 1.4: Illustration showing the formation of an accretion disc via Roche lobe
This is anaccretion disc, and is responsible for many of the observed properties of CVs and their ultracompact counterparts.
It should be noted that the viscosity that allows material and angular
mo-mentum to flow through the disc is not well understood. Accretion discs are far too
diffuse for molecular viscosity to be significant (e.g. Lynden-Bell, 1969), the stan-dard theory suggests that turbulence causes exchange of angular momentum and
acts as viscosity (Shakura & Sunyaev, 1973). The viscosity, ν, is parametrized in terms of the sound speed,cs, and the height of the disc, H,
ν = α csH, (1.3)
where the parameterα represents the size of the viscosity as a fraction of the max-imum case, where the turbulent eddies have the same height as the disc (Pringle,
1981). This turbulence is generally thought to be driven by magnetic instabilities
(e.g. Hawley & Balbus, 1998).
1.2
Cataclysmic variables
Cataclysmic variable stars (CVs) are semi-detached systems in which a white dwarf
accretes matter from a Roche lobe filling donor star. Their name derives from the characteristic large changes in brightness which many of them exhibit.
1.2.1 Types of CV
CVs can be divided into two broad categories depending on the strength of the accreting white dwarf’s magnetic field.
Inmagnetic systems the magnetic field of the white dwarf disrupts the accre-tion disc, and the gas stream flows along the field lines to accrete onto the magnetic poles. These are further subdivided intopolars, in which the magnetic field is strong enough to prevent a disc from forming, andintermediate polars, which have weaker fields, allowing a truncated disc.
Thenon-magneticsystems have white dwarfs with very weak magnetic fields, the accretion disc is not disrupted by the weak field, and accretion occurs where the
disc meets the surface of the white dwarf.
The non-magnetic CVs are usually classified either as nova-like systems, which are ‘non-eruptive’ and show no large changes in brightness, ordwarf novae.
0 20 40 60 80 100 120 140
MJD−55865.5
0 5000 10000 15000 20000
F
lu
x
(e
−
s
−
1 )
Figure 1.5: Part of theKepler light curve of the dwarf nova V344 Lyrae, showing a
series of normal outbursts and one superoutburst. The increase in the amplitude of the normal outbursts as the system builds towards the superoutburst, and the precursor outburst thought to trigger the superoutburst can be seen. Also noticeable is the significant modulation during the superoutburst caused by superhumps.
days to tens of years (Warner, 1995). These outbursts are thought to be due to an instability in the accretion disc, as will be discussed in the next section.
1.2.2 Dwarf nova outbursts
The presence of large amplitude dwarf nova outbursts implies an increase in the
luminosity of the accretion disc (see Fig. 1.5). Osaki (1974) and H¯oshi (1979) proposed a disc instability model to explain these outbursts.
Material is transferred from the secondary at a rate higher than it can be
transported through the disc by viscous processes, causing material to build up in the disc, increasing the surface density. This gradually increases the viscosity,
which leads to an increase in temperature. When the temperature reaches the point
at which hydrogen begins to ionise, any further increase in temperature causes a huge increase in opacity, and hence a rapid rise in temperature, fully ionising the
hydrogen, and the disc reaches a new equilibrium state (e.g. Hellier, 2001).
In the hot, bright, ionised state the viscosity of the disc is much higher, and so material flows through the disc much faster, and increases the accretion rate onto
the white dwarf. The luminosity of the system increases, and the excess matter is drained from the disc.
The surface density and temperature decrease until the temperature is no
longer high enough to keep all of the hydrogen ionised. At this point the high opacity returns, and a small drop in temperature results in the ions recombining, and the
Figure 1.6: Schematic representation of the dwarf nova cycle. The S-curve relationship between surface density,Σ, and temperature,T, is the cause of the dwarf nova outburst. From Hellier (2001).
cycle is represented by the well known ‘S-curve’ in a plot of the disc’s temperature
against its surface density, as shown in Fig. 1.6.
Material then begins to build up again towards a new outburst. This is
discussed in more detail by Smak (1984).
1.2.3 Superoutbursts and superhumps
As well as these ‘normal outbursts’, a subclass of dwarf novae known as the SU UMa
stars also show superoutbursts, which are brighter than normal outbursts, and last longer. An example of a dwarf nova light curve is shown in Fig. 1.5, both a series of normal outbursts and a brighter superoutburst can be seen.
During a superoutburst, tidal interactions between the disc and the donor
star cause the disc to become asymmetric. The increased viscous dissipation caused by this resonant interaction between the donor and the distorted disc, leads to
periodic brightness variations known as superhumps (e.g. Whitehurst, 1988). The observed superhump period (Psh), which is typically a few percent longer than the orbital period, is the beat period between the orbital period of the system and the
As the superhump phenomenon is due to resonance, and the precession rate
for resonant orbits depends upon the mass ratio of the system, there is a strong link between the superhump period and the mass ratio (e.g. Patterson et al., 2005). The
superhump period-excess,
ϵ= (Psh−Porb)
Porb
, (1.4)
is found to increase with increasing mass ratio,q. An empiricalϵ−qrelation can be derived from eclipsing dwarf novae, in which the mass ratio and superhump excess
can be measured independently (Patterson et al., 2005; Knigge, 2006; Kato et al., 2009).
1.2.4 CV evolution CV formation
CVs form from a binary containing two main sequence stars of different mass,
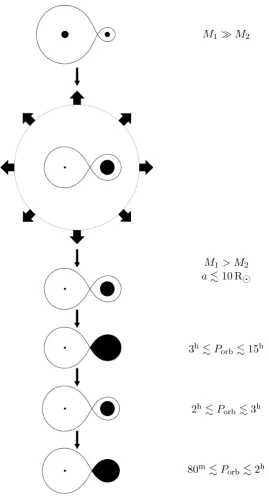
ini-tially separated by a few hundred solar radii, with an orbital period of about 10 years (Warner, 1995). The process of CV formation is depicted in Fig. 1.7. As has
been discussed, the more massive star evolves fastest, and expands to become a red
giant. A common envelope phase then begins and the orbit shrinks dramatically. At the end of the CE phase, in order for a CV to form, the emerging stars
must be a white dwarf and a low mass main sequence star, with a mass smaller than
or similar to that of the white dwarf (Warner, 1995). The orbit continues to shrink due to magnetic braking, eventually driving the secondary star to fill its Roche lobe.
The system then begins its new life as a CV.
Period distribution
The orbital period of a CV is often one of its most precisely known parameters (Warner, 1995), and immediately reveals something about the scale of the binary
(via Kepler’s third law). The orbital period distribution of CVs, Fig. 1.8, shows
several interesting features (Gänsicke et al., 2009; Knigge, Baraffe & Patterson, 2011):
• There is an apparentperiod minimum at∼1.3 hours, below which only a spe-cial subclass, the AM CVn stars (discussed later), are found;
• aperiod gapwhere there is a relative deficiency in the number of CVs, at about 2.2 to 2.8 hours;
M1 ≫M2
M1> M2 a≲10 R⊙
3h ≲Porb ≲15h
2h ≲Porb ≲3h
[image:28.595.180.450.105.606.2]80m≲Porb ≲2h
Figure 1.7: The formation and evolution of CVs. Shown are the Roche lobes and the
1 2 3 10
Porb (hours)
0 20 40 60 80 100 120
N
u
m
b
er
o
f
sy
st
em
s
p
er
io
d
m
in
p
er
io
d
g
ap
[image:29.595.133.509.108.333.2]AM CVns
Figure 1.8: The distribution in orbital period of known CVs, data from Ritter &
Kolb (2003). The normal period minimum at∼80 minutes and the period gap at about 2–3 hours are labelled. The objects with periods below this minimum are the AM CVn binaries. The long-period cut-off at about 12 hours is also visible.
This distribution can be understood as the signature of CV evolution.
Stable mass transfer generally requires that the secondary have a lower mass
than the white dwarf. Since white dwarfs have a maximum mass limit (the Chan-drasekhar mass, 1.4 M⊙), the secondary must also have a mass below this limit. Since the size of a binary increases with orbital period, and filling a larger Roche lobe requires a more massive star, the mass of the secondary must increase with
orbital period (Hellier, 2001). The upper mass limit thus imposes an upper period
limit of about 13 hours (King, 1988). The systems detected above this limit are explained as having secondaries that are evolving towards being a giant, these will
be much larger for a given mass than for normal red dwarfs (Hellier, 2001).
It has been noted that the mass-transfer rates below the period gap are char-acteristic of gravitational radiation, whereas the rates observed for systems above
the gap are characteristic of accretion driven by magnetic braking (e.g. Knigge,
Baraffe & Patterson, 2011). This leads to the suggestion that the period gap is caused by the switching off of magnetic braking at∼3 hours. The preceding mass loss has driven the secondary out of equilibrium and once magnetic braking shuts
off, the secondary contracts to its correct radius, turning off mass transfer, making the system much fainter, and hence much more difficult to detect. Gravitational
contact at about 2 hours; mass transfer resumes and evolution continues at the lower
rate driven by GW radiation (Faulkner, 1971). Exceptions include systems which begin mass transfer in the gap and have thus not been driven out of equilibrium, and
magnetic systems in which accretion is affected by the primary’s strong magnetic
field. Possible reasons for the turn-off of magnetic braking are discussed by King (1988).
As the decreasing orbital period reaches∼80 minutes (Gänsicke et al., 2009) the mass of the red dwarf donor becomes too low to sustain hydrogen burning, and it is driven out of thermal equilibrium, becoming partially degenerate. It is
no longer supported by the pressure of the gas, but instead is supported by the
quantum-mechanical requirement that electrons not occupy the same state. The secondary no longer shrinks in response to mass loss (Rappaport, Joss & Webbink,
1982). As it continues to lose mass the orbital period increases, giving rise to the
period minimum. The binary then continues to evolve towards longer periods with decreasing mass transfer rates. The period minimum for normal hydrogen-rich CVs
is predicted theoretically to occur at∼65–70 minutes (Rappaport, Joss & Webbink, 1982; Kolb & Baraffe, 1999), and is observed at∼80 minutes (Gänsicke et al., 2009). 1.2.5 Spectroscopic features
The observed spectra of CVs are a combination of the spectra of the accretor, donor
and accretion flow. This gives rise to distinctive spectra.
The white dwarf
The spectrum of a white dwarf is close to that of a blackbody of the same
tempera-ture. The thin atmosphere gives rise to broad absorption lines, usually of hydrogen
or helium. For the accreting white dwarfs in CVs the optical region of the electro-magnetic spectrum will feature a blue continuum, dominated by Balmer absorption
lines.
The donor star
In most CVs the cool red dwarf donor will only contribute significant flux in the red part of the optical spectrum. The spectra of cool main sequence stars are often
Figure 1.9: Formation of a double peaked emission line from an accretion disc. (a) An accretion disc in a binary of mass ratioq= 0.15viewed from above. Loci of constant radial velocity form a dipole pattern on the disc surface. (The radial extent of the disc is shown by the dashed line, the solid line represents the stars’ Roche lobes). (b) The emission line profile produced by the disc when viewed from below (as indicated by the arrow). Emission in the shaded velocity bins originates from the corresponding areas of the disc. From Horne & Marsh (1986)
The accretion disc
The continuum light from accretion discs is not well matched by a single blackbody. Unlike the surfaces of stars, an accretion disc has a strong temperature gradient
across its surface, with the outer edge being relatively cool, and the inner regions,
deep in the potential well of the accretor, being much hotter. Accretion discs are usually modelled as a series of blackbodies emitting from a series of annuli of the
disc. This leads to a relatively flat continuum in the optical part of the spectrum
(Hellier, 2001).
Optically thin regions of accretion discs also produce line emission. Doppler
shifting of the light originating in the rotating disc leads to significant broadening
of these emission lines when viewed at higher inclinations. The Keplerian rotation ensures that the inner regions of the disc will have higher orbital velocities than the
outer parts. This leads to a dipole pattern of radial velocity across the accretion
disc surface (Horne & Marsh, 1986), see Fig. 1.9a, causing the characteristic double peaked line profile shown in Fig. 1.9b.
An example of a three component model of the optical spectrum of a CV is shown in Fig. 1.10. In this system the absorption lines from the white dwarf are
clearly visible in the spectrum. The combined contributions from the white dwarf,
the disc and the donor provide a good match to the data.
We do not always see line emission from CVs, in some cases, particularly
during dwarf nova outbursts, we instead see absorption lines from the optically thick
Figure 1.10: Three component model of the optical spectrum of the dwarf nova HS 2219+1824. The observed spectrum is the upper grey line, the grey lines below this are the model spectra of the white dwarf, the disc and the donor. The sum of the three components is plotted as a black line, providing a good fit to most of the continuum and the Balmer lines. From Rodríguez-Gil et al. (2005).
outbursting disc is usually sufficiently bright as to obscure the features displayed by
the white dwarf and the donor.
1.3
AM Canum Venaticorum binaries
Whilst the number of CVs drops dramatically at the period minimum, it is not an
absolute cut-off. There are several objects with periods less than∼1 hour, most of these belong to the AM Canum Venaticorum (AM CVn) class: ultra-short period
binaries consisting of a white dwarf accreting helium-rich material from a degenerate
or semidegenerate donor. Their hydrogen deficient secondaries are much smaller for the same mass as compared to hydrogen rich stars, and therefore fill their Roche
lobes at much smaller separations, giving orbital periods ranging from 5 (Israel et al., 2002) to 65 minutes (Ruiz et al., 2001). The AM CVn binaries appear as faint blue
1.3.1 Properties
The gravitational wave emission thought to drive the evolution of the AM CVn
binaries leads to a strong dependence of the mass accretion rate, and hence their
observed properties, on the orbital period. The observational characteristics of an AM CVn binary are commonly separated into four distinct categories, based on a
combination of empirical evidence and theoretical models.
1. Those with the shortest orbital periods (below ∼10 minutes) are expected to undergo direct impact accretion, with no accretion disc forming (Marsh & Steeghs, 2002; Ramsay et al., 2002; Roelofs et al., 2010).
2. At short orbital periods (∼10 to∼20 min), the mass transfer rate is sufficiently high to keep the disc in a stable hot, bright state (e.g. HP Lib, O’Donoghue
et al. 1994; SDSS J1908+3940, Fontaine et al. 2011), similar to novalike CVs.
3. At intermediate orbital periods, the discs undergo quasi-periodic outbursts, cycling between a faint, quiescent state with a cool disc, observationally
char-acterised by strong emission lines, and a hot, bright state, charchar-acterised by
absorption lines from the optically thick disc (e.g. CR Boo, Wood et al. 1987; SDSS J0129+3842, Shears et al. 2012; PTF1 J0943+1029, Levitan et al. 2013).
4. At the longest orbital periods (≳45 min), corresponding to the lowest mass transfer rates, the disc is thought to be in a stable faint state, and the spectra
of these systems are hence dominated by strong emission lines (e.g. GP Com, Nather, Robinson & Stover 1981; SDSS J1552+3201, Roelofs et al. 2007c).
Espaillat et al. (2005) argue that the lack of a detectable superhump period in ES Cet (Porb =10.3 min) indicates that it is a direct impact accretion system, however, spectroscopic observations show disc-like emission (Steeghs et al., in
prepa-ration). There is also evidence to suggest HM Cnc (Porb =5.4 min; Israel et al. 2002) is a direct impact system, also containing a small disc or ring around the white dwarf
that produces double-peaked emission (Roelofs et al., 2010).
Spectra of AM CVn binaries
For the intermediate period systems, such as V803 Cen (Porb = 26.6min; Roelofs et al. 2007b), the spectra are seen to change from high states with absorption lines
to low states with emission lines, the transition being caused by the same
4000 5000 6000 7000 8000 9000
Wavelength ( ˚
A)
0 5 10 15 20
F
λ(1
0
− 1 7er
g
cm
− 2s
−1
˚ A
− 1
)
H e I 3 8 8 8 H e I 4 0 2 6 H e I 4 4 7 1 H e I 4 9 2 1 H e I 5 0 1 5 H e I 5 8 7 5 H e I 6 6 7 8 H e I 7 0 6 5 H e I 7 2 8 1 H e II 4 6 8 6 S i II F e II 5 1 6 9 N I N IFigure 1.12: Sloan Digital Sky Survey spectrum of SDSS J1240−0159 in a quiescent
state. The strongest emission features have been labelled. In contrast to ordinary CVs (e.g. Fig. 1.10), AM CVn spectra are dominated by helium features.
Tsugawa & Osaki, 1997; Kotko et al., 2012; Ramsay et al., 2012), with the exception that the disc is helium dominated not hydrogen dominated.
Spectra of V803 Cen in both outburst and quiescent states are shown in
Fig. 1.11; the double peaked profile, characteristic of an accretion disc, is evident. The high state spectrum is similar to that of the shorter period absorption line
systems, such as AM CVn itself, the low state spectrum is like to that of the long
period systems, such as SDSS J0902+3819 (Rau et al., 2010).
The quiescent spectrum of the AM CVn binary SDSS J1240−0159 (Porb =
37.4min; Roelofs et al. 2005) is shown in Fig. 1.12. The blue continuum and strong helium emission lines are characteristic of the quiescent state in AM CVn binaries. The quiescent spectrum of SDSS J1240−0159 shows clear absorption wings around the Hei 4471 and 4921 Å emission lines, thought to be due to the accreting white
dwarf. Bildsten et al. (2006) show that the optical continuum is dominated by the accreting white dwarf in long period systems, however the absorption lines become
weaker as the accretor cools, and so have only been seen in a small number of
systems.
1.3.2 Formation and evolution
The AM CVn binaries are the result of several possible fine-tuned evolutionary
CVn stars, each defined by the type of donor, two of which require the binary to
undergo a second CE phase. The progenitor in all 3 channels is a binary consisting of two main sequence stars of mass low enough to produce white dwarf cores. The
formation of AM CVns is summarised by Fig. 1.13.
The white dwarf channel
If the giant star develops a degenerate core during the second CE event, the result is a system with two degenerate stars (Paczyński, 1967; Faulkner, Flannery & Warner,
1972; Nather, Robinson & Stover, 1981). This is called the white dwarf channel.
The double white dwarf binary evolves to very short periods, starting mass-transfer at periods of a few minutes. In order to support stable mass-transfer the donor white
dwarf must be low mass, otherwise the stars will likely merge, possibly resulting in
a Type Ia supernova (Nelemans et al., 2001; Marsh, Nelemans & Steeghs, 2004).
The helium star channel
More massive secondaries exit the second CE event as a star with a non-degenerate helium core, these systems form the helium star channel (Savonije, de Kool & van
den Heuvel, 1986; Iben & Tutukov, 1987, 1991). In this channel the donor begins helium burning after the CE event. Helium burning may continue after mass
trans-fer begins, which can lead to composition changes in the secondary. These systems
evolve through a period minimum of about 10 minutes, when the helium star be-comes semidegenerate. If the helium is exhausted before Roche lobe overflow occurs
the helium star evolves into a white dwarf and the system belongs to the white dwarf
channel.
The evolved CV channel
If the donor fills its Roche lobe when the hydrogen abundance in its core is low, it
may evolve as a normal hydrogen CV, avoiding a second CE event. If the hydrogen
abundance becomes sufficiently low, it may eventually evolve into a long-period AM CVn (Thorstensen et al., 2002; Podsiadlowski, Han & Rappaport, 2003). This is
known as the hydrogen-star, or evolved CV channel. This formation channel has
generally been considered to be unimportant in comparison to the double white dwarf and helium star channels. Podsiadlowski, Han & Rappaport (2003), however,
argue that the evolved CV channel could contribute a significant fraction of the total
RX 0806
ES Cet
HP LIb Kl Dra V803 Cen CP Eri 2003aw CR Boo
GP Com CE 315 SDSS J1240 V407Vul
AM CVn
CV’s/LMXB’s Evolved donors Helium star donor
White dwarf donor
Figure 1.14: Evolutionary pathways for AM CVn stars in the period–M˙ plane. The
three formation channels are shown, along with the evolutionary path for normal CVs. Example known systems are shown at their orbital periods. From Nelemans (2005).
AM CVn evolution
Of critical importance to the formation is the evolution to shorter periods, which is
thought to be governed by angular momentum loss due to GW radiation (Paczyński,
1967). This drives the system after the end of the second CE event, reducing the separation of the stars and shrinking their Roche lobe radii. Once the separation
decreases to the point where the secondary fills its Roche lobe, mass transfer begins;
the system passes through a period minimum, and then evolves towards longer orbital periods due to mass loss driven by GW radiation. This is depicted for each
formation channel in Fig. 1.14.
As equation (1.2) shows, the rate of angular momentum loss thought to drive the evolution of AM CVn binaries is a strong function of the orbital separation. This
means that as the period (or separation) increases after the evolution through the
period minimum, the rate of the change in period (separation) decreases steeply. Thus the short period phase of AM CVn evolution is a small fraction of the lifetime
of an AM CVn binary. As the system continues to evolve towards longer periods the
discussed in section 1.3.1.
Recently, a number of possible AM CVn progenitor systems have been iden-tified via a survey searching for extremely low mass (ELM) white dwarfs (Brown
et al., 2010, 2012). Several of the detached white dwarf binaries discovered by this
survey have sufficiently low mass ratios that they are likely to survive the onset of mass transfer and form stable AM CVn systems, whilst the fates of other systems
are less clear, with both mergers and AM CVns as possible scenarios (Brown et al.,
2011). Brown et al. (2011) find that these ELM white dwarf binaries contribute at least 2 per cent to the total AM CVn population. Kilic et al. (2014) report
observa-tions of the ELM white dwarf binary SDSS J1741+6526 that indicate it has a mass
ratio of∼0.1, and will form an AM CVn system in the next ∼160 Myr.
AM CVn binaries may contribute to the Type Ia supernova population, the
accreting white dwarf undergoing thermonuclear disruption if the mass approaches
the Chandrasekhar mass via accretion (Solheim & Yungelson, 2005; Shen & Bildsten, 2009, 2014). They are also possible progenitors of rare sub-luminous SN Ia-like
events (‘SN.Ia’; Bildsten et al. 2007). The fate of most AM CVn systems, however,
is expected to be much less dramatic, continuing to evolve to longer orbital periods with ever decreasing mass-transfer rates.
1.3.3 Population studies
The fact that AM CVn stars are the result of a fine-tuned evolution makes them especially interesting for the study of binary stars. The CE phase is difficult to
model, due to its hydrodynamic nature, but is key to the formation of all close
binaries (Iben, 1991). That many AM CVns must have undergone two such phases during their evolution makes them very useful for calibrating models of binary star
evolution. A further property of the AM CVn stars that is of great interest, is
their gravitational wave radiation. They will be among the strongest objects to be detected by the proposedEvolved Laser Interferometer Space Antenna (eLISA), which, according to Nelemans, Yungelson & Portegies Zwart (2004), will detect a
large number of them. That many of these will also be detectable optically will allow independent measurements of the position and orbital period, leading to a better
determination of other parameters that can be derived from the GW signal. The
brightest short period AM CVns will serve as calibrators for theeLISA experiment (e.g. Amaro-Seoane et al., 2013; Nelemans, 2013). Also of great interest is the
Population synthesis
A key property for these possibilities, and increasing our understanding of binary
evolution, is the space density of AM CVn objects. In attempts to determine the
numbers of AM CVn stars in the galaxy Nelemans et al. (2001) have carried out population synthesis based on the two main formation mechanisms.
They find that for the white dwarf channel no accretion disc forms at the
onset of mass transfer, and that the final population from this channel depends heavily upon the effectiveness of the tidal coupling between the accretor and the
orbital motion. Stable mass transfer requires angular momentum to be returned to
the binary orbit; in the alternative case the spin of the accretor exceeds that of the binary and increases the GW radiation, decreasing the separation of the orbit. This
could then lead to a runaway that results in the white dwarfs merging. Accretion discs easily fulfil the tidal coupling requirement, but the situation is less clear for the
case of direct impact accretion. Efficient tidal coupling is therefore critical to the
formation of AM CVns via this channel (Nelemans et al., 2001; Marsh, Nelemans & Steeghs, 2004).
In the helium star channel, formation of AM CVn systems can be prevented
by thermonuclear runaway of accreted helium before period minimum. Accretion of material onto a carbon-oxygen white dwarf may trigger a detonation in the layer
of accumulated matter. Further, this can cause detonation of the CO dwarf core
(edge-lit detonation), which disrupts the system (Nelemans et al., 2001).
Nelemans et al. (2001) adopt two limiting cases for each formation channel:
an efficient case, in which the factors discussed above favour formation of AM CVns;
and an inefficient case, in which AM CVn formation is strongly suppressed. With slightly improved models (Roelofs, Nelemans & Groot, 2007) the population
synthe-sis leads to local space densities of 6.1×10⁻⁶pc−3 and 2.7×10⁻⁵pc−3 respectively for the inefficient and efficient cases.
Observational calibration
Roelofs, Nelemans & Groot (2007) use the six emission line AM CVns discovered
in a homogeneous manner in the Sloan Digital Sky Survey (SDSS) spectroscopic
database (discussed below) to calibrate the model populations. Parametrizing the colours and absolute magnitudes of the emission line systems with their orbital
periods and measuring the spectroscopic completeness as a function of colour, allows
population synthesis studies) is convolved with this completeness, the result is the
total number of emission-line AM CVn stars in the SDSS. Roelofs, Nelemans & Groot (2007) determine that there should be between 50 and 70 AM CVn stars in
SDSS photometry based on the models of Nelemans et al. (2001) and Nelemans,
Yungelson & Portegies Zwart (2004).
When calibrated with observations all the models give a local space density
of 1–3×10⁻⁶pc−3, which is lower than was expected. It is suggested that the white dwarf channel must be strongly suppressed, and that if the tidal coupling required to stabilise mass transfer between the two white dwarfs has a significant effect, the
helium star channel must also be severely suppressed.
1.4
Discovering AM CVn binaries
The first AM CVn binaries were discovered serendipitously in a variety of different
ways (e.g. Burbidge & Strittmatter, 1971; Israel et al., 1999). This made it impos-sible to study their population and to derive fundamental quantities required for
calibration of predictions from binary evolution theory. In the past ten years
dedi-cated surveys have tripled the number of known AM CVn binaries (Anderson et al., 2005, 2008; Roelofs et al., 2005, 2009; Rau et al., 2010; Levitan et al., 2011, 2013;
Carter et al., 2013). These homogeneous samples have allowed the first detailed
studies of the population, and estimation of the AM CVn space density.
1.4.1 The Sloan Digital Sky Survey
The Sloan Digital Sky Survey (SDSS) was originally designed to obtain CCD imaging
in five broad band filters of one quarter of the sky, along with spectroscopy of the million brightest galaxies and 100,000 brightest quasars (York et al., 2000). The
survey uses a 2.5 m telescope located at Apache Point Observatory, New Mexico.
The imaging camera contains 30 CCDs arranged in a grid; each of the five rows observing the sky through a different filter: u, g, r, i, z. The spectroscopy targets are selected from the imaging database and observed by a pair of fiber-fed
double spectrographs (Abazajian et al., 2009). The telescope can record 640 spectra at a time, the fibers are held by an aluminium plate, each specially drilled for the
selected galaxies in that region of the sky. Spare fibers are allocated to rare or
peculiar targets – the serendipitous objects.
Abazajian et al. (2009) report that with the Seventh Data Release, the
photometry for 357 million objects, and the spectroscopic database containing over
1.6 million spectra.
1.4.2 AM CVns in the SDSS
Many of the currently known AM CVn binaries have been discovered via systematic searches in the SDSS. Six of these were found in the SDSS spectroscopic database,
identified from their distinctive helium emission dominated spectra (Anderson et al., 2005, 2008; Roelofs et al., 2005), one more was found in the course of follow-up
of SDSS supernova candidates (Anderson et al., 2008), and a further 5 had been
discovered by 2010, via a spectroscopic survey of colour-selected objects from the SDSS, again identified by their helium emission line spectra (Roelofs et al., 2009;
Rau et al., 2010).
As has been mentioned, the AM CVn stars are all blue objects, and those identified or discovered in the SDSS occupy a small region in colour space (Anderson
et al., 2008). The six helium emission line objects found in the SDSS Data Release 6
(DR6) spectroscopic database were largely serendipitous; the spectroscopic follow-up to the imaging is targeted mainly at finding quasars and galaxies. In order to obtain
better estimates of the space density it is necessary to estimate the completeness
of the SDSS spectroscopic follow-up. Anderson et al. (2008) estimate completeness between 10–20 per cent and 70 per cent, depending upon the magnitude, and thus
adopted a lower limit of 24 per cent to the SDSS spectroscopic completeness in the
colour box around the known AM CVns. These estimates are similar to the more detailed study by Roelofs, Nelemans & Groot (2007), who suggest that further
follow-up spectroscopy of photometric candidates in the SDSS will further refine
their space density estimate.
1.4.3 A search for new AM CVns in the SDSS
The first new AM CVn object discovered through such an independent survey was
SDSS J080449.49+161624.8 (Roelofs et al., 2009). The sample for this survey was
selected from the SDSS photometric database, guided by the colours of the known AM CVns. Roelofs et al. (2009) give their selection criteria:
1. Object is a point source.
2. Object is not saturated in any filter.
3. g <20.5.
Figure
1.15:
Colours
(dereddened)
of
the
kno
wn
AM
CV
n
stars
in
the
SDSS
DR6,
together
with
the
colour-selected
sample.
The
op
en
star
sym
b
ol
designates
the
first
AM
CV
n
ob
ject
disco
v
ered
in
this
surv
ey
,
SDSS
J0804+1616.
The
blac
kb
o
dy
(BB)
co
oling
trac
k
and
mo
del
co
oling
trac
ks
for
h
ydrogen
(D
A)
and
helium
(DB)
atmosphere
white
dw
arfs
are
sho
wn.
The
arro
w
sho
ws
a
reddening
v
ector.
F
rom
Ro
elofs
et
al.
(2009
5. −0.42 +σg−r< g−r <0.02−σg−r
6. −0.33 +σr−i< r−i <0.03−σr−i
where
σu−g =
√
σu2+σg2+σE(u−g)2, (1.5) and similarly for the other colours. The assumed uncertainty in the reddening is
σE(u−g)2 = 0.5E(u−g), (1.6) and the uncertainties σu,g,r,i are the photometric errors on the SDSS magnitudes u, g, r, i.
The resulting sample, based on the SDSS DR6, is shown in Fig. 1.15. The sample has been cut off parallel to the blackbody cooling track in order to
min-imise contamination from DA and DB white dwarfs. Whilst this risks neglecting
several AM CVn stars, the spectroscopic completeness of the SDSS increases to-wards this cut-off, and as such it is unlikely that a large fraction of the AM CVn
population fall outside the chosen sample (Roelofs et al., 2009). After removal of
known sources and mistakes of the SDSS photometric data reduction pipeline, the final sample contained 1523 candidates. Roelofs et al. (2009) estimated that this
sample should contain about 40 new AM CVn stars based on an assumed
complete-ness of 90 per cent. Rau et al. (2010) reported discovery of a further four AM CVn objects discovered through this survey, lowering the expected total to 13 new AM
CVns from the ∼1500 candidates; already suggesting a lower space density than previously predicted.
1.4.4 Using outbursts to find AM CVns
An alternative approach to the colour-selection method is to search for outbursts
from AM CVn binaries. Both the Catalina Real-Time Transient Survey (CRTS; Drake et al. 2009) and the Palomar Transient Factory (PTF; Law et al., 2009)
provide repeat observations of wide areas of the sky that are used to produce a large
set of light curves. These light curves have been used to search for outbursts from AM CVn binaries and CVs, with targets that show outbursts identified by follow-up
spectroscopy.
This method has lead to the discovery of nine new AM CVn systems over the past four years (Levitan et al., 2011, 2013, 2014; Woudt, Warner & Motsoaledi,
2013). As I have discussed, the outbursting AM CVn systems are generally found